variety of missions such as (past) Voyager, Magellan, Galileo, MPF, Deep Space 1; (present) MER,. Cassini .... They also monitor the health and safety of the arm.
-
SpaceOps 2004 Conference
Mars Image Products: Science Goes Operational R.G. Deen, D.A. Alexander, J.N. Maki, NASA Jet Propulsion Laboratory, Pasadena, California 91109, USA.
1.O Introduction In recent years, the exploration of Mars by NASA has become more focused on in-situ missions such as Mars Pathfinder (MPF) and the amazingly successful Mars Exploration Rovers (MER) Spirit and Opportunity. While orbiters still play a major role in Mars exploration, the trend toward landers and rovers is likely to continue. Rovers especially have significantly different operational requirements than orbiters. Orbital mechanics is precise and predictable, allowing detailed planning of observations in advance. Ground-in-the-loop optical navigation is used, but relatively rarely. Rovers, however, are constantly finding themselves in new, unknown terrain. Operational plans must be made based on observations taken from the rover itself. The bulk of these observations are in the form of images. While some onboard autonavigation is used [5], the capability is limited, and the complexity and risk of most operations is such that Earth-based decision making is critical. The Multimission Image Processing Lab at JPL is responsible for the creation of most of these images and image-derived products for MER and other missions. MlPL has been involved in a wide variety of missions such as (past) Voyager, Magellan, Galileo, MPF, Deep Space 1; (present) MER, Cassini, Spitzer, Stardust, Mars Express; and (future) Mars Reconnaissance Orbiter (MRO), Mars Science Laboratory (MSL), Phoenix, and Deep Impact. MlPL has a history of supporting operational processes via optical navigation on many missions and the MPF rover, but the vast majority of images are processed for science and public outreach purposes. Because of the reliance of MER on imagery, MlPL is now in the critical path for MER operations. It is responsible for reconstructing instrument data from telemetry, systematic creation of various kinds of Reduced Data Records (RDRs, or derived products) from images, and creation of special products for operations, science, and public outreach. The MlPL processes, historically used for science, have been successfully used in a fast-turnaround operational environment with strict time requirements.
2.0 MIPL-Generated Products The products that MlPL generates for MER can be broken down into three broad classes: those derived from a single image, those derived from a stereo image pair, and those making use of multiple images. These products will be summarized below. Full details are available in [ I ] . Note that MlPL also processes telemetry for the non-image instruments Mossbauer, APXS, Mini-TES, and RAT, but they are not discussed further here. 2.1 Single-image products
The fundamental product is the original Experiment Data Record (EDR) (Figure 1). This image is
Montreal. Canada
- Mav 17 - 21 2004
1 nf 10
-
SpaceOps 2004 Conference reconstructed from telemetry by a telemetry processing system [telemetry] which is not further discussed in this paper. Inverse LUT: The cameras produce 12-bit images. A common compression method is to use
an onboard look-up table (LUT) to convert this to 8 bit data for transmission. An inverse LUT process recovers the original 12-bit data. Radiometric Correction: The images are radiometrically corrected by removing the effects of
exposure time and temperature, and applying a flat-field correction. [9] Linearization: This process removes lens distortion, resulting in stereo-aligned images (meaning
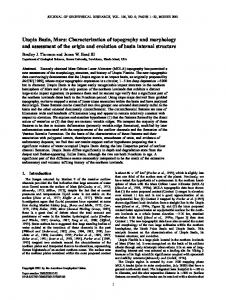
all line disparities are ideally 0). This makes the correlation process much easier. The effects are most dramatic for the fish-eye lenses of the front hazcam [4] (Figure 2). 2.2 Stereo-image products Disparity map: Stereo pairs of linearized images are correlated to create a disparity map, which
indicates which point in the right image matches each pixel in the left image. This is the first, most important, and most CPU-intensive step in recovering 3-D terrain information. XYZ image: For each pixel, the disparity maps are used to find its partner in the other eye.
Rays are then projected into space from those pixels using the images’ camera models [I51 to determine the point in XYZ space that best matches the pixel (which is where the rays come closest to intersecting). This directly represents the terrain (Figure 3). Range image: A simple Cartesian distance of XYZ points from the camera center (Figure 4). Terrain Wedge: A representation of the terrain for this image pair by decomposing the XYZ’s
into geometry triangles. Surface Normal: Small areas of XYZ’s are analyzed to determine the local surface normal at
each pixel (Figure 5). IDD Reachability: XYZ and Normal combine with Instrument Deployment Device (IDD) robot arm
kinematics to determine which points are reachable by the arm’s various instruments (Figure 6). 2.3 Multiple-image products Terrain Mesh: Multiple terrain wedges are combined to create a unified 3-D terrain model for
the rover’s surroundings. Rover planners use this to plan their traverses and IDD operations, ensuring the rover won’t hit anything. Mosaics: Multiple images are combined into panoramic mosaics. These mosaics are stitched
together using rover-supplied pointing, or pointing adjustment on the ground. In order to maintain scientific and operational accuracy, rubber-sheeting methods are not used for mosaics. The five supported projections are cylindrical, polar, vertical, perspective, and a cylindrical-perspective hybrid which is good for stereo panoramas (Figures 7-10).
3.0 RDR -generation software This section discusses the RDR-generation software for the bulk of the products. It does not discuss the terrain wedge or mesh software [14], or telemetry processing.
Montreal. Canada
- Mav 17 - 21 2004
7 of
In
-
SpaceOps 2004 Conference 3.1 Software History
The RDR-generation software is written using a core image processing system called VICAR (Video Image Capture And Retrieval), which has been under continuous development since the 1960’s [13]. This core software provides image I/O, user interface, and similar services, and is not discussed further here. The basic RDR generation programs were originally written for Mars Pathfinder, starting in 1994. This consisted of mosaics, correlation, XYZ, and radiometric correction only. This software was intended primarily for science use [7]. While some of the XYZ images were used to help guide the MPF rover, it took an hour to correlate a 256x256 image, so this was not done very often. The mosaics were the primary product and were extensively used by scientists and public relations. There was a mosaic seam-correction capability but it was cumbersome and did not work very well. Finally, the programs were written to be specific to Pathfinder. When development began for Mars Polar Lander (MPL), these programs were reworked completely. While the basic algorithms were preserved, they were converted into a reusable, missionindependent design. Interactive mosaic seam-correction was added, and a rudimentary pipeline was developed to manage systematic execution of the programs. For MER, this resuable design proved to be, in fact, reusable. This allowed MlPL to invest development resources in new and improved capabilities rather than reworking the basic functionality yet again [3]. Correlations were improved to 3-4 minutes for a 1024x1024 image, a 250x improvement. Much better seam-correction was implemented, and many new types of products were added. A robust pipeline was developed to glue it all together. 3.2 Software Design Overview
All of the subject RDR-generation application programs are multimission. With the single exception of the IDD reachability program, they contain no mission-specific code whatsoever. All of the mission-specific code is encapsulated in a library known as Planetary Image Geometry (PIG). This C++ class library consists of base classes which provide common interfaces and services, such as camera models, pointing models, coordinate systems, file metadata (label) access, etc. Mission-specific subclasses then implement the functionality that differs among missions. The library has been adapted to 6 different missions as of this writing: MPF, MPL, MER, FlDO development rover, Mars ’01 testbed, and a “generic” mission. Adaptation has ranged from 2 days to 2 months for new missions. Compare this to 3 years to write the original code, and the cost savings are obvious [3]. While actual MER development overall took much longer than 2 months, all except that 2 months was able to be invested in new and improved capabilities. Lest one think that the applications and multimission core are trivial and all the work is in the mission-specific classes, less than 15% of the total code base is mission-specific - and that supports 6 different missions! [3]
4.0 Operational Pipeline The rovers typically generate 50-350 images per day, each. And there are up to 12 products
Montreal. Canada
- Mav 17 - 21 2004
Rnf I I I
-
SpaceOps 2004 Conference created per image. Creation of these products must be automated to comply with the "tactical" (nearterm) timeline of daily operational uplink schedules. To minimize the potential for file bookkeeping errors and to facilitate a swift and accurate delivery system, an autonomous process called a pipeline was designed to couple the EDR and RDR-generation software together (Figure 11). Unix shell scripting was selected as the implementation language for several reasons. It is a user-friendly programming language, providing hooks for easy development of ancillary tools. It is compatible with Sun and Linux platforms. And, it is easy to modify for special cases or to add new capabilities. A single Bourne shell script called "merpipe" was written to launch and automatically manage multiple EDR and RDR batch processes as serial pipelines run in parallel. Individual pipelines can vary their processing parameters based on the metadata provided with the images, such as the instrument and of the type data. At its lowest level, "merpipe" is based on a series of endless loops that query targeted directories serving as input queues for each respective EDR and/or RDR process. These input queues contain symbolic links to the actual files (stored in the
OSS,see below). As a
process finishes, the output file is written, and symbolic links to it are placed in the appropriate downstream processing queues. Rather than relying on a relational database for the organization and indexing of image data, the pipeline utilizes a "smart directory" structure called OSS (Operational Storage Server) created on an NFS filesystem to store the finished products. First used on MPF, this approach eliminates the need for a large-scale relational database effort, and the risk of a single point of failure from such a system. The OSS works by taking advantage of the fact that the data are naturally organized into a 3-tier hierarchy consisting of time, instrument type, and product type. By splitting the data into individual directories for each Martian day (Sol), the data are stored in scaleable, well-defined groups. Within each Sol, the data are further subdivided into directories for each instrument (or camera type). Finally, each instrument directory contains subdirectories for each product type discussed above. The OSS is in use Project-wide, with each subsystem having their own structure of directories under the Sol level. This provides transparency and consistency across the Project, and allows users to find and use data in other teams' areas easily, without needing a complex data access API.
5.0 Users of MlPL Products Creation of all of these products wouldn't be very useful if nobody used them. Fortunately, there are quite a number of users on MER, both operational users and more traditional MlPL customers.
5.1 Operational Users There are four primary users of MlPL products in an operational setting: science planning, rover planners, mobility evaluators, and long-term planners Science planners are members of the science team who meet every day to decide what the rover should do the next day. They primarily use a tool called Science Activity Planner (SAP) [I21 to write detailed observation requests (Figure 12). This tool makes use of most of the MlPL products. Radiometrically-corrected images are used for viewing. Range and surface normal data are used to
define targets for observations. IDD reachability and roughness are used to determine if targets of
Montreal. Canada
- Mav 17 - 21 2004
4 nf I O
-
SpaceOps 2004 Conference interest can be safely reached by the arm. Wedges are used to visualize the terrain. All of these products help the science team come to a consensus on what observations to make, and define those observations. Rover planners (colloquially the rover “drivers”) are the people who actually write the command sequences for the rover. They primarily use a tool called Rover Sequencing and Visualization This makes extensive use of MlPL terrain meshes to see the terrain in Planner (RSVP) [2,6,10]. detail, ensure the rover can be driven safely, and write detailed IDD movements to accomplish the science objectives (Figure 13). Mobility evaluators are responsible for analyzing the returned telemetry to figure out what the rover actually did, compared to what it was supposed to do (e.g. how far did we actually drive), and occasionally make mid-day goho-go decisions. They also monitor the health and safety of the arm and mobility elements. They use SAP and RSVP with all of the MlPL products, as well as other tools such as MIPL’s marsviewer, to visualize and quantify the returned imagery and terrains. Long-term planners determine what the rover is going to do on a several day to several week basis. Their primary MlPL product is the various mosaics, allowing them to find targets of interest and work towards them. All four types of users are critical to MER operations, and make extensive use of MlPL products.
5.2 Other Users Of course, the roots of this software go back to science and public outreach, and these uses still exist. Scientists use SAP extensively as a visualization and data analysis tool, making use of almost all of the product types. Many products are used as inputs into their own software as well. For example, the surface normals and XYZ’s have been used for detailed analysis of the trench walls as dug by the front wheels on both rovers. The operational pipeline is as of this writing being slightly modified to create photometrically corrected cubes of pancam data for science analysis, integrating several programs written by the science community. Public outreach is another major MlPL customer. Many special products (mostly corrected mosaics of various kinds) have been created for press conferences and web releases of images. These special products are created with the same basic tools as described above, with the addition of some interactive steps for seam correction and handling special cases. In addition, all raw images are pushed to the web, and to members of the Museum Alliance
[Ill.Images and a subset of the
products are also pushed out for use by Maestro, which is the public version of SAP (it is SAP, cut down a bit both in code and available data) [8].
6.0 Operational Experiences: Does it Work? So far we have discussed the products being created for operations, and the origin of them in
science programs developed for previous missions. This begs the question: does it work? The answer is an emphatic yes. While there have been a few problems along the way, there has not been anything major. A prime metric is whether an error caused by any given team causes the mission to lose a Sol (Martian day) of activity. While several Sols have been lost (most notably
Montreal. Canada
- Mav 17 - 21 2004
5ofIIl
-
SpaceOps 2004 Conference the Spirit flash memory problem), I’m happy to report that, as of this writing, 2/3 through the primary missions, none have been lost due a MlPL failure. The pipeline works by gluing many separate programs together, as opposed to having one monolithic program doing all the processing. This has turned out to be extraordinarily beneficial. Operations work requires flexibility. Especially when exploring the unknown, unexpected situations and surprises arise frequently. The pipeline design has allowed us to change parameters to individual programs (or in some cases, the programs themselves) quite easily, with very little integration time. On numerous occasions, we have created slightly tweaked versions of the pipeline for special situations, which we run in private directories to create special products. Some of these special products are then injected back into the main pipeline. It would be hard for a monolithic program to be that flexible. The decoupled pipeline design has also allowed us to do tasks not envisioned before launch, such as the photometry cubes. This incorporated processing programs written externally, combined with many of the MlPL processing steps. We have also easily added several new product types to the production pipeline after landing, as the need arose. The pipeline also allows for limited parallel processing of incoming streams. Each subtask is run in a separate process, allowing many to be run at once. Individual subtask processes can be restarted without affecting the rest of the pipeline. However, in hindsight, it would have been nice for some of the most CPU-intensive processes (most notably disparity generation) to be broken down even more, with more than one disparity running at once. Also, the parallelism creates that many more processes to monitor, which can sometimes be a challenge. The inheritance from prior missions has been a great benefit. In addition to the huge cost savings mentioned previously, it provided us with a stable, highly capable base on which to build. However, there are a few drawbacks to this approach. Most notably, the bulk of the legacy code makes consistent error reporting and logging a challenge. Programs written over a many year span by different developers in different languages (many auxillary programs are written in Java) report and handle errors differently. The decoupled nature of the pipeline makes centralized logging even harder, as each process creates its own log. While the pipeline detects most errors and puts files in the appropriate failure queues, it is not always easy to track down what the error actually was. The automation provided by the pipeline allows MlPL to successfully meet its operations timeliness requirements, including the need to fully assemble and label each packetized telemetry data product into an EDR within 60 seconds of that data product‘s receipt, and 2) the generation of all RDR’s for each EDR within 30 minutes of its receipt, including multi-frame products such as terrain meshes and image mosaics. As described above, the OSS file structure is used instead of a database for file management.
While this has worked well, the jury is still out in some ways. The approach has proven to be a very effective and robust method for storing and organizing the data. Because the top tier is repeated for each Sol, users and programs need learn only a single “template” and apply that each day as the
Montreal. Canada
- Mav 17 - 21 2004
R o f 10
-
SpaceOps 2004 Conference mission progresses. The directory structure becomes a self-documenting archive that allows users to easily find data from previous Sols. The use of softlinks allows users to navigate the directory structure more easily. The freedom from a database allows private pipelines to be trivially set up and run. This is often done for special products. However, there are some issues with the use of the OSS by the pipeline. There have been some hardware and performance issues with the file server itself. The directory structure itself is cumbersome. There are over a million(!) directories for about a dozen test and ops OSS trees. While it is easy to access data from other teams without special query tools, finding the right directory can sometimes be a challenge. From the pipeline perspective, files sometimes get “stuck” in processing queues and require manual intervention to continue to process. And monitoring the processing status in all those directories can be quite a challenge.
7.0 Conclusion MlPL has taken processes originally developed for science analysis of lander images and converted them for use in the critical path of MER rover operations. In the process, they have lost none of their original science value. A reusable design freed up considerable resources for extending functionality, while a decoupled processing pipeline allowed for the flexibility and performance required in an operations environment where the unknown is being explored. As to whether the concept worked, the proof is in the pudding (Figure 14). Look at the results in any recent science magazine or your favorite website and judge for yourself.
8.0 References [ I ] D. Alexander, et a/, “Mars Exploration Rover Project Software Interface Specification (SIS) Camera Experiment Data Record (EDR) and Reduced Data Record (RDR) Operations Data Products”, JPL D-22846, (2003). [2] B. Cooper, et a/, “Using RSVP for Analyzing State and Previous Activities for the Mars Exploration Rovers”, SpaceOps 2004,publication pending (Montreal, Canada, 2004). [3] R. G. Deen, “Cost Savings through Multimission Code Reuse for Mars Image Products”, Proceedings of 5th lnternational Symposium on Reducing the Cost of Spacecraft Ground Systems and Operations, 103-A0075 (Pasadena, CA, 2003). [4] R.G. Deen, “Issues with Linearization”, JPL MER Docushare Internal Document #75670.
[5] S.B. Goldberg, M.W. Maimone, and L. Matthies. “Stereo Vision and Rover Navigation Software for Planetary Exploration”, Proceedings of 2002 IEEE Aerospace Conference, Vol. 5, pp. 20252036 (Big Sky, Montana, 2002). [6] F. Hartman, et a/, “lmmersive Visualization for Navigation and Control of the Mars Exploration Rovers”, SpaceOps 2004,publication pending (Montreal, Canada, 2004). [7] S.K. Lavoie, et a/, “Processing and Analysis of the Mars Pathfinder Science Data”, J. Geophys. Res., Vol 104, pp.8831-8852 (April, 1999). [8] Maestro project website: http://mars.telascience.org/home/.
Montreal. Canada
- Mav 17 - 21 2004
7nf II)
-
SpaceOps 2004 Conference [9] J.N. Maki, et al, “The Mars Exploration Rover Engineering Cameras”, J. Geophys. Res. 108(E12), 8071, (2003). [ I O ] S. Maxwell, et a/, “The Design and Architecture of the Rover Sequencing and Visualization
Program (RSVP)”, SpaceOps 2004, publication pending (Montreal, Canada, 2004). [I I]Museum Alliance website: http://muse.jpl.nasa.gov
[I21 J. Norris, M. Vona, M. Powell, “Mars Exploration Rover Operations with the Science Activity Planner”, /€E€ Conference on Robotics and Automation, publication pending (April 2004).
[I 31 VICAR website: http://www-mipl.jpl.nasa.gov/vicar [I41 J. Wright, et a/, “Terrain Modelling for lmmersive Visualization for the Mars Exploration Rovers”, SpaceOps 2004, publication pending (Montreal, Canada, 2004).
[I 51 Y. Yakimovsky and R. Cunningham, “A System for Extracting Three-Dimensional Measurements from a Stereo Pair of TV Cameras”, Computer Graphics and Image Processing, Vol. 7, pp. 195210 (1978).
Figure 1. Original EDR of trench,
Figure 2. The same image,
Figure 3. XYZ image. Red lines
taken by the left front hazcam of
linearized to remove fisheye
show constant X (O.lm interval),
Spirit on Sol 47.
lens distortion.
green show Y (O.lm), and blue show Z (0.02117).
Figure 4. XYZ data converted
Figure 5. Surface normal
Figure 6 . Reachability map,
to range. The contour lines are
image. Colors indicate
showing where different
at 0.5m intervals.
different normals.
instrument modes can be
Montreal. Canada
- Mav 17 - 21 2004
8 of
in
-
SpaceOps 2004 Conference
Figure 7. 180 degrees of the Mission Success Panorama from Spirit, taken from the lander Cylindrical projection.
Figure 8. 180 degrees of the Mission Success Panorama from Opportunity, taken from the lander. Cylindrical projection.
Figure 9. Perspective projection mosaic of
Figure 10. Vertical projection mosaic of
5 Microscopic Imager frames of the Rock
Site 10 from Spirit. Note the rover tracks
Abrasion Tool hole left by Spirit on Sol 60.
avoiding obstacles.
-
SpaceOps 2004 Conference
I
I
+ + Telemetry Data Prod
mtes2edr
mertelemproc
~1
Mini-TES
Rad-correct RDR
Rad RDR
marsuvw
marsrange
I
t
SUMMIT
I
> irsrough
Figure 11. Data-flow diagram for pipeline. Ovals indicate processes; rectangles are product types.
Figure 12. SAP screen shot, showing
Figure 13. RSVP screen shot, showing the
several targets defined.
arm in the trench aiming at targets.
Montreal. Canada
- Mav 17 - 21 2004
10 nf 10