stereo equalizer aided in maintaining the background noise at a level of q- 4 dB over ... ed on the second channel of the TEAC tape recorder for off- line analysis.
Masking patterns in the bullfrog (Rana catesbeiana). II: Physiological effects EdwardG. Freedman, ") MichaelFerragamo, andAndreaMegelaSimmons b) DepartmentofPsychology and GraduateProgramin Neuroscience, BrownUniversity, Providence, Rhode Island 02912
(Received17December1987;acceptedfor publication30 August 1988) Responses of individualeighth-nervefibersin the bullfrog (Rana catesbeiana)were measured to tone burstsat bestfrequencyagainsta backgroundof continuous,broadbandmaskingnoise. Thesedata were usedto calculatecritical maskingratiosto describethe fibers'responses to tonesembeddedin noise.In the frequencyresponserangeof the amphibianpapilla ( 100-1000 Hz), critical ratiosincreasewith tone frequency.Critical ratiosof basilarpapilla fibers( 10002000 Hz) are generallyhigherthan thoseof amphibianpapilla fibers.Critical ratiosare also significantlyrelatedto fiberthresholdsuchthat fiberswith high thresholds,regardlessof their bestfrequencies,havehighercritical ratiosand are thus lessselectiveto signalsembeddedin noise.Critical ratiosbasedon neural responses showa somewhatdifferentfrequencydependenttrend than do criticalratiosbasedon psychophysical data presentedpreviouslyfor this species[A.M. Simmons,J. Acoust. Soc.Am. 83, 1087-1092 (1988a) ]. In addition, these neuralcritical ratiosdo not appearto be level independent,as are psychophysical critical ratios.The data suggestthat frequencyselectivityof hearingin the bullfrogas measured behaviorallyis probablynot mediatedsolelyby spectralfilteringin the auditory periphery. PACS numbers: 43.63.Pd, 43.63.Th, 43.66.Dc
INTRODUCTION
The ability of the auditory systemto increaseits frequencyselectivityand minimizeunwantednoisehasgenerally beenunderstoodas reflectinga processof critical band filtering (e.g., Scharf, 1970). The critical band is a concept basedon psychophysical data that refersto the noisebandwidth arounda pure-tonesignalwhich is effectivein masking that signal.A large critical band indicatesthat the ear sumsthe noisepowerovera widefrequencybandin orderto maskthesignaland,therefore,suggests ratherpoorfrequency resolutionby the auditorysystem.A smallcriticalband, on the other hand, indicatesrather good frequencyresolution in that only a very narrow segmentof the noise surroundingthe signalhasan impacton detectionof the signal. The critical band and a related measure, the critical ra-
tio, havegenerallybeeninterpretedasreflectingthe mechanical responseof the cochlea(Greenwood,1961). In mammals, both the range of frequenciesencodedby a fixed distancealongthe basilarmembraneand the sizeof the criticalbandincreaseexponentiallywith tonefrequency(Greenwood, 1961;Liberman, 1982). This suggeststhat frequency selectivityof hearingis effectivelycreatedperipherallyand might thusbe reflectedin the responsepropertiesof eighthnerve fibers.In severaldifferentvertebratespecies,physiological and psychophysicalestimatesof critical bands or criticalratiosare generallysimilar (Costalupes,1985;Ehret and Moffat, 1984; Evans and Wilson, 1973; Fay and Coombs,1983). In the cat, for example,both measuresincreasesmoothlyand graduallywith tonefrequencyat a rate a)Presentaddress:Section, of NeurobiologyandBehavior,CornellUniversity, Ithaca, NY 14853.
b)Addresscorrespondence to thisauthor.
2081
J. Acoust.Soc.Am.84 (6), December1988
of about3 dB/oct, eventhoughthe absolutevaluesof the two estimatesmight differ (Pickles and Comis, 1976). Central neural eventsmay then sharpenbehavioralselectivity(Ehret and Merzenich, 1985). In addition, codingof signalsin noise by individual auditory nerve fibers is believed to be accomplishedprimarily by a rate (rather than a temporal) code(Costalupes,1985;Fay and Coombs,1983;Young and Barta, 1986).
Someanimals,e.g., parakeets(Dooling and Saunders, 1975;Okanoyaand Dooling, 1987), two speciesof echolocatingbats (Long, 1977; Suthersand Summers,1980), and
two speciesof anuranamphibians(Moss'and Simmons, 1986; Simmons, 1988a) all show behavioral critical ratio functionsthat differ significantlyfrom the typical vertebrate pattern. The greentreefrog'scritical ratio function,for example,is W shaped,with two pointsof maximal behavioral selectivityat frequenciesthat representthe two dominant spectralpeaksin the malegreentreefrog'sadvertisementcall (Moss and Simmons, 1986). The bullfrog's (Rana catesbeiana) critical ratio function is also somewhat dissimilar
from the typicaløvertebrate trend. The low-frequencysegment of this animal's critical ratio function (from about
100-600 Hz) increases with tonefrequencyat a rateof about 4 dB/oct. The high-frequencysegmentof the function
(above1000Hz) alsoincreases withtonefrequency, butat a slopeof about 9 dB/oct. In the frequencyregionof 900 Hz, there is a pronounceddip in the function,indicatinggood frequencyselectivityhere. In those animals for which the critical ratio function
is
dissimilarfrom the typical vertebratefunction,it is not clear what aspect of auditory processing--mechanicalor peripheral filtering, or central sharpening--thedata bestrepresent. Long (1977) interpreted the horseshoebat's unusual
0001-4966/88/122081-11500.80
¸ 1988AcousticalSocietyof America
2081
Redistribution subject to ASA license or copyright; see http://acousticalsociety.org/content/terms. Download to IP: 128.148.252.35 On: Mon, 20 Jun 2016 19:41:07
critical ratio functionas reflectingspecializations for spectral processingalong the basilar membrane.It is unknown whethersuchperipheralspecializations in the auditoryend
organs alsoexistintheotherspecies showing a[ypical criticalratiofunctions.Thisisa particularlyinteresting question to addressin anuransbecauseof the uniquestructureof their inner ear, with its two auditoryorgans.The amphibianpapilla is maximally tuned to frequenciesfrom 100-1000 Hz, and the basilarpapilla is tuned to higher frequenciesin a species-specific range.In the bullfrog,basilarpapilla fibers are maximally tuned to frequenciesfrom about 1000-2000 Hz (Feng et al., 1975). Neither of theseinner ear organs contains a basilar membrane.
Neural
critical
ratios have
beenmeasuredin the responses of individualeighth-nerve fibersin the greentreefrog (Ehret and Capranica, 1980); however,the pattern of changein theseneural responses with frequencyis not parallel in shapeto the pattern of changein behavioralresponses (MossandSimmons,1986).
It is thusunclearwhethercriticalbandfilteringin thisanimal is peripherallymediated. In this article, we report physiologicaldata on the responsesof individual eighth-nervefibersin the bullfrog to toneburstsin backgroundnoise.Maskedthresholdsof individual fibers were used to calculate critical ratios for detect-
ing tonesin noise,whichwerethen comparedwith the psychophysicaldata from this animal. I. METHODS
A. Apparatus
Adult bullfrogs(80-300 g) wereanesthetized with intramuscular injections of sodium pentobarbital (100 mg/kg) prior to surgeryand recording.The animal was wrappedin moistgauzeto aid cutaneousrespiration.The eighthnervewas exposedthrougha ventralincisionin the roof of the mouth.For recording,the animalwasplaced, ventralsideup,onanadjustable platformsecured to a vibration isolatingtable (Newport ResearchCorp.) in a soundattenuatingchamber(IndustrialAcoustics).Stimulusgeneration and recordingequipmentwere locatedoutsidethis chamber.All experiments wereconducted at roomtempera-
couldbe electronicallymixed with the tone bursts,and then to the stereoamplifier. After amplification,the acousticstimuli weredelivered to the animal'stympanum,ipsilateralto the exposednerve, by a BeyerDT48 earphoneenclosedin a custom-builtbrass housing.A symmetricalT-shapedcoupler (50-mm length, 13-mmdiam) wasattachedto the faceof this housing.One
endof the couplercontained a Briieland Kjaer 4134•-in. condensermicrophonefor monitoring the soundpressure levels of the stimuli. The other end of the T was fit with a
tapered rubber tube, which was placed closeto, but not
touching,the animal'stympanum.The rubbertub•ewas sealedaround the edgesof the tympanum with silicone greaseto form a closedacousticsystem.Care was taken to preventany directmechanicalstimulationof the tympanum throughthe rubbertube. The acousticstimuli werecalibratedat the beginningof
eachexperimental session usinga BriielandKjaer4134•-in. condenser microphone,a Briiel and Kjaer 2209 soundlevel meter, and a General Radio wave analyzer (10-Hz band-' width for the tones, 50-Hz bandwidth for the noise). The
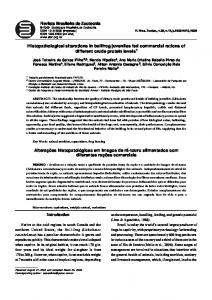
stereoequalizeraided in maintainingthe backgroundnoise
at a levelof q- 4 dB overthe frequencyrange100-3000Hz (seeFig. 1). Stimulusamplitudespresentedto the animals werecorrectedaccordingto thesecalibrations. Sound-pressurelevelsof the tonesareexpressed in dB SPL re:20/tPa, and the noiselevelsare specifiedby their spectrumlevels (dB per 1-Hz band). Spikeactivity from singleauditory-nervefiberswas re-
cordedwithglassmicropipettes (30- to 60-mftimpedance) filled with 3M KC1. The electrodes were advanced into the
posteriorbranch of the eighth nerve with a remote-controlled hydraulic microdrive (Kopf 607). Neural activity wasamplified,firstby a WPI DAM 80 ac differentialamplifier (gain of 1000, bandpassfiltered at 10 Hz-3 kHz) and then by a Rockland 442 filter (gain of 20 dB, filteredat 300 Hz-3 kHz). The responses weredisplayed(Tektronix 922R oscilloscope), passedthroughan audiomonitor,andrecorded on the secondchannelof the TEAC taperecorderfor offlineanalysis.The third channelof the taperecorderwasused for notesand protocoldocumentation.
ture (20 øC).
Tonebursts( 100-2000Hz) weregenerated by Wavetek model 182functiongenerators.Their rise/fall times (5 ms)
weresetbya computer-operated (IBM PC/XT) Coulbourn gate (S84-04). The durationsof the tones(300 ms) andtheir
49
• 46
repetitionrate (l/s) were also controlledby computer. Stimulusamplitudeswere controlledby computerand a
43
40
Coulbourn electronicattenuator (S85-08). The soundswere transmitted to the first channel of a Coulbourn mixer/am-
plifier (S84-24) and to one channelof a Harmon/Karden PM 645 stereoamplifier.The stimuli werealsorecordedon
the firstchannelof a TEAC four-channeltaperecorder. ' Backgroundmaskingnoisewas generatedby a Coulbournnoisegenerator(S81-02),bandpass filtered(KrohnHite 3550filter,20 Hz-10 kHz), andpassedthrougha Realistic stereo equalizer. After being attenuated (HewlettPackard 350D manual attenuator), the noisewas sent to the
secondchannelof the Coulbournmixer/amplifier,whereit 2082
J. Acoust. Soc. Am., Vol. 84, No. 6, December 1988
•
37 34 I
0
0.5
I
I
I
I
1.0
1 5
2.0
2 5
3 0
frequency (kHz)
FIG.1.Spectrum ofthemasking noise. Thiswasmeasured withaBriiel and Kjaer4!34 «-in.microphone placedina T-shaped couplerclosetothefrog's tympanum,a Briiel and Kjaer 2209 soundlevelmeter,and an IBM PC/AT computer.The noisewasdigitallysampled(samplingrateof 20 kHz) with an R?C Electronicsinterfaceboardand the spectrumwascomputedwith ILS programsfrom SignalTechnology,Inc.
Freedmaneta/.: Maskingin bullfrogauditorynervefibers
2082
Redistribution subject to ASA license or copyright; see http://acousticalsociety.org/content/terms. Download to IP: 128.148.252.35 On: Mon, 20 Jun 2016 19:41:07
B. Procedure
X--•--•COS ai, y=l•sinai,
An FM sweep(50 Hz-3 kHz, presented at a levelof 70 dB SPL) was usedas a searchstimulus.Once an auditory nerve fiber was isolated,its best frequency (BF) to tone bursts,thresholdat BF, sharpness of tuning at 10 dB above threshold(Q •odB), and thresholdto noiseweredetermined. Thresholdwasestimatedasthejust audible(audio monitor) and visible(oscilloscope)increasein spikerate over sponta-
neous activity. Generally, anuran auditory-nerve fibers exhibit little or no spontaneousactivity, making estimatesof
increasesabove spontaneous rate fairly straightforward. Real-time spikecounts(Global Specialities5001 universal timer/counter;countingtime of 300 ms) werealsomadeto aid in thresholddeterminations for thosefewfiberswith appreciablespontaneous activity.We useda criterionof at least 1 spikeabovespontaneous rate for 50% of stimuluspresentationsas a measureof threshold.A standardprotocolwas followedin measuringthe fiber'sresponseto maskingnoise. First, a tone at BF and thresholdwas presentedin the absenceof maskingnoise.Then, continuousbackgroundnoise at the fiber'snoisethresholdwasadded,and responses to the thresholdleveltonewereagainrecorded.The noiselevelwas then increasedin 2-dB stepsuntil the responses to the tone were masked.At least20 repetitionsof the tone were presentedat eachlevel of the backgroundnoise.A brief (60 s) periodof no stimulationfollowedeveryincrementin noise level.In somecases,the fibercouldbe "held" longenoughto repeat the experimentwith the tone set at BF and 10 dB aboveitsthreshold.In otherexperiments,maskingwasmeasuredto descendingrather than ascendinglevelsof backgroundnoiseor maskingwasfirstmeasuredwhenthe tone was at 10 dB above threshold.
An IBM PC/XT computerwith a R/C Electronicsdata acquisitionboardand softwarewasusedto calculatespike counts,peristimulus-time (PST) histograms andperiodhistogramsin response to thetoneburstsat eachlevelof backgroundnoise.The dataweresampledat a rateof 20 kHz (50/•s bin width). Maskedthresholdwasdefinedasthe pointat which the number of spikesin the 300-ms-longtone burst (toneplusnoise)waswithin 10% of thenumberof spikesin
(2)
wherex andy areCartesiancoordinates of themeanvector m, n is thenumberof spikes,andai is the phaseat whichthe ith spikeoccurs.Let R and• bethe polarcoordinates of the mean vector-vector strength (synchronizationcoefficient) and meanangle,respectively.Then,
R = x/(x2 + y2) and
cos• = x/R,
sin • = y/R.
(3)
The RayleighTest (Batschelet,1965) wasusedto testthe significanceof the synchronizationcoefficients. II. RESULTS
Data arepresented from90 eighth-nerve fibersrecorded from 12 differentfrogs.Characteristics of thesefibeksare shownin Figs.2 and3. Figure2 (a) showstonethresholds in quiet plottedagainsteachfiber'sBF, and Fig. 2(b) shows noisethresholdplottedagainstBF. In general,thesampleof fiberspresumablyoriginatingfrom the basilar papilla had
higherthresholds to tonebursts thanthefiberswithlower BFs [correlation between BF and tone threshold --0.55,
t(88) = 6.2, p < 0.001). Thresholdsto noiseranged from spectrumlevels of about --20 dB to d- 30 dB SPL/Hz. Fiberswith higherBFsalsotendedto havehigherthresholds to noise[r= 0.31, t(88) = 3.1,p
ß
ß ii
masked threshold:
ßß
ß
2O
essaryto mask the tone burst from the tone level at the
CR(in dB)= T,, -- Ns•,
.5
BEST FREQUENCY(kHz)
was chosen to be consistent with the criterion used in beha-
iii
ß ßß
lO
ß
ß
ßß I I
o m
ß
ß
..
(1)
ß
ß ß
o
ß
v
whereTp,is thelevelof thetoneburst,andNs•is thespec-
C3 -10 O
trum levelof the maskingnoise(Scharf, 1970). In order to calculatethe degreeto which a givenfiber's response wassynchronized(phaselocked)to the waveform of the stimulus,eachspikewasdistributedaroundthe perimeterof a unit circleaccordingto thephaseangleof thestimulus at which it occurred.The followingequations(Batschelet, 1965) were used to calculate the synchronization
FIG. 2. (a) Tone BF (x axis) plotted againsttone absolutethreshold(y axis) for the sampleof fibersfrom whichwe recorded(b) Tone BF plotted
coefficient:
againstnoiseabsolute threshold.
2083
J. Acoust. Soc. Am., Vol. 84, No, 6, December 1988
• •-20 i
i
i
i
i
.3
.5
I
2
3
BEST FREQUENCY (kHz)
Freedman eta/.' Masking in bullfrogauditorynerve fibers
2083
Redistribution subject to ASA license or copyright; see http://acousticalsociety.org/content/terms. Download to IP: 128.148.252.35 On: Mon, 20 Jun 2016 19:41:07
300
•.ooo
Hz
700
0
.900
Hz
4.5
.800
10
.•00
'
1.1
.5OO
FIG. 3. (a) Synchronizationcoeffi.300
cients
200
threshold,plotted againsttone BF. The solidline representsthe best-fitting linear regressionthroughthese data points. There is a significant negative correlation between synchronizationand BF. (b) Synchro-
.!O0