Math Anxiety and Problem-Solving Strategies for Early Middle School Math Performance Nkechi Orabuchi and Chia Jung Yeh Texas Woman's University United States
[email protected] [email protected] Chih Hung Chung University of North Texas United States
[email protected] Lin Moore Texas Woman's University United States
[email protected]
Abstract: The purpose of this study is to explore math anxiety and problem solving strategies using an experimental study to compare early middle school students’ math performance in two classrooms with and without a two week intervention using the Brace and Flow Map problem solving strategy. An additional goal of the study is to evaluate the two math anxiety assessments to determine which instrument better reflects early middle school students’ math anxiety. The results revealed that the gain scores of students’ math performances between the two groups did not yield significant differences; however, the mean of the gain scores in the treatment group accepting the problem solving strategy intervention was higher than the control group. Based on statistical results, survey A regarding math anxiety displayed higher reliability and consistency, but survey B was preferred from the students’ perspective. Research and educators can further examine the gap between statistical analysis and students’ view of their math anxiety when they choose a problem solving instrument. Introduction In public schools today many students are not doing well in either math or science, particularly in math (Haycock, 2001). Without gaining the proper math knowledge and skills, these students will not be adequately functional or position themselves to pursue a career in science and engineering. In this global economy, technical skills become vital as technology continues to develop (Greenwood, M. R.C. & North K.K., 1999). Therefore, it is important to understand why students struggle in math and the problem-solving strategies they use. In order to achieve equity, minority students must perform well in math so that they can engage in the competitive world in lucrative careers that are available in engineering and science. Knowledge of math is critical for a society to
- 4408 -
continue to grow and develop, especially in the area of research and development (Gutstein, 2007). Although math is very important to learn and apply, many students struggle in mathematics and compound the problem by creating math anxiety (Batton, 2010). There has been math anxiety research conducted, but its primary focus has been on high school students; however, elementary and middle school students also struggle with math anxiety as well (Newstead, 1998). The transition from elementary to middle school oftentimes creates a major anxiety of its own. “Mathematics anxiety is a feeling of tension and anxiety that interferes with the ‘manipulation of mathematical’ problems in varied situations” (Kahtoon & Mahmood, 2010, p. 75). Anxiety can affect student performance in the classroom. Therefore, social emotional perspectives and conditions also impact math academic performance (Meadows, 2006). Often, children develop negative feelings and higher levels of anxiety toward math and the math anxiety they develop creates a negative relationship with math and negatively impacts academic performance (Newstead, 1998). The purpose of the study was to investigate whether the curriculum and the theory-based strategy, the Brace and Flow maps, could be utilized in a early middle school classroom to increase students’ ability to problem solve in math in conjunction with determining which math anxiety scales would better reflect students’ math anxiety and be suitable for early middle school students. The following research questions were examined in order to understand and address the problems associated with students struggling in math. Research Questions a. Are there significant differences between the control and experimental group on their math performance? b. Does the Math anxiety scales reflect students’ Math anxiety for their math courses? Literature Review In this section, two major topics, including math anxiety and problem-solving strategies, will be addressed and discussed to elucidate the research topics. Math Anxiety Tobias (1993) proposed a definition of math anxiety. Math anxiety is one person’s feelings of tension and anxiety interfering with operating numbers and resolving mathematical problems in various life and academic situations. However, there are various forms of math anxiety. For example, Ma (1999) stated that children with math anxiety either dislike math, worry about math, and/or fear math which are attitudinal, cognitive, and emotional elements respectively. Ma (1999) conducted a meta-analysis of 26 studies with 18,279 students, grades 4 to 12. Each study sample averaged 703 students. The largest study had a sample size of 4,091 students and the smallest study had a sample size of 28 students. The Mathematics Anxiety Rating Scale (MARS) was the scale used to measure math anxiety in several of the studies within the meta-analysis. There was a statistically significant relationship between math anxiety and math performance. Ma (1999) also reported that children from grade 4 and above all had math anxiety. Several studies also revealed that math anxiety and math performance had a negative relationship (Galla & Wood, 2012; Lee, 2009). The major elements of the affective domain were emotion, belief, and attitudes (Ashcraft & Moore, 2009). The emotional element is the trigger for math anxiety because it involves fear, panic, anxiety, and embarrassment which the students’ showed in situations involving math (Ma, 1999). Students’ fear of math can be reduced or even eliminated with effective tools and strategies. Ma (1999) concluded that math anxiety occurred during early educational experiences. However, there is no instrument to study math anxiety at the grade levels prior to grade 4. Krinzinger, Kaufmann, & Willmes (2009) also suggested that future research needed standardized and appropriate instruments to measure math anxiety through early primary school years. Therefore, this study attempted to explore the appropriate instruments for measuring math anxiety for early middle school students. Problem Solving Batton (2010) conducted an experimental study to investigate whether cooperative group strategies would impact the levels of math anxiety in a 5th grade math classroom, and whether using the cooperative group strategies would reduce math anxiety for different gendered students. The results showed that the math anxiety scores in the
- 4409 -
treatment group were less than the anxiety scores in the control group. Additionally, females in the treatment group had lower anxiety scores compared to the females in the control group. However, male students in the treatment group showed no change in math anxiety levels when compared to males in the control group. One conclusion that could be drawn from this study was that cooperative grouping, particularly for females, might positively impact student attitudes and overall performances. Batton (2010) also indicated that math anxiety was not the equivalent of test anxiety since math anxiety originated from many different areas. To further discover what issues and considerations create math anxiety, future researchers could utilize different math anxiety scales to reveal what contents and areas cause student math anxiety to increase. In addition, various math learning strategies have been conducted in different studies to determine and promote student math performances (Batton, 2010; Hall, 2009). Hall (2009) conducted an experimental study which involved 170 sixth and seventh grade students in Middle Tennessee to determine if students'gender, grade level, and level of creativity had an impact on their use of mathematical problem-solving strategies. After a six week intervention and data collection, the results revealed that those students who received previous problem solving instructions had both higher numbers of solutions and higher levels of complexity in the sixth and seventh grades. There was a difference in the number of methods by gender at the sixth grade level. However, the results revealed that there was no significant difference in the number or complexity of solution methods by grade level. Villa (2008) conducted a study to investigate the correlations between reading skills and mathematics performance, specifically on word problem-solving. Fifty-eight students from the sixth through eleventh grades participated in this study. The results revealed that reading skills were correlated to mathematics; however, the relationship between the two was not strong. The researcher stated that even though students who had a high reading score might read and understand word problems better, they might have problems in decoding and setting the problems. Therefore, the results indicated that another set of strategies might be necessary for student success in mathematics problem-solving rather than reading skills only. Mathematics problem solving is under Constructivist paradigm tending to become a mainstream in current national public policy (Shea, 2009; Hyerle, Curtis, & Alper, 2004). Thinking Map is visual metacognitive thinking tool for lifelong learning as a great deal of problem solving strategies in all interdisciplinary, especially for some difficult concepts (Hyerle et al., 2004). Through using this tool, students can get an assistant on scaffold their thinking processes. The Brace Map and The Flow Map are two of eight fundamental thinking strategies which using by different visual map to reorganize and construct the knowledge and information. The Brace Map can be used to explore the relationship between the part and whole or part and subpart relationships (Hyerle et al., 2004). The essential key for learning mathematics is symbolism and logic and students can transform the information from the application problem toward to the language students can be able to process (Md Kamaruddin & Md Amin, 2012). The Brace Map provides the visual map for students to make the list on some unfamiliar terms in the application questions and further analyze the facts on what have been provided and what the relationship between these facts and information. The Flow Map offers students the framework for seeing sequences, order and steps for their problem solving procedure (Hyerle et al., 2004). Students can scaffold and construct their thinking process step by step to solve the math problems and to transform symbolic mathematic language toward concrete language for data processes. Methodology A pilot experimental quantitative study was used to investigate whether the Brace and Flow map could be utilized in the early middle school classroom to increase students’ problem-solving ability in mathematics in conjunction with determining which math anxiety scales would better reflect students’ math anxiety levels and be suitable for early middle school students. This was an experimental design that used a convenience sample. One class was randomly assigned as a treatment group; the other class was assigned as control group. The sample was used from one of the researchers’ places of employment, a middle school (grades 6 through 8). This study utilized three statistical methods, including t-test, frequency, and reliability in SPSS. The dependent variable was math performance, the continuous score of math performance from the math performance exam in the school. Population
- 4410 -
The population was early middle school students in the U.S. The ages of students were from 11 to 12 years old. The official K through 12 curriculum and standards used for the district and the state of Texas is the Texas Essential Knowledge and Skills or TEKS. The early middle school math specifically follows the early middle school math TEKS guidelines. Students have been taking the Texas Assessment of Knowledge and Skills (TAKS) test, but this summative assessment has recently changed to the State of Texas Assessments of Academic Readiness (STAAR). Sample The sample included 26 participants (12 female and 14 male), with 10 in the treatment group and 16 in the control group. These students attend an intercity middle school, serving economically disadvantaged and at-risk students. The sample included 15 Hispanics, seven African American/Blacks, three Caucasians, and one Asian student. Procedures The students took Survey A and Survey B in one 45-minute class period regarding their math anxiety. Students had the whole class period to complete the survey. Some of the students used the whole time and others finished prior to the end of the class. The students also had open-ended questions at the bottom of each survey. The researchers used the Brace and Flow map strategy as the intervention for the treatment group. The following day, both groups began with a discussion on the strategies they use to solve math word problems. A list was constructed with all the strategies they use, such as songs, rhyming, underlining and circling facts and/or questions, crossing out extra information, UPSCheck (understand, plan, solve, check) which was a 5th grade strategy learned, and others. After the discussion, the treatment group was then introduced to the Brace and Flow map. The Brace and Flow map is used to break down word problems to a simpler format to solve a problem. The Brace map is for the facts and questions within the word problem while the Flow map is a step-by-step mathematical and written language to explain the process to solve a problem. The control group was allowed to use any of the strategies they provided on their set of math problems on fractions and ratios/proportions. All the participants were given a pre-test prior to the math tasks. Throughout the math tasks, students worked in collaborative groups and individually at times. After two weeks of intervention, the students took the post-test with the same questions in a different order. During this study, one researcher taught, while the other observed and recorded their observations. The researchers then coded the surveys, pretest, and post-test by giving each student a number and entering the data into SPSS to run the statistics. Instruments 1.
Math assessment performance The math exam focused on the concepts of decimal, fractions, and percepts equivalencies. Eight questions were comprised in the pre and post-test to evaluate students’ math performances. Moreover, the each question had same value, and total score was 100. 2. Mathematics Anxiety Scale for Children (MASC) The Mathematics Anxiety Scale for Children (MASC) is an instrument developed by Henry and Chiu (1990) to measure student levels of math anxiety precisely for students in grades four through eight (Batton, 2010). The instrument utilizes a 4-point Likert scale and has 22 questions. MASC is numbered with a scale from 1 to 4 where 1 is “not nervous”; 2 is “a little bit nervous”, 3 is “very nervous”, and four is “very, very, nervous”. Henry and Chiu (1990) developed the instrument with a sample of 562 students in grades four to eight, including 270 boys and 292 girls. Henry and Chiu (1990) reported that “internal consistency reliability for the MASC was estimated by computing alpha coefficients for each grade and for the total group. These coefficients ranged from .90 to .93 with a median of .92” (p. 175). Batton (2010) utilized this instrument to explore whether using cooperative groups in the 5th grade math classroom could reduce math anxiety evaluation in 5th grade students. Batton (2010) also introduced another study by Beasley, Long, and Natali in 2001 utilizing the MASC to test for validity of a study sample of 278 middle-class sixth-graders. The result discovered that the consistency as measured by Cronbach’s alpha was .924. 3. Mathematics Anxiety Scale –Revised (MAS-R)
- 4411 -
The second mathematics anxiety scale is Mathematics Anxiety Scale –Revised (MAS-R) developed by Bai (2010). This revised instrument was created by a team led by Bai at the University of Central Florida (Cox, 2011). This math anxiety instrument uses a 5-point Likert scale which has 14 items from “not true” (1), slightly true, moderately true, mostly true to “very true” (5). This scale contains a positive and negative two dimensional subscales which are determined by factor analysis. Each subscale is made up of six items. This instrument was validated with two independent samples consisting of 647 secondary school students. Construct validity was strong and recognized based on literature reviews and the judgment of experts. Bai (2010) reported that the internal consistency of the instrument was .85, test-retest reliability was .71, interfactor correlation .26, p < .001, and positive discrimination power pointed out that MAS-R was a reliable and valid apparatus for measuring mathematics anxiety. Bai (2010) further recommended that this tool might be a beneficial instrument for classroom teachers and other scholars to detect and determine students who might be at risk of reducing math performance due to anxiety. Results Math assessments A paired-samples t-test was conducted to compare the differences between the math assessment scores of the pre-tests and post-tests in each group. There was a significant difference in the pre-test and post-test math assessment scores in the treatment group for the pre-test (M= 53.5, SD= 28.54) and post-test (M= 68.75, SD= 23.28) conditions; t(15)= -2.521, p< .05. The Cohen’s d effect size was .59 (moderate effect). According to Cohen (1992), the effect size .51-1.00 would be a moderate effect. There also was a significant difference in the pre-test and posttest math assessment scores in the control group for the pre-test (M= 31.40, SD= 19.16) and post-test (M= 41.80, SD= 23.88) conditions; t(9)= -2.70, p < .05. The Cohen’s d effect size was .48 (modest effect). Both control and treatment groups had improved after two weeks of the intervention, but in order to explore which group had improved more, this study further conducted independent samples t-tests to compare the gain scores between the two groups. An independent-samples t-test was conducted to compare the gain scores of math performance in their math assessment between the treatment group which receiving the Brace and Flow Map strategy Intervention and the control group which was not using the Brace and Flow Map strategy. There was no significant difference in their gain scores for the treatment group (M= 15.25, SD= 24.19) and the control group (M= 10.40, SD= 12.18) conditions; t (24) = .68, p = .51 Table 1 Group Statistics Progress
Groups treatment control
N 16 10
Mean 15.2500 10.4000
Std. Deviation 24.19229 12.18560
Std. Error Mean 6.04807 3.85343
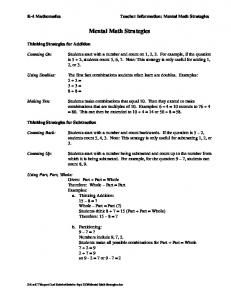
These results revealed that both groups had improved their math assessment performances after two weeks of the intervention (treatment group taught the Brace and Flow Map strategy; control group had regular math course). Even though there was not a significant difference on their gain scores between treatment and control groups, the gain score mean of the treatment group was much higher than the control group. The possible reason for no significance on their gain scores between the two groups might be the time limitation. Students might not have had a sufficient amount of time becoming familiar with the Brace and Flow Map strategy in the treatment group to show their success on their exams during the first two weeks of the intervention. However, figure 1 indicated that the students’ learning and improvement curve between their pre-test and post-test exams in both groups were positive. The improvement rate between their pre-test and post-test were almost parallel even though they were randomly assigned into the two courses. After two weeks of the intervention on the treatment group, they improved their math assessment scores. The control group also improved their math assessment scores after the two week regular math course.
- 4412 -
Figure 1. Learning Curves Math Anxiety Scales Both MASC and MAS-R were utilized in this study to determine a suitable math anxiety instrument suitable for sixth grade students for further research. The first math anxiety instrument MASC was named survey A in this study; the second math anxiety scale MAS-R was named survey B. In order to determine which math anxiety survey was suitable for future research, this study revealed two perspectives, including students’ judgment or perceptions, as well as the statistical results of the two instruments. In reference to students’ perceptions, the researchers found that the majority of students preferred survey B. Survey A includes 22 questions and survey B has 14 questions. This study utilized two math anxiety instruments to evaluate in order to find a suitable tool for future research. Table 2 showed the results about the responses of frequency from survey A and survey B. Table 2 Preferences for math anxiety scale Survey Survey A Survey B Both
f 10 15 1
% 38.5 % 57.7 % 3.8 %
Figure 2. Frequency chart. Note: 1 means survey A; B mean survey B Looking deeper at the frequency of each question in survey A, the results revealed that more students showed higher nervousness on questions 2, 10, 14, 16, 17, 18, 19, 20, 21 and 22. To analyze these questions, researchers categorized these higher frequency questions into two major themes, including the math context and the exam or homework. In the math context, the results revealed students are afraid of interpreting graphs or charts,
- 4413 -
calculating the costs or spending, understanding the mathematical statements, and doing a long division problem. Regarding exams or homework, most students felt nervous in taking math tests, quizzes, preparing for a math test and waiting for the test results. Based on these analyses, the study would suggest that future researchers and classroom teachers place an emphasis on problem-solving strategies on the areas students expressed the most concern about discussed above. In survey B, the results did not reveal any obvious high frequency since it had both positive and negative items toward math anxiety. Therefore, this instrument analysis only presents the results of survey A. Statistical Results from the Two Math Anxiety Instruments Survey A described more daily tasks and integration about Math content in their Math classroom. The questions in survey B tended to explore on student’s feelings about Math. Hence, Students reported more preferences in survey B comparing to survey A. A reliability statistics test was conducted to evaluate which survey had higher reliability by looking at Cronbach’s Alpha. This study utilized a sample of 26 sixth-grade students. The results revealed that the consistency as measured by Cronbach’s alpha was .88 on survey A. The consistency of negative items as measured by Cronbach’s alpha was .57 on survey B. Moreover, the consistency of positive items as measured by Cronbach’s alpha was .84 on survey B. Therefore, survey A had a higher reliability. Although student indicated more preferences on survey B, survey B had lower reliability. Based on the statistical report, this study would suggest survey A as the suitable instrument in this study. Limitations This was a pilot study conducted to gather information on the effects of the use of the Brace and Flow map as well as students math anxiety. This study will continue to explore early middle school student’s problem-solving strategy towards math performance. There were limitations, such as a small sample and short amount of time of implementing the intervention. Due to the limitations, we adopted a convenient sample from one of researchers’ classrooms. In addition, the two groups were not on the same level; the treatment group began at a higher academic performance level although both groups were randomly assigned. At the same time, all the participants were students who had difficulty in math, language, or both, so they take two math classrooms. Future research should be conducted in this area and include a larger sample and more time for the tasks. Future studies should also focus on the problem-solving strategies of minority students, specifically Hispanic and African American students, to understand why there is such a large achievement gap between them and other race/ethnic groups. Conclusions Even though there was not a significant difference in the gain scores between the treatment and control groups, the mean of the gain scores in the treatment group received during the two weeks intervention was higher than the control group which did not receive the Brace and Flow Map strategy intervention. The results revealed that the math assessment scores in both groups had improved after two weeks. Additionally, in the two math anxiety scales, the results revealed that most of students preferred survey B, but survey B could not reveal more useful information based on content analysis and statistical results compared to survey A. Based on the results, this study would suggest that future research choose survey A as a primary math anxiety scale to determine early middle school students’ math barriers and feelings. Even though the math assessment performance on the treatment group who received the Brace and Flow Map strategy did not reveal significant differences compared to the control group, the Brace and Flow Map strategy could be applied to assist students in problem-solving as well as their thinking process. This study suggests that future research which utilizes a similar experimental study should have at least two months of the Brace and Flow Map strategy intervention in order to help students become familiar with this strategy. References
- 4414 -
Ashcraft, M. H., & Moore, a. M. (2009). Mathematics anxiety and the affective drop in performance. Journal of Psychoeducational Assessment, 27(3), 197–205. doi:10.1177/0734282908330580 Bai, H. (2010). Cross-validating a bidimensional mathematics anxiety scale. Assessment, 1, 178-182. Batton, M. (2010). The effect of cooperative groups on math anxiety. (Doctoral dissertation). Retrieved from ProQuest Digital Dissertations. (AAT 3427021) Galla, B. M., & Wood, J. J. (2012). Emotional self-efficacy moderates anxiety-related impairments in math performance in elementary school-age youth. Personality and Individual Differences, 52(2), 118–122. doi:10.1016/j.paid.2011.09.012 Chiu, L., & Henry, L. L. (1990). Development and validation of the mathematics anxiety scale for children. Measurement and Evaluation In Counseling And Development, 23(3), 121-27. Cohen, J (1992). "A power primer". Psychological Bulletin 112 (1): 155–159. doi:10.1037/0033-2909.112.1.155 Greenwood, M. R.C. & North K.K. (1999). Science through the looking glass: Winning the battles but losing the war? Science, 286(5447), 2072 – 2078. doi: 10.1126/science.286.5447.2072 Gutstein, E. (2007. Connecting community, critical, and classical knowledge in teaching mathematics for social justice. The Montana Mathematics Enthusiast, ISSN 1551-3440, Monograph 1, 109-118 Hall, L. (2009). Problem solving and creativity: A gender and grade level comparison. (Doctoral dissertation). Retrieved from ProQuest Digital Dissertations. (AAT 3356163). Haycock, K. (2001). Helping all students achieve: Closing the achievement gap. Educational Leadership, 58(6), 115. Henry, L. L., & Chiu, L.H. (1990). Development and validation of the mathematics anxiety scale for children. Measurement and Evaluation in Counseling and Development, 23, 121- 127. Hyerle, D., Curtis, S., & Alper, L. (2004). Student successes with thinking maps: School-based research, results, and models for achievement using visual tools. Thousand Oaks, CA US: Corwin Press. Khatoon, T., & Mahmood, S. (2010). Mathematics anxiety among secondary school students in India and its relationship to achievement in mathematics. European Journal of Social Sciences, 16(1), 75-86. Krinzinger, H., Kaufmann, L., & Willmes, K. (2009). Math anxiety and math ability in early primary school years. Journal of psychoeducational assessment, 27(3), 206–225. doi:10.1177/0734282908330583 Lee, J. (2009). Universals and specifics of math self-concept, math self-efficacy, and math anxiety across 41 PISA 2003 participating countries. Learning and Individual Differences, 19(3), 355–365. doi:10.1016/j.lindif.2008.10.009 Ma, X. (1999). A meta-analysis of the relationship between anxiety toward mathematics and achievement in mathematics. Journal for Research in Mathematics Education, 30(5), 520-540. Meadows, S. (2006). The child as thinker (2nd ed.). NY: Routledge. Md Kamaruddin, N., & Md Amin, Z. (2012). Dilemma in teaching mathematics. US-China Education Review B, 2(2b), 145-149. Newstead, K. (1998). Aspects of children’s mathematics anxiety. Educational Studies in Mathematics, 36(1), 53-71.
- 4415 -
Shea, C. P. (2009). Discourse + technology/collaborative learning = fraction success. Retrieved from ProQuest Digital Dissertations. (AAT 3360614). Tobias, S. (1987). Succeed with math: Every student' s guide to conquering math anxiety. New York: College Board Publications. Villa, S. M. (2008). Correlation between reading skills and mathematics performance: An analysis of Stanford achievement test scores from grades 6 to 11. (Master’s thesis). Retrieved from ProQuest Dissertations and Theses database. (AAT 1453851)
- 4416 -