IEEE TRANSACTIONS ON INFORMATION FORENSICS AND SECURITY, VOL. 4, NO. 3, SEPTEMBER 2009
519
Mathematical Model for Low-Rate DoS Attacks Against Application Servers Gabriel Maciá-Fernández, Jesús E. Díaz-Verdejo, Member, IEEE, and Pedro García-Teodoro
Abstract—In recent years, variants of denial of service (DoS) attacks that use low-rate traffic have been proposed, including the Shrew attack, reduction of quality attacks, and low-rate DoS attacks against application servers (LoRDAS). All of these are flooding attacks that take advantage of vulnerability in the victims for reducing the rate of the traffic. Although their implications and impact have been comprehensively studied, mainly by means of simulation, there is a need for mathematical models by which the behaviour of these sometimes complex processes can be described. In this paper, we propose a mathematical model for the LoRDAS attack. This model allows us to evaluate its performance by relating it to the configuration parameters of the attack and the dynamics of network and victim. The model is validated by comparing the performance values given against those obtained from a simulated environment. In addition, some applicability issues for the model are contributed, together with interpretation guidelines to the model’s behaviour. Finally, experience of the model enables us to make some recommendations for the challenging task of building defense techniques against this attack. Index Terms—Denial of service (DoS) attacks, low-rate traffic, modeling techniques, network-level security and protection.
I. INTRODUCTION
A
FTER many years of research and work in the field of network communications, denial of service (DoS) attacks remain an unsolved problem. These are attacks aimed at either making a system unavailable or simply reducing the quality of the service provided. Although there are many strategies for launching such attacks [1], most can be classified as either vulnerability or flooding [2], [3]. Vulnerability attacks are those intended to send a specially crafted message to the victim. This message exploits a certain vulnerability and is able to make the victim crash or hang. Flooding attacks, on the other hand, try to send to the victim a traffic rate that exhausts one or more resources, such as links bandwidth, CPU resources, memory, or connections buffers. In this kind of attack, the messages may be identical to those that legitimately use the service. Obviously, some DoS attacks can be classified in both categories, as they exploit a vulnerability at the same time as they send a flooding of traffic against the victim. Flooding attacks have traditionally been carried out by means of recruiting enough resources to send a rate of traffic to the
Manuscript received July 16, 2008; revised April 17, 2009. First published June 10, 2009; current version published August 14, 2009. This work was supported in part by the Spanish Government through MEC (Project TSI2005-08145-C02-02, FEDER funds 70%). The associate editor coordinating the review of this manuscript and approving it for publication was Prof. Klara Nahrstedt. The authors are with the Department of Signal Theory, Telematics and Communications, CITIC-UGR, University of Granada, 18071 Granada, Spain (e-mail:
[email protected];
[email protected];
[email protected]). Digital Object Identifier 10.1109/TIFS.2009.2024719
victim that is high enough to exceed its capabilities. However, some variants of these attacks that have appeared recently are carried out by using low-rate traffic. One of the first to use this approach was the Shrew attack against the TCP protocol [4], followed by others such as reduction of quality attacks against end systems [5] or load balancers [6], and the low-rate DoS attack against application servers (LoRDAS) [7], [8]. These attacks have been evaluated [9], and various defense techniques have been proposed [10]–[14]. Due to the complexity involved in modeling these attack processes, there have been few proposals for analytical models by which their performance can be evaluated. The traditional tool used to assess attack techniques and defenses has been that of simulation. This fact represents a drawback in the study of DoS attacks, as their behavior must be clarified for a wide variety of scenarios, and even by means of simulation it would be extremely expensive to evaluate all of them. This problem has been discussed recently by some authors, e.g., [15], who proposed using mathematical models to study DoS attacks. In this paper, we are interested in studying the LoRDAS attack [7], [8] , which targets generic application servers in the Internet. This attack is an evolution of the low-rate DoS attack against iterative servers [16], and extends its capabilities to concurrent systems. In essence, the attack takes advantage of the capacity to forecast the instants at which the responses to incoming requests for a given service occur. This will allow us to schedule an intelligent transmission in such a way that the target server becomes busy the most time in attending our petitions instead of those from legitimate users. The actual availability of the service is thus reduced, while the data rate is adjusted to avoid potential defense mechanisms deployed against high-rate DoS attacks at the server side. A mathematical model for this kind of attack is contributed in the paper. By means of it, the effects of the attack can be analyzed for several scenarios, and its basic parameters tuned to optimize its performance. The results obtained will be contrasted with the values obtained from a simulation environment and some guidance is given on the applicability of this model. On the basis of the information provided by the model, we make some observations on possible defense techniques. The paper is structured as follows. In Section II, we review the fundamentals of the LoRDAS attack. After that, a framework for evaluating the performance and its mathematical model is contributed. For this purpose, in Section III, the indicators used to evaluate the performance of the attack are specified, while the main concepts and the methodology used in the evaluation are presented in Section IV. From this, the estimation of the available time is dealt with in Section V, and based on that, a mathematical model for each of the performance indicators is proposed in Section VI. After that, Section VII presents the
1556-6013/$26.00 © 2009 IEEE Authorized licensed use limited to: UNIVERSIDAD DE GRANADA. Downloaded on August 25, 2009 at 03:45 from IEEE Xplore. Restrictions apply.
520
IEEE TRANSACTIONS ON INFORMATION FORENSICS AND SECURITY, VOL. 4, NO. 3, SEPTEMBER 2009
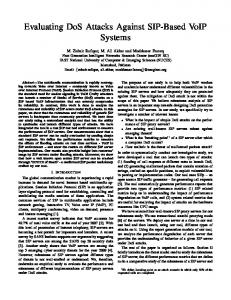
Fig. 1. Diagram for an attack period. Waveform and parameters.
experimental results on the model’s applicability. Finally, some conclusions are drawn in Section VIII. II. LoRDAS ATTACK FUNDAMENTALS The LoRDAS attack consists of sending attack packets in an intelligent way to the server, in order to achieve DoS with relatively low-rate traffic. The reduced traffic rate may enable the attacker to bypass possible security mechanisms that detect high-rate traffic flows and also to carry out the attack with a considerably lower consumption of resources. In what follows, only the fundamentals needed to derive the mathematical model proposed in the rest of the paper are highlighted. For further information, the details of the LoRDAS attack can be found in [8] and [16]. We assume a server with a single application which has a finite queue where incoming requests are received (service queue). Once a service request arrives, it has to wait for its turn to be served by the corresponding application process or thread. When extracted from the queue, a new position is available for a new incoming request. In this case, we say that a position has been issued or freed in the server. Then, the corresponding process or thread serves the request during a so-called service time, . This model can be easily extended to more complex servers using the guidelines in [8], thus representing either a typical standalone server, or a farm of servers, or even servers in a content distribution network [17]. The attack is launched by executing consecutive attack periods against a victim server, an attack period being a waveform that consists of ON–OFF sequences of attack messages. The aim of this mechanism is to keep the service queue of the target application server completely full of requests coming from the attacker, so that any new incoming request sent by legitimate users is discarded, thus generating a DoS. The attack waveform, represented in Fig. 1, is characterized by the following parameters: 1) Interval ( ): the period of time between the sending of two consecutive attack messages during the activity interval. 2) Ontime phase ( ): the activity interval during which an attempt to acquire a freed position in the service queue is made by emitting attack messages at a rate given by . 3) Offtime phase ( ): the inactivity interval before ontime in the attack period, and during which there is no transmission of attack packets. The key strategy of the LoRDAS attack is to forecast the instants at which any free position is issued in the service queue, and scheduling attack periods in such a way that the packets sent during each ontime phase reach the server around these instants. Ideally, if the prediction is exact, the ontime phase will consist of
a single attack packet, which is able to acquire the freed position in the service queue. Thus, the better the prediction, the lower the required rate of the attack traffic. References [7], [8], and [16] discuss the different methods used by the attacker to estimate the instants at which free positions are issued in the queue. The attacker mainly sends requests and waits for the corresponding answers. Under certain conditions, an analysis of the time between a request and its answer may make it possible to deduce the service time involved in serving the request. Hopefully, all identical requests to this are going to have the same However, changes can appear mainly due to variances in the server and in the round-trip time to reach it from the attacker. We will denote these variances by Var. For this reason, applying the central limit theorem, the observation of the service time from the attacker is modeled in [16] as a normal distribution (1) As well as the sequence of attack periods, the intruder uses another mechanism in the attack. This consists of sending another attack message every time an answer is received. The aim of this mechanism is to reduce the amount of time that a position in the service queue is free when the messages of the corresponding attack period fail in acquiring it. These additional requests are termed reply attack messages. Note that, with an appropriate configuration, there could be no differences between this kind of attack and high rate DoS flooding attacks. Thus, LoRDAS can become a brute-force attends to 0 and is decreased enough [8]. Howtack if ever, the LoRDAS attack is capable of executing the attack periods in an intelligent way so that the traffic arriving at the server is observed as a low-rate flow ( short and sufficiently long). In addition, LoRDAS could be tuned to selectively acquire not all the positions in the service queue, thus afflicting only a partial DoS to the server. In this case, there is a trade off between the traffic rate used against the server and the efficiency obtained by the attack. III. PERFORMANCE INDICATORS FOR THE ATTACK To evaluate the performance of the LoRDAS attack, the following indicators are suggested: 1) Availability, : this is the ratio between the number of legitimate user requests served by the server, and the total number of requests sent by these users. 2) Client success probability, : it is the probability for a legitimate user to acquire a free position in the service queue during an observation period. It is related to the amount of time during which at least one free position in the service queue is available. Although both and are measures of the efficiency, the latter is independent from the user traffic pattern. 3) Overhead, : ratio between the traffic rate generated by the intruder and the maximum traffic rate accepted by the server. The aim of the attack, in terms of the above-defined indicators, is to minimize the availability of the service ( ). This task can be achieved by minimizing the client success probability, which reduces the probability of a legitimate user acquiring a position in the queue. Additionally, the attacker should try to minimize
Authorized licensed use limited to: UNIVERSIDAD DE GRANADA. Downloaded on August 25, 2009 at 03:45 from IEEE Xplore. Restrictions apply.
MACIÁ-FERNÁNDEZ et al.: MATHEMATICAL MODEL FOR LOW-RATE DoS ATTACKS AGAINST APPLICATION SERVERS
521
Fig. 2. Basic example for estimating T (s) by the integration methodology. Section between two attack periods, each one with a single attack message.
the overhead ( ), thus making the attack less detectable by intrusion detection systems while consuming fewer resources.
Fig. 3. Sequence of consecutive occurrence probability functions during an observation period and their associated nonoverlapping sections.
IV. PRELIMINARY CONCEPTS AND METHODOLOGY Our mathematical model intends to analytically relate the above indicators with the design parameters of the attack ( , , and ), and the network and server dynamics. The aim here is to build a powerful tool to both evaluate the performance of the attack and tune its optimal operation point. This is of vital importance for the attacker, since choosing the design parameters is a trade off between the damage that the attack can inflict on and the resources required for that. Before setting out to develop the model, several useful concepts are defined. : 1) Occurrence probability function for an answer , Given a request that is being served, is the function that represents the probability that its corresponding answer is being produced by the server at the instant . Note that, as argued in [8], this function corresponds to the distribution of a normal variable [see (1)], whose mean value is forecasted by the intruder for each request as the attack is being struck. 2) Superposition distance, : It is defined for two different functions and , corresponding to the consecutive answers and , as the time distance between the mean values of and . The superposition distance is a random variable whose distribution is . 3) Section: It is the elapsed time between the start of each ontime phase corresponding to two consecutive attack periods. Note that the duration of a section corresponds to the value of . 4) Available time: It is the amount of time during which at least a free position in the service queue is available for an observation period . 5) Available time for a section of duration , : It is the mean value of available time generated during any section of duration . For the development of the mathematical model, a two-stage procedure is followed. First, is estimated. Then, an expression for each of the three performance indicators is proposed based on . In order to estimate the value of , we use an integration methodology that considers the mean value depending on the instants at which the answers are generated by the server. An example can illustrate this methodology. In Fig. 2, we can see a scenario in which a section between attack periods, each one with a single attack message (for simplicity), is represented. The section is delimited by two attack packets that arrive at the server at instants and , respectively. We assume that, at instant
Fig. 4. Scenario for evaluating T (s) in a generic section: occurrence probability functions f (t) and f (t), calculation points a , and calculation intervals A–G, for a superposition distance s (the number of attack messages in every attack period is n = 3 in this representation).
, the service queue is full of requests.1 The probability for the generation of an answer is represented by . In order to calculate the mean estimated value for , we integrate all the possible values, which are
(2) This methodology should be applied to all the answers generated during an observation period . Thus, for every section, we integrate the contributions of all the occurrence probability functions in . As the different sections do not overlap (see Fig. 3), the total available time for is the sum of the contributions in every section. V. ESTIMATION OF THE AVAILABLE TIME FOR A SECTION Following the proposed methodology, we now extend the basic example in Fig. 2 to a scenario that considers a generic section , delimited by the occurrence probability functions and (see Fig. 3). The attacker will send messages which will reach the server around the instants estimated for the generation of the answers (mean values of and ). In Fig. 4, we can see these functions as well as the attack messages that belong to the corresponding attack periods. In this scenario, we define certain calculation points. A calappears for every attack culation point message trying to acquire a position freed by the answer with 1In [8], we discuss how this can be accomplished by the attacker in the initial stages of the attack.
Authorized licensed use limited to: UNIVERSIDAD DE GRANADA. Downloaded on August 25, 2009 at 03:45 from IEEE Xplore. Restrictions apply.
522
IEEE TRANSACTIONS ON INFORMATION FORENSICS AND SECURITY, VOL. 4, NO. 3, SEPTEMBER 2009
a generation probability . In a similar way, the calculation appear at the instants at which the points arrive. Moreover, two adattack messages associated to and , are defined at a distance ditional calculation points, (mean value of the round-trip time between the server and and , respectively: , the intruder) before . From the calculation points, we will define a set of nonover, as lapping calculation intervals, depicted in Fig. 4, which will be used for applying the integration methodology separately, as explained below. For the intervals , , , and , the upper and lower bounds , , are fixed: , and . On the other hand, depending on the size of the section , the bounds of the intervals , , and vary, and it could even happen that a given interval does not exist. Interval comprises , and only exists if . Interval exists only if and its upper bound is , while the lower bound is . Finally, interval comprises , where . Finally, note that every interval could be composed of one or more time divisions, which are delimited by the calculation points within the interval.
the intervals that constitute the section, that is, Let be the contribution in interval
B. Contribution of the Section Boundary Answers For studying this contribution, we will focus on the scenario depicted in Fig. 4. will be estimated by separately applying the integration methodology previously highlighted for
, and . . Then, (3)
Let us focus in a time division delimited by two generic calculation points and within the section. As we are now con, sidering only the possible occurrence of the answers or when a contribution to the available time is generated, the following cases may have happened: 1) only one answer occurs (we will refer to this as scenario —unique anduring (scenario ). swer) and 2) two answers occur during Let be the mean value of the contribution if scenario is to the available time during the interval considered and at least one of the answers occurs at instant . and the We are now interested in evaluating the values associated probabilities of occurrence for scenarios and . Regarding scenario , if one answer is generated during at instant , the contribution to the available time begins at and ends when the next attack message arrives, that is, either at (calculation point) or at , where RTT is the round-trip time spent by the answer to arrive to the attacker and the corresponding reply attack message to reach the server again. Thus, considering the mean value for the round-trip time
A. Methodology , we evaluate it by separately To ease the estimation of considering three different contributions. 1) Contribution of the section boundary answers: First, we as if only the answers and , will estimate which delimit section , are generated during the attack process. The studied section is that defined by these two answers. This scenario is that represented in Fig. 4. The . value of this contribution is denoted by 2) Contribution of the rest of answers: Next, we extend the to a scenario in which many previous estimation of answers from the server are considered. Then, we estimate . The the contribution of the answers other than and value of this contribution is denoted by . 3) Contribution of reply attack messages: This last contribution is given by the arrival of reply attack messages during the considered section, which are generated as a response to answers other than and (section boundary answers). Reply attack messages associated with answers and are considered in the first contribution. given by the first two contriThe estimated values for butions will be modified by considering the third contribution. and . We denote the modified contributions as Then, the final value for is computed as the sum of the two first contributions after being modified: . In the following, we detail the procedure for estimating these three different contributions to .
,
(4) Regarding the occurrence probability for scenario , we will ) occurs at , consider the probability that an answer ( or . Let be the proband the other does not occur within , and its compleability that answer occurs within mentary probability, that is,
(5) is the cumulative distribution function for . where Then, the probability for scenario is , if answer occurs; and , in case answer occurs. Thus, the contribution to due to scenario , considering the occurrence of either answer or , is
(6) Regarding scenario , recall that it considers the generation of two answers within the considered time division . Here, the value of the mean contribution to available time if an answer occurs at , , will reach its maximum value, equal to , only when the two answers occur separated a time distance higher or equal to between them, and also between the second answer and the next calculation point. Only in this case, the free positions in the service queue are acquired by the corresponding reply attack messages which last each. Due to the wide number of possible scenarios, we approximate
Authorized licensed use limited to: UNIVERSIDAD DE GRANADA. Downloaded on August 25, 2009 at 03:45 from IEEE Xplore. Restrictions apply.
MACIÁ-FERNÁNDEZ et al.: MATHEMATICAL MODEL FOR LOW-RATE DoS ATTACKS AGAINST APPLICATION SERVERS
this term by a mean value considering the maximum and minimum values, which should be estimated separately for every different time division
523
and to the available time The contributions of in the intervals , , , and are calculated as
(7) An example may clarify how this term is calculated. Consider that, in Fig. 4, two answers are generated in the time division . The minimum value for will be reached if the . On the other two answers happen at : hand, the maximum value is reached when one answer occurs . just at and the other just at : In this case: . The proposed values for the different intervals are presented in for the term calculated in this way Appendix A. Note that the term . does not depend on , so we use the notation The probability for the scenario to happen is given by either or , where the contribution to available time in this scenario is (8) Considering expressions (6) and (8), the contribution to the mean available time in an interval is
(9) C. Contribution of the Rest of Answers to a sceNow, we extend the previous estimation of nario in which many answers from the server are considered, . The proposed method here is as foland not only and lows: instead of taking into account the mean contribution of all the previous and subsequent occurrence probability functions in and in Fig. 3), a considered section (e.g., answers we consider the mean contribution of an answer in the preceding and subsequent sections. Specifically, we will evaluate the influence in the subsequent sections when evaluating secis assessed. tion , and in preceding sections when section This way, the term will take into account the mean conto the subsequent sections (intervals and tribution of in Fig. 4) and to the preceding sections (intervals and in Fig. 4). Generically, the mean contribution of an occurrence probability function in a generic interval is denoted by . This is a constant value that represents the mean value of the contribution to available time of either answers or in their respective intervals . Although this could seem a coarse approximation, it can be justified by the fact that the contribution of these answers in the rest of the sections is expected to be lower than that of the boundary answers for these sections, as their probability of occurrence is also lower. In fact, results obtained in experimental validation (Section VII) show us the validity of this approximation.
(10) Note that the contribution of is only calculated in interis considered in intervals vals and , while that of and . The factors are obtained as an average that considers the mean contribution to available time when the size of the sections is specified, that is, terms denoted by (11) For the calculation of the functions , we suggest to estimate a constant value when is high, another constant value for low values of , and build a function interpolating linearly these two values. In addition, the constant values are estimated following the same strategy as used for the calculation in expression (7), that is, we estimate the maximum and minimum values for the generated available time and take their uniform average. In the following, this procedure is applied to intervals , , , and separately. 1) Interval : In this interval, no matter the value of , the maximum time distance between attack packets is , where the minimum is 0 in case two attack packets arrive at the same time ( is low enough to overlap ontime phases of two different attack (which is a normal configperiods). Then, assuming uration for the attack), the amount of available time generated by an answer that occurs in this interval has a maximum value and a minimum 0. Then, the proposed value for the mean contribution to available time when an answer is generated in interval is (12) 2) Intervals and : The intervals and span the occurrence of the answers or in the intervals , , and of other section that occurs before or after section . Considering first a long superposition distance , if occurs in the ontime phase of the attack period related to the answer , the additional available time generated could be approximated, considering the maximum and minimum values as in interval , with a value . However, if answer happens in the offtime phase (interval or of section ), and it occurs at a distance greater than or equal to from any other answer, the additional time would be (reply attack message). Only if another answer happens in a window of around the instant at which answer occurs, the additional contribution of answer would be less than . Note that, if is high enough, the probability that answer jointly occurs in a window with answers or becomes low. For this reason, in this situation, the value of , with high, could be approximated by . On the other hand, as becomes lower, so does the expected contribution. This reduction will be progressive until the value
Authorized licensed use limited to: UNIVERSIDAD DE GRANADA. Downloaded on August 25, 2009 at 03:45 from IEEE Xplore. Restrictions apply.
524
IEEE TRANSACTIONS ON INFORMATION FORENSICS AND SECURITY, VOL. 4, NO. 3, SEPTEMBER 2009
Fig. 7. Scenario to study the instant at which a reply attack message arrives after an answer is generated at t. Fig. 5. Graphical representation of the function t (s)
Fig. 6. Graphical representation of the function t (s)
.
.
is reached, when the maximum separation between attack packets is . Then, the approximated value would . be The function proposed for is graphically represented in Fig. 5. It can be seen that the value is achieved for (where is an adjustment parameter to be obtained from a heuristic comparison between the values obtained from the model and those from the simulation2). is slightly different 3) Interval : The case of interval from that of intervals and , as we positively know that, independently of the value for section , where the answer happens, the time elapsed until the arrival of the next attack mes. sage (the worst case is at ) will always be less than Thus, in this approximation, the value proposed for is (the mean value between the maximum, , and the minimum, 0), and it is applied for the range . For the remaining values, the approximation for the intervals and is applied, yielding the function depicted in Fig. 6, where the is assumed. Otherwise, the funccondition . In addition, it is supposed tion becomes a constant value that . Otherwise, the function becomes a constant . value D. Contribution of Reply Attack Messages Reply attack messages are sent by the intruder as a response every time an answer is received. The mean time between the generation of the answer and the reception of the reply attack message in the server is . In the formerly studied contribution by the section boundary answers, these messages were only taken into account when the answer was generated within the considered interval . However, it may happen that new reply 2The value = 4 has been heuristically shown to be a good approximation for this parameter, as it will be shown in Section VII. However, an optimization of the approximations assumed in the model has not been addressed in the present study.
attack messages appear as responses to answers generated in previous intervals. Depending on the scenario under consideration, these additional attack messages affect the instantaneous value of the corresponding available time, , , or . Thus, the expressions should be modified to take these effects into account. The number and the position of the reply attack messages that depend on the number and the appear in a generic interval position of the answers generated in the range . In modeling the arrival of these reply attack messages, two assumptions are made. First, we assume that the number of answers in an interval is given by the mean output rate in the server. As the low-rate DoS attack is based on the sending of identical requests to the server, with their mean service time and the number of threads or processes in the server being , the mean value of the number of answers generated during is a time (13) On the other hand, note that the appearance of a reply attack message in a time division generates a new subdivision. Given that the result from (13) might not be an integer value, the number of subdivisions into which a generic time division is split is at least one more than the number of reply attack messages received (14) The second assumption is that the size of the subdivisions is equal, that is, the reply attack messages arrive equally spaced. With this second assumption, it is now possible to modify the value of the factors , , and . Let us first consider the factor . In a generic interval that is split into equal subdivisions, to calculate the con, it would first be necessary to detribution of an answer to termine the subdivision at which the answer occurs. Under the two assumptions previously explained, the arrival of the reply attack message that immediately follows the instant at which the answer is generated (see Fig. 7), is given by (15) . where Then, the factor , when considering subdivisions in the interval is denoted by , and its expression is obtained by modifying (4)
Authorized licensed use limited to: UNIVERSIDAD DE GRANADA. Downloaded on August 25, 2009 at 03:45 from IEEE Xplore. Restrictions apply.
(16)
MACIÁ-FERNÁNDEZ et al.: MATHEMATICAL MODEL FOR LOW-RATE DoS ATTACKS AGAINST APPLICATION SERVERS
Regarding now the value of , as this does not depend on , its new value, , is equal to the former [see (7)] divided by
525
where represents the number of sections that occur during an observation period . B. Mathematical Model for the Availability
(17) The former rationale is also applied to the factors , and so their modified values are
,
(18) One final refinement is made to this approximation. As the number of reply attack messages given by (13) might not be an integer value, the number of subdivisions could be either or , depending on the number of reply attack messages being or , respectively. Thus, the probability of subdivisions is appearing within the considered interval (19) subdivisions appearing while the probability of is the complementary value (20) Finally, all these modifications should be incorporated into in the two previously the expressions used to calculate studied contributions (Sections V-B and V-C). As an example, (10), corresponding to the contribution of the rest of answers, is modified as
The availability has been defined as the ratio between the number of legitimate user requests served by the server, and the total number of requests sent by these users, i.e., represents the perception of the users about the actual provision of the service. The legitimate users’ traffic is modeled as proposed in [16] as a Poisson arrivals process. Thus, the probability of a legitimate message being received during an observation period is given by the exponential distribution (23) where is the aggregated rate of message arrival coming from all the possible legitimate users in the system. The model that we propose for the calculation of is based . A previous step in the calculation on the estimation for of is to determine the probability, in a server under a low-rate DoS attack, of a legitimate user managing to acquire a free position in the service queue. This probability is denoted by , and can be calculated from (23), considering that the observation time corresponds to that during which the service queue has at least a free position. Note that for every interval in Fig. 4, this . Thus, we could time corresponds to the available time as a function of the superposition distance as calculate (24) Following this, the average value is taken, considering the distribution of , that is,
(21)
(25)
Following these guidelines, the expression (3) for the contribution of the section boundary answers should also be modified similarly.
Finally, for a generic observation period , during which positions in the service queue are acquired, the availability is given by the ratio of the number of acquisitions made by the , to the number of messages sent by the legitimate intruder, users, that is,
VI. MATHEMATICAL MODEL In this section, the mathematical model for obtaining the performance indicators , , and is proposed based on the ex. pressions given for A. Mathematical Model for the Client Success Probability As defined in Section III, the client success probability is related to the amount of time during which at least one free position in the service queue is available, when no legitimate users are accessing the system. Starting from the estimation for the available time given in Section V for a section , it is straightforward to give an expression for , just considering the mean value of the available time in all the sections . Then, the expression for is (22)
(26) However, the inherent problem in the former expressions is that the terms do not consider the influence of the legitimate user traffic. Hence, the available time considered should really be lower, as it is reduced by every acquisition made by a legitimate user. Let us see how this effect can be included in the model. When legitimate user traffic arrives at the server at a rate of , these messages could be treated in a similar way as reply attack messages are, as their effect on the behavior of available time is the same. First, we could consider that the reply attack message rate is increased by . Second, every acquisition made by a legitimate user implies a reduction of one reply attack message, as the users will not respond to the reception of the answers. Thus, the rate of reply messages should be reduced by a factor
Authorized licensed use limited to: UNIVERSIDAD DE GRANADA. Downloaded on August 25, 2009 at 03:45 from IEEE Xplore. Restrictions apply.
526
IEEE TRANSACTIONS ON INFORMATION FORENSICS AND SECURITY, VOL. 4, NO. 3, SEPTEMBER 2009
. Accordingly, in a generic interval reply attack messages becomes
, the number of
(27) and, therefore, the parameter
from (14) is modified as
(28) with its associated probability being
(29) In summary, in obtaining the value for , (24), (25), and (26) are used, taking into account that, in the evaluation of the terms , the parameters and should be calculated as in (28) and (29). Finally, note that in this calculation process, the values and are obtained in a recursive way, as there is a cross dependence between them. Although at first sight this could lead to instabilities in the calculation, these values converge after just a few iterations. C. Mathematical Model for the Overhead The overhead is defined as the ratio between the traffic rate generated by the intruder, and the maximum traffic rate accepted by the server. The calculation of must take into account the number of attack messages generated by the intruder during an observation period. If we match the observation period to the time elapsed during an attack period, the number of accepted messages from the server is exactly one, corresponding to the position freed due to the answer around which the messages of the attack period arrive. In these conditions, the overhead is given by the mean number of attack messages that arrive during a single attack period. Two factors contribute to the generation of attack messages in an attack period. First, the reply attack message is generated as a response to the answer. This message is generated only if the answer is sent to the intruder, that is, the mean number of reply at. Second, the tack messages in an attack period is given by activity period during which attack messages are generated at a rate of , with being the number of messages (30) Thus, the overhead is given by (31)
VII. EXPERIMENTAL RESULTS ON THE APPLICABILITY OF THE MODEL After proposing the model, let us examine its applicability. The model allows us not only to evaluate the performance of the attack for each specific configuration chosen for the
attack, victim server, network features, etc., but also to comprehensively describe the details of the behavior of the attack. However, as several approximations have been assumed for the model, it is necessary to test the accuracy of the results derived from it. The difficulty of carrying out an exhaustive set of experiments in real environments, involving production servers and real traffic must be noted at this point. This fact, together with the contrasted performance exhibited by current simulation tools, gives way to accepting this kind of software as valid frameworks for experimentation. On the other hand, the high number of variables and possible scenarios involved in the LoRDAS attack can render unfeasible the extensive testing of its impact and limitations just by means of simulation. Therefore, we implemented within network simulator 2 [18] a victim server that is able to concurrently process requests, a legitimate user traffic generator, and a module that effects a lowrate DoS attack against the server. In this simulated environment, we carried out a set of experiments focused on obtaining the indicator values , , and for many different configuration settings of the parameters of the attack, network, and victim server. The aim of these experiments was to contrast the performance indicator values obtained from the simulation environment and those derived from the analytical models proposed. Fifty different scenarios were simulated, using ranges of values for the configuration parameters that were appropriate for the attack (see recommendations for the attack in [7]). The range , , of values used was average service time , and . These scenarios constitute a wide enough framework for us to be sure of the representativeness of the results and conclusions obtained below. It was found that the values obtained for from the model provide a good approximation of the simulation values. Among all the simulations made, the maximum absolute deviation is 1.03%, with the mean value obtained being 0.44%. Fig. 8(a) shows a comparison between the client success probabilities obtained from the simulation and the model for 12 different, significant scenarios. The same experiment was carried out for the indicator . In this case, the maximum absolute deviation found between the simulation and the model results is 3.86%, with a mean value of 2.27%. Note that this deviation is higher than in the case of , which is because the model for is based on the value obtained for and, thus, the number of approximations in this case is higher. Fig. 8(b) shows a comparison of the availability values obtained from the simulation and the model for 12 different, significant scenarios. Finally, the overhead indicator was also tested, both with the simulation and with the model used for the same experiments. In this case, the maximum absolute difference between the values extracted was 4.18%, with a mean value of 1.92%. Fig. 8(c) shows a comparison between the overhead values obtained from simulation and the model for 12 different, significant scenarios. In summary, the results of the comparison between the indicator values obtained from the mathematical model and those from the simulation indicate that the proposed mathematical model behaves accurately with respect to the simulated behavior. A better adjustment of the approximations made in
Authorized licensed use limited to: UNIVERSIDAD DE GRANADA. Downloaded on August 25, 2009 at 03:45 from IEEE Xplore. Restrictions apply.
MACIÁ-FERNÁNDEZ et al.: MATHEMATICAL MODEL FOR LOW-RATE DoS ATTACKS AGAINST APPLICATION SERVERS
527
Fig. 9. Evolution of the indicators C and overhead O , as certain parameters of the attack, the network, and the victim server are modified: (a) duration of the ; (b) interval of the attack period, ; activity phase of the attack period, t and (c) variance of the service time and RTT, Var.
1
Fig. 8. Comparison between the performance indicator values (expressed as percentages) obtained from the simulation and those derived from the analytical models for different scenarios: (a) client success probability, C ; (b) availability, A; and (c) overhead, O .
the model could even lead to better results, although this point has yet to be confirmed. From the above, it can be concluded that the mathematical model is a promising valuable tool for describing the behavior and, thus, assessing the performance of an attack configuration. It could be used for making design decisions by both the intruder and the defenders, as it provides in-depth knowledge about the behavior of the attack. In this sense, we provide an overview example of the model’s applicability, consisting of an analysis of the reaction of the attack performance when a single configuration parameter is varied, while the others remain fixed. We analyze the behavior of both the client success probability and the overhead features, when the parameters , , and Var are independently varied.
From the equations provided by the model, it can be deduced implies a reduction that an increase in the duration of in , as well as an increase in , as the number of attack messages (and thus the number of calculation points) increases. It has been shown by means of simulation that this behavior is as expected. The results are shown in Fig. 9(a) where, for simare drawn (in perplicity in the representation, the values centage). For this experiment, the following values were chosen for the other parameters: , , , , and . The same experiment was carried out to study the reactions to variations in the parameter. In this case, the equations of the model reveal that an increase in this parameter always inand a reduction in . This was convolves an increase in firmed by using simulations in which is varied [see the results in Fig. 9(b)]. In this experiment, the other parameters had values . reported above and, additionally, the value
Authorized licensed use limited to: UNIVERSIDAD DE GRANADA. Downloaded on August 25, 2009 at 03:45 from IEEE Xplore. Restrictions apply.
528
IEEE TRANSACTIONS ON INFORMATION FORENSICS AND SECURITY, VOL. 4, NO. 3, SEPTEMBER 2009
Finally, the parameter Var was also studied. In this case, there is no linear dependence between the parameter and or in the model. As the variances increase, so too, apparently, does (due to deviations in the estimation of the instant of the answer by the intruder), but as they affect the form of the occurand , when the varirence probability functions ance increases, the different overlap increasingly, which means that some attack periods help others to acquire the corresponding answers. It is shown in Fig. 9(c) that an increase in the variance does not mean a linear increase in the available time, and it could even result in lower values. This has important implications. For example, it could be considered a defense measure against these attacks based on the randomization of the service time of the requests. Although it would help to increase slightly, no great improvement in the performance of the server is to be expected from this. On the other hand, it can be seen in the expressions of the , as it model that is very sensitive to the value of the term affects the intervals where the probability values are higher. This means that possible defense mechanisms should exploit this fact in order to be more effective. In summary, the experiments carried out to study the applicability of the model show how the model can be used to extend the results obtained from simulation to generic untested scenarios, and to draw new conclusions about the fundamentals of the attack. We strongly recommend the proposed model be considered a useful tool for describing, designing, and evaluating the behavior of the attack in order to develop effective defense techniques. VIII. CONCLUSION This paper contributes a framework for describing and evaluating both the behavior and the performance achieved by a LoRDAS. The scheme used consists of a mathematical model that analytically relates the configuration parameters of the attack, the victim server and the network that interconnects them, and the performance indicators of the attack. The main goal of this work is to extend the mathematical model presented in [19]. The latter did not consider either the case of iterative servers with superposition among the occurrence probability functions or that of their functioning as a concurrent system. Accordingly, we have extended the model in order to necessarily consider these phenomena. The proposed model was evaluated and contrasted against a simulated environment, leading to the conclusion that the values obtained from the two methodologies are very similar. This fact allows us to obtain conclusions about the attack dynamics and performance by analyzing the expressions given by the model, and also to extend the results and conclusions obtained by simulation techniques to scenarios that have not previously been tested. We provide an example of the applicability of the model, by which the mathematical model has been shown to be a valuable tool to evaluate the effectiveness of this kind of attack. From this evaluation example, the following conclusions are drawn: 1) A term that has a major influence on the effectiveness of the attack is the round-trip time of the messages between the attacker and the victim server. 2) The existence of superposition phenomena among the occurrence probability functions, as typically happens in
concurrent servers architecture, helps the attacker to gain higher efficiency. 3) A defense technique based on the randomization of the service time of the requests would not be the optimum strategy for the defense against the LoRDAS attack. In summary, the contributions of this study allows us to explore the possibilities open to an attacker, and thus more accurate defense mechanisms can be developed. Following on from the results obtained from this model, we are currently working on the development of defense mechanisms. For example, the use of a priority-based service queue is now being studied by the authors.
EXPRESSIONS FOR
APPENDIX IN THE DIFFERENT CALCULATION INTERVALS
Interval : There should be applied a value for every time division within interval . In this case, there is a differ, ence between the last time division of the interval and the others. Thus, for a time division , the minimum value of the generated available time is obtained when the two considered answers take place just before . In this case, the value is . On the other hand, if one and the other just before (if answer occurs just after ) or (if ), then the maximum value is achieved and its value is . Then, the mean value is
On the other hand, when two answers occur in the interval , the minimum available time is achieved when they , and it corresponds to [exprestake place just before sion (11)]. The maximum value appears when one answer takes and the other just before , this value place just after . The mean value is, in being this case
Interval : Here, the maximum available time is , which is obtained when one of the answers takes place just seconds before the other. When both of them occur at the same time, the minimum value is obtained, . The mean value is, therefore,
Interval : Here, the minimum value of the available time is and the maximum . Hence, the mean value is
ACKNOWLEDGMENT The authors would like to thank the anonymous reviewers for their invaluable comments and suggestions, which have contributed to the improvement of the final version of the paper.
Authorized licensed use limited to: UNIVERSIDAD DE GRANADA. Downloaded on August 25, 2009 at 03:45 from IEEE Xplore. Restrictions apply.
MACIÁ-FERNÁNDEZ et al.: MATHEMATICAL MODEL FOR LOW-RATE DoS ATTACKS AGAINST APPLICATION SERVERS
REFERENCES [1] J. Mirkovic, S. Dietrich, D. Dittrich, and P. Reiher, Internet Denial of Service. Attack and Defense Mechanisms. Englewood Cliffs, NJ: Prentice-Hall, 2004. [2] C. Douligeris and A. Mitrokotsa, “DDoS attacks and defense mechanisms: Classification and state-of-the-art,” Comput. Netw., vol. 44, no. 5, pp. 643–666, 2004. [3] J. Mirkovic and P. Reiher, “A taxonomy of DDoS attack and DDoS defense mechanisms,” SIGCOMM Comput. Commun. Rev., vol. 34, no. 2, pp. 39–53, 2004. [4] A. Kuzmanovic and E. Knightly, “Low-rate TCP-targeted denial of service attacks (The shrew vs. the mice and elephants),” in Proc. ACM SIGCOMM’03, Aug. 2003, pp. 75–86. [5] M. Guirguis, A. Bestavros, I. Matta, and Y. Zhang, “Reduction of quality (RoQ) attacks on internet end-systems,” in Proc. 24th Annual Joint Conf. IEEE Computer and Communications Societies (INFOCOM 2005), Mar. 13–17, 2005, vol. 2, pp. 1362–1372. [6] M. Guirguis, A. Bestavros, I. Matta, and Y. Zhang, “Reduction of quality (RoQ) attacks on dynamic load balancers: Vulnerability assessment and design tradeoffs,” in Proc. 26th IEEE Int. Conf. Computer Communications, May 2007, pp. 857–865. [7] G. Maciá-Fernández, J. E. Díaz-Verdejo, and P. Garcia-Teodoro, “LoRDAS: A low-rate DoS attack against application servers,” in Proc. CRITIS’07, 2008, vol. 5141, LNCS, pp. 197–209. [8] G. Maciá-Fernández, J. E. Díaz-Verdejo, and P. Garcia-Teodoro, “Evaluation of a low-rate DoS attack against application servers,” Comput. Security, vol. 27, pp. 335–354, 2008. [9] M. Guirguis, A. Bestavros, and I. Matta, “On the impact of low-rate attacks,” in Proc. IEEE Int. Conf. Communications, 2006 (ICC ’06), Jun. 2006, vol. 5, pp. 2316–2321. [10] A. Shevtekar, K. Anantharam, and N. Ansari, “Low rate TCP denial-ofservice attack detection at edge routers,” IEEE Commun. Lett., vol. 9, no. 4, pp. 363–365, Apr. 2005. [11] H. Sun, J. Lui, and D. Yau, “Defending against low-rate TCP attacks: Dynamic detection and protection,” in Proc. 12th IEEE Int. Conf. Network Protocols (ICNP04), Oct. 2004, pp. 196–205. [12] Y. Chen and K. Hwang, “Collaborative detection and filtering of shrew DDoS attacks using spectral analysis,” J. Parallel Distrib. Comput., vol. 66, no. 9, pp. 1137–1151, 2006. [13] G. Yang, M. Gerla, and M. Y. Sanadidi, “Defense against low-rate TCP-targeted denial-of-service attacks,” in Proc. IEEE Symp. Computers and Communications (ISCC’04), Alexandria, Egypt, Jul. 2004, pp. 345–350. [14] A. Shevtekar and N. Ansari, “A proactive test based differentiation technique to mitigate low rate DoS attacks,” in Proc. 16th Int. Conf. Computer Communications and Networks (ICCCN 2007), 2007, pp. 639–644. [15] Y. Wang, C. Lin, Q.-L. Li, and Y. Fang, “A queueing analysis for the denial of service (DoS) attacks in computer networks,” Comput. Netw., vol. 51, no. 12, pp. 3564–3573, 2007. [16] G. Maciá-Fernández, J. E. Díaz-Verdejo, and P. Garcia-Teodoro, “Evaluation of a low-rate DoS attack against iterative servers,” Comput. Netw., vol. 51, no. 4, pp. 1013–1030, 2007. [17] D. C. Verma, Content Distribution Networks. Hoboken, NJ: Wiley, 2002.
529
[18] K. Fall and K. Varadhan, The NS Manual 2007 [Online]. Available: http://www.isi.edu/nsnam/ns/ [19] G. Maciá-Fernández, J. E. Díaz-Verdejo, and P. Garcia-Teodoro, “Mathematical foundations for the design of a low-rate DoS attack to iterative servers (short paper),” Lecture Notes in Computer Science, vol. 4307, pp. 282–291, 2006.
Gabriel Maciá-Fernández received the M.S. degree in telecommunications engineering from the University of Seville, Spain, and the Ph.D. degree in telecommunications engineering from the University of Granada, Spain. He is Assistant Professor in the Department of Signal Theory, Telematics and Communications, University of Granada. From 1999 to 2005, he worked as a specialist consultant at “Vodafone Spain,” where he was involved in several research projects. His research was initially focused on multicasting technologies but he is currently working on computer and network security, with special focus on intrusion detection, reliable protocol design, and denial of service.
Jesús E. Díaz-Verdejo (M’93) received the B.Sc. degree in physics (electronics speciality) from the University of Granada, Spain, in 1989, and the Ph.D. degree in physics in 1995. He is Associate Professor in the Department of Signal Theory, Telematics and Communications, University of Granada. His initial research interest was related with speech technologies, especially automatic speech recognition. Currently he is working in computer networks, mainly in computer and network security, although he has developed some work in telematics applications and e-learning systems.
Pedro García-Teodoro received the B.Sc. degree in physics (electronics speciality) from the University of Granada, Spain, in 1989. In 1989, he received a grant from “Fujitsu Spain,” and during 1990, he received a grant from “IBM Spain.” Since 1989, he is Associate Professor in the Department of Signal Theory, Telematics and Communications, University of Granada, and member of the “Research Group on Signal, Telematics and Communications” of this University. His initial research interest was concerned with speech technologies, in which he developed his Ph.D. thesis in 1996. Since then, his professional interests have been in the field of computer and network security, especially focused on intrusion detection and denial of service attacks.
Authorized licensed use limited to: UNIVERSIDAD DE GRANADA. Downloaded on August 25, 2009 at 03:45 from IEEE Xplore. Restrictions apply.