TMME, vol7, no.1, p .113
Mathematical Reasoning in Service Courses: Why Students Need Mathematical Modeling Problems
Kris H. Green1 and Allen Emerson St. John Fisher College, Rochester, NY (USA)
Abstract: In this paper we argue that conventional mathematics word problems are not aligned with the typical learning goals and expectations partner disciplines, especially business, have in requiring that their students take mathematics courses. Using the taxonomy of educational objectives presented by Anderson and Krathwohl (2001) we show how mathematical modeling problems can be used to promote the needed alignment and contrast two examples to illustrate the differences. We then demonstrate how the more conventional word problem can be rewritten as a modeling problem. Sample assessment materials and instructional activities are included to support teachers in making the transition to the use of modeling problems. Keywords: modeling, applications, mathematical reasoning, Bloom’s revised taxonomy
Lynn Steen, in reference to a broad study of quantitative literacy, claims that “Most students finish their education ill prepared for the quantitative demands of informed living” 1
[email protected]
The Montana Mathematics Enthusiast, ISSN 1551-3440, Vol. 7, no.1, pp.113- 140 2010©Montana Council of Teachers of Mathematics & Information Age Publishing
Green & Emerson (Steen, 2004, p. 11). If this is true of life in general, then we believe this is particularly true of student’s preparation for the use of quantitative tools in the workplace, especially in the business world. Moreover, we are amongst those educators who are trying to address the concerns of employers who remark that employees who were “A” students in statistics cannot even use simple graphs to analyze day-to-day problems. The reason for this situation, we think, is not that the students are stupid or the offered courses are bad. The problem, we believe, is that the mathematics textbooks for undergraduates are not targeted toward the goal of applying quantitative methods and techniques to real world problems. Since the problem sets students work from these texts are the backbone of what students will take from the course, a course built around such a text is simply not designed to promote this kind of thinking. Judging from our fairly extensive review of textbooks designed to support mathematics courses for business undergraduates, we feel secure in making the claim that the majority of such textbooks are designed to teach students particular mathematical techniques and procedures rather than to help students develop thinking skills necessary for analyzing the kinds of quantitative information they will encounter in their professional lives. While there are few such formal studies at the college or university level, studies of pre-college textbook problems illustrate that this imbalance is extensive and persistent (e.g., Vincent and Stacey, 2008; Kuln, 1999; Witt, 2005). The Association for the Advancement of Collegiate Schools of Business [AACSB] indicates that there exists a very different purpose in requiring these students to enroll in mathematics courses. They describe general learning goals, such as “communications abilities, problem-solving abilities, ethical reasoning skills, and language abilities” (p. 60). Throughout its accreditation standards, AACSB maintains that “accreditation does not mandate any particular set of courses, nor is a prescribed pattern or order intended.” (p. 69) With regard to mathematics,
TMME, vol7, no.1, p .115 the standards make clear the expectation that students in management programs will have learning experiences in “analytic skills” (standard 15, p. 71). Moreover, the standards make reference to only a single math-specific learning outcome: “ [P]rograms…will include learning experiences [such as] statistical data analysis and management science as they support decisionmaking processes throughout an organization.” (p. 70) In addition, a report from the Curriculum Foundations Project (Lamoureux, 2004) of the Mathematical Association of America [MAA] states that “In general, business faculty are less concerned with specific course content than with developing quantitative literacy and analytical ability in our students.” The report further defines this literacy as being “comfortable with using mathematics as a tool to communicate analytical concepts” (p. 19) and clearly explains the need for such an educational objective: Business decisions are most commonly made under conditions of uncertainty and risk. Inferences must be drawn from data and information that is incomplete, inconclusive, and most likely imprecise. Wherever possible, math courses should attempt to illustrate this ambiguity and provide guidance in dealing with such uncertainty and variation. (Lamoureux, 2004, p. 19) These ideas and broad goals are echoed by many of the other disciplines that participated in the Curriculum Foundations Project. Broadly phrased, these recommendations indicate that partner disciplines are interested in problem solving skills, mathematical modeling, and communication (CRAFTY, 2004, pp. 3-4). It is our argument that these objectives are not being addressed by the current slate of texts, problem sets and supporting materials. We will focus our analysis on applications to the business mathematics curriculum, as that is the area with which we are most familiar, but these ideas can, we feel, be extended to almost any of the partner disciplines.
Green & Emerson To help support our claim, we make use of the taxonomy of educational objectives provided by Anderson and Krathwohl (2001), a revision and extension of the original Bloom’s taxonomy. The taxonomy describes educational objectives, learning activities and assessment processes using a two-dimensional framework (p. 5). One dimension describes the type of knowledge being used or developed (knowledge domain) as either: factual, conceptual, procedural or metacognitive. The knowledge domain is then cross-referenced against a cognitive process domain describing what students are doing with that knowledge: remembering, understanding, applying, analyzing, evaluating, or creating. It is our experience that the textbooks, classroom activities, and assessments for mathematics courses typically offered to business students focus primarily on two categories of learning: remembering factual knowledge and applying procedural knowledge. However, the motivation described by the AACSB and the MAA for students to complete mathematics courses as a part of their business curriculum seems to fall at quite a different level of the taxonomy. While the “analytic skills” objective clearly matches up with applying procedural knowledge, the other expectations – problem solving, quantitative literacy, and communication – are quite different. When combined with the idea that such students need to understand that their information is incomplete and uncertain, we see that many more areas of the taxonomy are involved. Even by itself, problem solving in realistic settings tends to reach into the upper three levels of the cognitive process domain (analyze, evaluate and create) and touch, potentially on all knowledge domains (p. 269). Of particular importance, though, is the metacognitive domain. True problem solving requires that the problem solver engage in reflective thinking. This is typically absent in most procedural mathematical activities. The expectation that students will learn to communicate their mathematical solutions requires that students experience activities from the “understand” level of
TMME, vol7, no.1, p .117 the cognitive process domain, an area widely acknowledged as lacking in most procedure-driven approaches to teaching mathematics. These criticisms apply equally well to the idea of quantitative literacy, which, depending upon the specific definition used, could fall nearly anywhere in the taxonomy. Thus, a severe disconnect is apparent; students are expected to be able to apply their mathematical knowledge in a variety of settings as a result of taking such classes. Textbooks designed to support these classes, however, do not typically provide adequate materials to support such learning objectives. Instead, they require mostly lower-level thinking involving the use and development of particular mathematical skills. We propose that this misalignment can be best addressed through a curriculum centered on mathematical modeling problems, rather than a curriculum focused on mathematical procedures. When solving mathematical modeling problems, the modeler begins with a real world situation. The modeler then constructs a model world by making assumptions. This involves the tasks of abstraction, simplification, and quantification of real-world phenomena and events. The modeler analyzes the problem in the model world using mathematical tools and techniques, and then transitions back to the real world by making meaning through interpretation, evaluation and communication. Often, this process is repeated through many cycles, with each cycle informing the next. In a classroom context, using the real world as a source of problems presents a variety of serious challenges. For this reason, we, in accord with Lamoureux (2004, p. 22,) advocate using realistic rather than real world contexts, problems and data. A realistic context is one that is ill-defined, requires the use and interpretation of information in a variety of forms, both quantitative and qualitative, and a need for communicating the results to an authentic, appropriate audience. The data provided to students for such realistic problems is typically invented, rather than genuine, but should have a great deal
Green & Emerson of variability and noise built into it. This allows the creator of the data to include the features needed for teaching specific concepts while still providing some of the ambiguity of real data. As such, these realistic problems stand as educational proxies for what students will encounter on the job in real world contexts. At our college, we have spent quite a few years developing a new course in modeling to help business students develop deeper mathematical understanding through applying this understanding to the business world (Green & Emerson, 2008a). We have three primary objectives in this course: 1. That students develop facility with certain modeling and technological techniques that are useful in dealing with real world data, 2. That students learn to analyze and interpret the results of those techniques in realistic contexts, and 3. That students learn to communicate their findings in a realistic context. In order to align our teaching and our assessment tools with these objectives, then, we must have students explore problems that are typically ill-defined and are contextually rich. Such problems are distinct from the kinds of “word problems” present in most mathematics texts, which tend to present closed, template problems that are only superficially contextual. By way of illustration, we will contrast two problems and their solutions. Both problems are relatively elementary in their mathematical demands; indeed, they were selected for this apparent simplicity. One problem is drawn from a typical textbook designed for an undergraduate mathematics course for business students. The other is an example of a mathematical modeling problem drawn from our course. After comparing the two problems, we will discuss the features of the modeling problem that make it more appropriate for meeting the goals of courses like ours, and then illustrate how the more standard problem could be adapted to this modeling framework. We conclude with practical recommendations for teaching and assessing in a mathematical modeling framework.
TMME, vol7, no.1, p .119 These practical matters are important to consider, since the modeling framework often opens up multiple solution paths using many different approaches. Ensuring student learning with respect to one’s goals then requires slightly more consideration than the assessment of student learning in a mathematical procedures course. I. A TALE OF TWO PROBLEMS The problem shown in figure 1 is an example of a mathematical modeling problem that is closely aligned with the recommendations of AACSB (2006) and the MAA (Lamoureux, 2004). Notice that it is stated as a memo from a boss at a fictional consulting firm. This was done for a variety of reasons. For one, we found that we could not get the depth of reasoning we desired from our students using the standard textbook method of presenting problems. Good mathematical modeling requires that students explain their thinking and make explicit their assumptions and inferences. In order to do this, we had to form a realistic rhetorical context that provided an appropriate audience for communication. In this sense, we agree with the definition of a “mathematical problem” as presented in Falsetti and Rodriguez (2005) which focuses not only on the format of the problem and its difficulty, but also on the relationship between the statement of the problem and the problem solver. Roughly speaking, they claim that without a motivation to solve the problem, there is no problem to solve. Our memos present a realistic context for solving the problem. This involves the extrinsic motivation of trying to keep the boss happy as well as a more intrinsic motivation derived from the problem’s relation to the business world. This format also allows us to present a real world problem while still providing some initial filtering and scaffolding without setting up the model world for them. In contrast, the authors of most mathematics texts for business students begin in the model world and neglect or omit the transition from the real world to the model world needed to solve the problem, thus
Green & Emerson depriving students of the experience of having to make such a transition. Without experiences of this kind, there is no reason to expect students to be able to transfer their knowledge from one context to another.
Memo To:
Job Placement Staff
From:
Project Management Director
Date:
January 14, 2010
Re:
Placement of Managerial Clients
Since our company does management consulting, we have two middle-management clients who have come to us looking for new positions. Each of the clients is aware of and is qualified to work for each of the four large companies in the local region. I need you to analyze the four companies in the attached data file and make a recommendation to each client as to which company each would be better suited to. The data file contains a list of the management salaries at each of the four companies. There are about the same number of managers in each company with roughly the same ratios of middle- to upper managers in each. Each of our clients has just moved out of the lower 25% management salary rank in his or her previous position. They are, however, quite different. Manager A is a confident go-getter who enjoys leaving the competition behind. Manager B, on the other hand, prefers to run with the pack. He wants to do well, of course, but stability and security are important. To get started, you might consider generating comprehensive summary statistics and side-by-side box plots for these four companies. Based on what you learn from this information make a recommendation of a company for each client. Be sure to provide as much evidence as possible. Attachment: Excel data file “C04 Companies.xls”
Figure 1. An example of a mathematical modeling problem for business students. We devised the conventional mathematical problem shown in figure 2 based upon presentations of similar material in a variety of standard textbooks designed to support mathematics courses for undergraduate business students. This problem stands in stark contrast to the modeling problem (figure 1). We see that very little evidence is given in order to solve the modeling problem. There is mention of personality types and files listing salaries (the data file provided contains salaries for 100 employees at each of the four companies), but it is not clear
TMME, vol7, no.1, p .121 how this is sufficient to answer the question. The only clue given as to how to go about answering this question is provided in a suggestion about using boxplots; however, there is nothing to indicate how to interpret these so as to arrive at a final decision. The only aid students have for making such interpretations are some thumbnail psychological descriptors that must be translated into mathematical constructs. Furthermore, student assumptions about the time horizon play a critical role in balancing the different factors and arriving at a final decision. The memo clearly states that we are looking for an evidence-based decision, but the particular decision, the rationale for it, and the organization of the results are open-ended. We can also see that there is no generic procedure that will lead to a conclusion; if different descriptions of each manager were given or if the salary data were different, students would follow different solution paths. Once students have developed a solution to the memo, they could be encouraged to think more deeply about the problem and consider other factors or interpretations of the psychological factors. This could also offer students a chance to correct any mis-readings of the graphs or statistics, which in turn could influence their interpretations of the problem. Finally, the memo states that each of the managers is aware of these four companies, so that students will have to support their choice of one company over the others by making well-justified decisions, using mathematical tools to support their judgments. In contrast, the conventional problem (figure 2) provides a small sample of data, and except for the necessary formulas, everything needed to solve the problem is provided in the problem statement. These formulas would be found in the chapter in which this problem appears, although the problem statement clearly identifies which techniques to use and how to decide what the results of the calculations mean. During the solution of the conventional problem, students do not need to make any assumptions. Furthermore, unlike the memo problem, there is
Green & Emerson one set of mathematical procedures applicable to the problem and one way to interpret their results. In the solution, instructors would look only for the correct use of these two mathematical procedures. These procedures are also generic, in the sense that they could be used on any problem like this; although the results would change if the data were different, the process would be identical. Asking students to revise such work would result in correcting a calculation, but would not necessarily lead to any deeper understanding of the problem or the context. Finally, we see that the conventional problem expects nothing more than a set of calculations; the answers to each part of the problem are numbers, with one identified as being larger than the other. At no point are students required to re-contextualize these answers and make a judgment about the original question concerning the choice of an investment. Investment Analysis. Paul Hunt is considering two business ventures. The anticipated returns (in thousands of dollars) of each venture are described by the following probability distributions: Venture A Earnings -20 40 50
Probability 0.3 0.4 0.3
Venture B Earnings -15 30 40
Probability 0.2 0.5 0.3
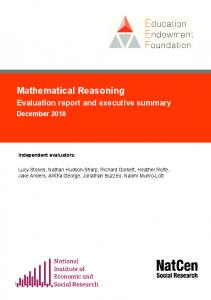
a. Compute the mean and variance for each venture. b. Which investment would provide Paul with the higher expected return (the greater mean)? c. In which investment would the element of risk be less (that is, which probability distribution has the smaller variance)? Figure 2. An example of a conventional mathematical problem for business students. II. SOLUTION AND ANALYSIS OF THE MODELING PROBLEM The memo clearly suggests that students look at the salary structures of the companies by way of side-by-side boxplots. The results of generating these boxplots from the salary data are given below (see Figure 3).
TMME, vol7, no.1, p .123
COMPANY IV
COMPANY III
COMPANY II
COMPANY I
0
40000
80000
120000
160000
200000
Figure 3. Salary structure of the four companies in the modeling problem. Now that we have these graphs, what can we do? Obviously, we need to separate the problem into a solution for each managerial candidate. In looking at the two managers, we see that we cannot jump to a final solution for each candidate without deeper analysis; we need to consider what each candidate likes about each company. For this, we will need to look at all the features of the boxplots, and then, finally, assemble some coherent picture of what each candidate likes and dislikes about each company in order to make a final judgment regarding the placement of each manager. We will start by analyzing candidate A. For this candidate, notice that the graphs indicate that each company has something to offer her. For this reason, we seek to find reasons to eliminate companies from the mix, rather than produce supportive arguments. We assume that a “confident go-getter” will like the highest maximum salary possible. This leaves manager A with either company I or IV. Because manager A “likes to leave the competition behind” we assume that she would prefer to be in a company where the salaries are spread out at her rank; thus, we look for a company with a wide range of salaries between the
Green & Emerson first quartile and the median, so that A can stand out from the other managers. We also make the assumption that one’s position within the salary structure, not one’s absolute salary, is directly related to one’s power in the company. Thus, although the salaries are quite different for a person in the middle of the second quarters at companies I and IV, a manager at this salary position would have the same responsibility at each company. A will reach $120,000 at the end of the 2nd quarter in IV, whereas she will reach less than $65,000 at the end of the 2nd quarter in I. We submit that A would prefer to make small increments on high salaries in the 3rd quarter at IV than large increments on much smaller salaries in the 3rd quarter of I. By the time A reaches the third quartile in each company, she will be making about $130,000 at either one, but she will have earned far more in IV during the 2nd and 3rd quarters combined than in I. Thus, we eliminate company I from consideration. Although company II has the highest entry salary for our manager (it has the highest first quartile) and its third quartile is higher than at companies I and IV, the fact that the maximum salary at company II is about $55,000 below the maximum salaries at I or IV would appear to be a strong negative for such a go-getter, and its short interquartile range does not provide much scope for her competitiveness. Taken together, we are left with either company III or company IV as recommendations for manager A. On the other hand, if we were to make a different assumption about manager A’s preferences (e.g., the short-term goals are more important than the long-term goals) then company II might become a more viable solution. Company III has a higher starting salary than company IV, which is in its favor. The spread of the second quarter also allows manager A an opportunity to distinguish herself. That III has a longer interquartile range (in fact, the longest of any of the companies) in conjunction with the fact that it is situated higher on the salary scale than is IV’s (both Q1 and Q3 of III are
TMME, vol7, no.1, p .125 respectively higher than Q1 and Q3 of IV) might lead one to conclude that A would earn more money over her entire career at III, even though III’s maximum is about $35,000 less than IV’s. However, it is not clear that such is the case. If we look at A’s position at the half-way point in the 2nd quarter of each of III and IV, we would see that A would actually make more money in company IV in this quarter, assuming that she moves at approximately the same rate throughout a quarter. When we regard A’s position at the half-way point in the 3rd quarter in each of III and IV, we see that although A would make more money in III it is not clear that the amount she would gain in this quarter would compensate for what she lost in the 2nd quarter. We judge, therefore, that in the light of this stand off, that the greater maximum in IV (about $35,000) has sufficient weight for us to recommend IV over III for A. Analyzing manager B involves slightly more interpretation from the real world to the model world. Manager B’s two preferences, running with the pack and stability, have direct implications for the boxplot characteristics he would prefer. We argue that running with the pack implies that B would prefer short quarters over longer ones and stability implies that B would prefer a company whose salary boxplot has the most symmetric quarters throughout. A short quarter means that salary differences between the managers within this quarter are relatively smaller than in longer quarters; that is, the salaries tend to cluster or pack together much closer, which is what we mean by running with the pack if you are a manager in this quarter. In contrast, the salaries in longer quarters are more disparate so that there is no pack to run with. In a boxplot whose quarters are about the same length, we can assume that the salaries tend to be distributed equally in each quarter with about the same increments. The path for advancement, then, progresses steadily and predictably throughout the company, which would signal stability for our manager B. That is, there are no sudden jumps or huge differences in
Green & Emerson salaries to upset B’s boat, as would be the case if there were a mix of short quarters and significantly larger ones as are present at companies I and IV.. Company II is the clear cut choice for B. It has relatively short, symmetric quarters, as well as the highest entry salary by far (B wants to do well). Furthermore, II’s relatively high third quartile (same as companies I and IV) would suggest that II would be very competitive for accumulating money throughout the 2nd and 3rd quarters combined. We see then that the modeling problem has many different aspects which fit into different areas of the taxonomy. Obviously, students must correctly construct the boxplots in order to begin the problem-solving process. This appears in the taxonomy under “Apply Procedural Knowledge.” The problem also requires factual knowledge, in that the students must be able to read the features of the boxplots, which falls under “Remember Factual Knowledge.” Students must also make comparisons throughout their analysis; this fits under “Understand Factual Knowledge”. But students must also differentiate between features of the plots that are important and those that are not; this higher level skill falls under “Analyze Factual Knowledge.” At an even higher level, students must make a judgment regarding the placement of each manager. Judgments fall under “Evaluate” in the taxonomy; these specific judgments relate to balancing out different features at each company based on the profile of each manager, so students must “Evaluate Conceptual Knowledge.” Students are also required to hypothesize about how the personality features play into the decision-making process; this appears in the taxonomy under “Create Conceptual Knowledge.” Finally, the students must explain their thinking process and clearly describe the assumptions, comparisons, and judgments being considered. This clearly falls under the metacognitive knowledge domain: “Understand Metacognitive Knowledge.”
TMME, vol7, no.1, p .127 Thus, in the modeling problem, students are dealing with almost all levels of the cognitive domain and every aspect of the knowledge domain. III. SOLUTION TO CONVENTIONAL PROBLEM In solving the conventional problem, we are first instructed to compute the mean and variance for each venture. To compute the mean of the investments, we simply multiply each expected return by its associated probability, then add these products. For venture A, we find the mean to be 0.3(-20) + 0.4(40) + 0.3(50) = -6 + 16 + 15 = 25. For venture B, we find the mean to be 0.2(-15) + 0.5(30) + 0.3(40) = -3 + 15 + 12 = 24. Computing the variance requires multiplying the squared deviation of each investment outcome from the mean by its associated probability and then summing these products. For venture A, we get a variance of 0.3(-20 – 25)^2 + 0.4(4025)^2 + 0.3(50-25)^2 = 885. For venture B, we get a variance of 0.2(-15 – 24)^2 + 0.5(30-24)^2 + 0.3(40-24)^2 = 339. We have now completed part (a) of the problem. Part (b) of the conventional problem asks which venture has the higher expected return. Since the expected return is estimated by the mean, we see that venture A has the higher mean and thus, the higher expected return (25 is greater than 24). The venture with the lower risk (part (c)) is that which has the lower variance, since it has the lesser spread from the mean, indicating less chance of returns that are extremely low. Thus, we see that venture B has the lower risk, and we have completed the solution of the stated problem using simple calculations and comparisons. Part of the simplicity of this problem derives from its form. In the framework presented by Falsetti and Rodriguez (2005), this problem is not a true problem. Rather, it has already been presented as an “associated mathematical problem” that is phrased verbally. This removes the need for making assumptions and generating hypotheses. In effect, this problem requires only that students implement particular mathematical procedures. The problem even provides the
Green & Emerson translation of these procedural results back into the real world with its parenthetical cues regarding the higher mean and smaller variance. The conventional problem stands in stark contrast to the modeling problem with regard to the taxonomy. The conventional problem clearly requires the application of procedural knowledge in the use of the formulas for the mean and the variance of the investments. The problem also asks for a simple comparison of the values, an instance of understanding factual knowledge. But this is all the problem requires. However, the modeling problem shows the depth of thinking possible with simple mathematical tools, in direct contrast to a procedural problem like the conventional one presented here. Thus, simple problems do not have to be confined to lower-level thinking or to single domains of exploration. It is these instances of higher order thinking using quantitative information that the MAA (Lamoureux, 2004) and the AACSB (2006) seem to be interested in developing in business students completing mathematics courses. IV. TRANSFORMING A CONVENTIONAL PROBLEM Clearly, the conventional problem begins with a realistic motivation – deciding between two different business ventures. But it never requires students to make a judgment supported by their computations. And, quite clearly, the content of the two problems is different. This choice was intentional, since it gives us an opportunity to compare the two approaches by transforming the conventional problem into a modeling problem. Fortunately, this problem can be made more realistic without much difficulty. To begin, the problem can be made to involve more than just computational procedures by requiring students to make and justify a decision: “Paul Hunt is considering two business ventures. Which should he choose?” This immediately opens up a variety of solutions, since students have to balance choosing between the venture with the higher expected return and the
TMME, vol7, no.1, p .129 venture with the lower risk. In justifying their decision, however, students will need to make and articulate assumptions about Paul Hunt’s investment goals. The instructor is then evaluating not just the computations the student completes, but the argument the student makes and the support provided in that argument. By eliminating the explicit references to means and variance, it then becomes the student’s task to determine which computational procedures will help compare the two investments. Students who only compute the expected returns could then be encouraged to think about risk upon revision, and students choosing other methods altogether (graphical methods, say) could be pointed toward the expected value and risk. Students using both tools in the computations, but failing to consider their implications could then be asked to revise their thinking. In all cases, the revision can both correct computational errors and direct students to deepen their thinking. Some mathematics professors might object to our transformed problem for at least two reasons. First, mathematics students should not have to know what constitutes good business risks (that’s the job of the business department, isn’t it?). Second, students are not directed toward a unique answer; the problem is ambiguous since we are looking for more than one thing, so how do students know where to begin? For these reasons, these professors may say that we have removed the problem from the domain of mathematics. Our response to the first objection is simply that this course is designed to help a certain group of students, namely business students, learn how mathematics is related to their intended discipline. In response to the second objection, we argue that students should have the opportunity to learn how and when to make assumptions in order to be able to make reasonable decisions under conditions of uncertainty. This is the critical ability they need in order to transfer what they have learned in this particular context to other problems. Rarely will they encounter a problem in the real world with an
Green & Emerson obvious statement about computing means and variances for a set of numbers, but they will often be required to make decisions among various options, each of which has its own benefits. In completing a problem such as the modified one above, students are practicing both their computational skills and their application of those skills. It is this type of knowledge that is most transferable, regardless of whether the student is majoring in mathematics business. The above problems illustrate, in part, the contrast between mathematical and mathematical modeling approaches to teaching undergraduate business students. We would like to use these examples as a springboard to compare, in more general terms, the two approaches. It seems to us that there are at least nine aspects that differentiate them. These can be divided into two broad areas: those that refer to the statement of the problem itself and those that relate to the solution of the problem. Relating to the statement of the problem, we can explore the nature of the evidence available, the connections to mathematical procedures, the types of assumptions needed, and the complexity of the problem. When examining the solution of the problem, we look at its uniqueness, how it is to be assessed, its robustness, the transferability of the techniques used, and its amenability to revision. We summarize our comparison of the two problems using these nine dimensions in figure 4.
TMME, vol7, no.1, p .131
Aspect Nature of evidence needed to solve the problem Connections to mathematical procedures Types of assumptions made
Complexity
Uniqueness Solution features being assessed Robustness of strategy for solving the problem Transferability Revision
Math modeling approach for preparing business students Insufficient, possibly contradictory evidence provided Unclear, not proscribed Required to bridge the real world and the model world, can’t make progress or a final decision without them Comes from the interaction between the mathematical world, the context/real world and the need to communicate the information More than one possible solution path, each may have a separate justifiable final decision Does the solution make sense? Are the steps justified and supported? Problem is sensitive to changes in the data or context, often resulting in a completely new problem strategy High for the general method of solving a problem, but not necessarily for specific solution techniques Allows for a deeper understanding of the context, deeper reflection, and learning to occur
Mathematical approach for preparing business students All “evidence” given in either the problem statement, that section of the book, previous math background, or teacher’s examples Almost directly given Only allowed to assert postulate or theorems (e.g. either bigger than 1, equal than 1) Comes from layering techniques on top of other techniques
mathematical a quantity is to 1, or less mathematical mathematical
One solution possible Were the mathematical techniques performed correctly? Problem is insensitive due to its templated nature Low, both on method and specified techniques because students didn’t have to make the connections Amounts to “correcting mistakes”
Figure 4. Comparison of mathematical and math modeling approaches. V. HOW DO WE ASSESS LEARNING IN MATHEMATICAL MODELING? Assessing such modeling assignments has required us to change the focus of our grading practices. In part, this was to give students credit for the kind of work they were doing, rather than only penalize them for not doing the work in a particular way. In part it was to provide additional feedback to encourage students to rethink the assignments and submit revised versions of their work. After several attempts to use more conventional methods for grading, we developed our own system. It is flexible and easily adapted to other assignments or courses. Most importantly, it directly links assignment feedback and grading to course objectives. The
Green & Emerson system, referred to as COGS (Categorical Objective Grading System), is explained in detail in Green and Emerson (2007). Broadly, though, we would like to see a student’s memo contain an introduction to the problem, an analysis of the situation that weaves judgment and reasoning together with mathematical statements and data analysis, and a concluding statement that reads something like “Assuming X and based on Y1, it seems that manager A would fit well at company Z; however, if Y2 were weighed more heavily, A might have a better fit at company IV.” In other words, the student should qualify each piece of the claim. Some people might say this is not the way a mathematics problem should conclude. We argue, however, that this is the kind of quantitative decision making, along with explicit discussions of assumptions and alternatives, that people are willing to pay good money for in our uncertain world. Further, this is exactly the sort of logic and thinking that is expected of mathematicians and statisticians. The difference between a really good and an adequate response to the modeling problem is that a merely adequate response assumes that the reader makes the same leaps of logic and assumptions as the writer, while a good response spells out, explicitly, the assumptions being made and how they help. For example, what does “stability” mean in this problem? Many students can interpret it to mean that a boxplot that is narrow and has equal-sized small quarter lengths is stable, but cannot or do not explain why without further prompting. VI. HOW DO YOU TEACH STUDENTS TO DO THIS? We hope to have shown in part that fairly high level mathematical modeling does not necessarily involve complex mathematics. In fact, we teach the mathematical procedures as needed, rather than teaching a fixed sequence of topics. Teaching for mathematical modeling then is not solely about having students reproduce complicated mathematical techniques, which
TMME, vol7, no.1, p .133 is the goal of many mathematics courses, even those designed explicitly to connect mathematics to a particular application area, such as business. The focus in teaching mathematical modeling must shift then from ingraining mathematical techniques in students to teaching students how to negotiate the transitions between the real world and the model world. This includes helping them learn to identify useful data to collect and proper tools for analyzing and interpreting that data. In the conventional problem, the teacher’s role is to teach students the analysis useful in the model world, and the transition from the real to the model world has taken place behind the scenes. In the modeling approach, the teacher’s role is to challenge students to make the transitions between the two worlds. This allows for revision of thinking and deeper learning, which results in a greater opportunity for transfer of knowledge. Indeed, it is these negotiations that Dias (2006) most descries the absence of, calling for more emphasis on the “validation phase” of the modeling process. She describes the distinct lack of this aspect of modeling in the work of a student who was motivated to find a solution to a real business problem. The student brought much prior knowledge and provided many connections to the real world initially, but failed to use this effectively once she had mathematized the problem and gotten an answer. It seems, then, that it is not very natural for students to worry about the validation phase or the cyclic nature of the process. And while there are many possible explanations for this – including the obvious critique that most of the time, it has not been needed in their mathematical courses, so they have no practice with it, nor do they see a need for it – what remains is a valid need for helping students advance their thinking, focusing on these transitions. The format of the modeling problems we have presented provides one way for instructors to bring this component of modeling into their teaching and assessing more explicitly.
Green & Emerson Another component useful for shifting the focus is found in technology. By letting technology take much of the burden of the mathematical procedures, students can focus their attention on the other aspects of modeling. This does not mean that you avoid teaching mathematical manipulations and calculations; it means teaching students to think effectively through the technological tools available. We provide in-class activities to help students learn to use spreadsheet technology as a tool through which to think. We also teach how the technology fulfills its supporting role in carrying out the mathematical procedures. This, in turn, helps them to understand the mathematical procedures themselves, but from a different perspective than is traditional. In addition, we spend class time in small group discussions on the differences between a perceived and actual problem, on the possible causes of a problem, on how data might help us to understand the problem and its causes, on asking questions to more deeply explore the problem situation, and on the data that might be collected and how it could be organized to promote certain types of analysis. This is the first step in modeling – making the transition from the real world problem situation to a model world. Explicit discussion and assessment of these aspects of modeling are required if students are to value them, so we have memo assignments that specifically target these components of the process. The memo problem format also helps students learn how to close the loop and attempt a genuine validation phase for their modeling also. Because each memo assignment requires that the response be readable by “the boss” students must include some sort of executive summary of their work. And because our evaluation of this work is formative, we provide feedback and encourage revision of the work. The feedback itself is often sufficient to point out gaps between the solution and the explanation or between the problem and its mathematization, but class discussions also follow each memo assignment. With our process of memos, feedback and
TMME, vol7, no.1, p .135 revision, a student with a solution like that in Dias (2006) would receive targeted feedback and questions encouraging deeper thought and re-thinking of the problem and the proposed solution so that the final version of the solution contained a deeper level of analysis. Teachers should expect that students will find this difficult. They are on unfamiliar ground. A central example we use to help students relates to age discrimination at a company. Students are presented with a memo from the CEO of the company that he has been hearing complaints that the company is unfriendly to older workers. As a result, it is believed that older workers are leaving the company in large numbers. Students then receive three responses from different managers describing how they would solve this problem. The responses are filled with unstated assumptions and hidden beliefs about the situation. Students work in small groups during class to analyze the responses and identify these assumptions and beliefs. Eventually, they discover that each of the managers is making a huge assumption: that a problem actually exists at the company. Students next work together to identify ways to collect data to determine whether there is a problem at the company and if so, the cause of the problem and steps to remediate the situation. This process deals with a critical concern of many instructors: teaching for transferability. We believe that the process of having students interrogate the problem situation to identify assumptions, possible causes, and useful data is what students can learn to transfer to other contexts. A fundamental component of this is that students must learn to make and refine their assumptions about the problem. This is a matter of teaching priority. Conventional mathematical problems focus primarily on model analysis with a minor emphasis placed on interpretation of the results. While differing from problem to problem, mathematical modeling problems taken as a whole place roughly equal emphasis on all three aspects of realistic problem solving:
Green & Emerson constructing the model world, analyzing the model world with mathematical tools, and interpreting the results of the analysis. Notice that when the emphasis is placed on the techniques and procedures of analyzing the model, as is the situation with conventional problems, students have little intrinsic motivation for doing the procedures correctly. However, when the interpretation and analysis of the problem, the really crucial aspects of problem solving, are dependent on the procedures, students are more invested in correctly selecting and implementing procedures appropriate to the problem and the data at hand. An example that further illustrates the nature of all three aspects of mathematical modeling relates to one of the later memos from our course where students are asked to investigate a company in order to determine whether there is evidence of gender discrimination. If there is, they are required to determine the extent of the problem. Students need to decide what data to collect and compare on each employee, how to code this data for analysis, and what kinds of variables (categorical, numerical, and/or interaction) to include in their models. Once they have collected and organized their data, they build and analyze models (typically multiple regression models) to determine which of their variables are significant, as well as determining the accuracy of the model in comparison to the predicted gender differences. After homework and classroom discussions about the process of collecting and organizing the data, we present the students with a common database of employee salaries to use in their analysis and reporting. Students can then construct their models to predict the salary of an employee, and implement their process of reducing the model by eliminating variables that are not significant. This refinement involves several iterations. Once a final model is constructed, students interpret the model and provide a judgment regarding the strength of the gender discrimination case against the company, based on their analysis. The data we provide, in particular, is very ambiguous
TMME, vol7, no.1, p .137 about the case, allowing students the freedom to emphasize different aspects of their models and the data in order to support their claims. We simulate this cyclic process with a similar problem on the final exam for the course. Students are provided with the context of the problem and the variables. They then receive output for three different multiple regression models using different combinations of variables and are asked to first explain how each model was produced and why, and then to select one model as the most useful or accurate with a detailed explanation. The last part of the problem requires them to use their selected “best model” to determine the likely outcome of the gender discrimination suit. By providing all the procedural components, students can focus entirely on the interpretation and validation aspects of modeling.
VII. CONCLUSION Teaching can, ultimately, be broken into three components. First, one sets instructional goals for learning. Then, one develops instructional activities to promote this learning. Finally, one must assess what the students have learned. Problems occur when these three components are out of alignment, as is the case in many mathematics courses for business students which use problems like the conventional problem discussed above. We have seen how the taxonomy introduced by Anderson and Krathwohl (2001) helps to place our instructional activities in order to provide the needed alignment. The general principle that we have presented here is that mathematical modeling problems promote a stronger alignment between the goals of a course compatible with MAA (Lamoureux, 2004) and AACSB (2006) expectations and the assessment of student learning in such courses.
Green & Emerson However, creating better prepared students requires more than just changing the types of problems to which they are exposed. Instructional design must also change to align with the goals and assessment tools. This involves, at the least, the following: 1. 2. 3. 4.
Incorporating technology to support the implementation of mathematical procedures, Having students articulate their assumptions and judgments through writing, Providing feedback so that students may re-think the problem and revise their work, and Providing classroom activities that support the learning and mimic the authentic problems being used.
One tool that we have found invaluable in implementing this change is the introduction of a memo as a way of providing a rhetorical context (Green & Emerson, 2008b). This gives students permission to make assumptions. In order to develop quantitatively literate students, the professed reason for putting business students through a mathematical experience, educators must give students this permission. In this way students practice and prepare for the real world, making judgments and selecting paths through a problem, using quantitative information to support their analysis. They are forced to make a choice among various possibilities and to justify their reasons for doing so. It is easy to see why mathematical modeling problems have not been more commonly used. Most teaching involves making some distinction between the subject matter being taught and everything that is outside of this. Teachers compartmentalize and focus in order to attempt to control for different background knowledge outside of the subject area. Mathematics teachers are no more guilty of this than any other teacher, but it is necessary to show students how to (and convince them that they can) connect the compartmentalized pieces of knowledge to the real world. Despite this necessity, in business mathematics we tend to see mostly mathematical, not mathematical modeling, problems used. Ultimately, the alignment of our teaching practices and our assessment tools with our curricular goals requires that we make such a change.
TMME, vol7, no.1, p .139
REFERENCES Anderson, L., & Krathwohl, D. (Eds). (2001) A taxonomy for learning, teaching and assessing: A revision of Bloom’s taxonomy of educational objectives (New York, Longman). Association to Advance Collegiate Schools of Business International. (2006). Eligibility procedures and accreditation standards for business accreditation. AACSB: Tampa, FL. Available online at http://www.aacsb.edu/accreditation/standards.asp Curriculum Renewal Across the First Two Years [CRAFTY]. (2004). Curriculum Foundations Project: Voices of the Partner Disciplines. Published by the Mathematical Association of America and available online at http://www.maa.org/cupm/crafty/welcome.html Dias, A. L. B. (2006). A student’s modeling of a business problem: a case representative of students’ struggle to see meaning in mathematics. Teaching Mathematics and Its Applications, 25(3), 105-108. Falsetti, M. & Rodriguez, M. (2005). A proposal for improving students’ mathematical attitude based on mathematical modeling. Teaching Mathematics and Its Applications, 24(1), 14-28. Witt, E. (ed). (2005). What the United States can learn from Singapore’s mathematics system (and what Singapore can learn from the United States): An exploratory study. Retrieved November 2, 2008 from ERICdocs database. Green, K. & Emerson, A. (2007). A new framework for grading. Assessment and Evaluation in Higher Education, 32(4), 495-511. Green, K. & Emerson, A. (2008a). Reorganizing freshman business mathematics I: background and philosophy. Teaching Mathematics and its Applications, 27(1): 11-23. Green, K. & Emerson, A. (2008b). Reorganizing freshman business mathematics II: authentic assessment in mathematics through professional memos. Teaching Mathematics and its Applications, 27(2): 66-80. Kulm, G. 1999. Evaluating Mathematics Textbooks. Basic Education, 43 (9). Lamoureux, C. (ed.) (2004). Business and management. Chapter 3 (pp. 19-25) in CRAFTY/CUPM Curriculum Foundations Project: Voices of the partner disciplines, Susan Gantner & William Barker (eds). Mathematical Association of America. Accessed online 23 January 2007 at: http://www.maa.org/cupm/crafty/welcome.html Steen, L. A. (2004). Achieving quantitative literacy: An urgent challenge for higher education. Mathematical Association of America: Washington, D.C.
Green & Emerson Tan, S. T. (2005). College Mathematics for the Managerial, Life and Social Sciences. Sixth edition. Belmont, CA: Brooks/Cole. Vincent, J. & Stacey, K. (2008). Do mathematics textbooks cultivate shallow teaching? Applying the TIMSS video study criteria to Australian eighth-grade mathematics textbooks. Mathematics Education Research Journal, 20(1): 82-107.