to distinguish Matricaria from other genera and separate M. perforata from other
...... British Isles, whereas the tetraploid was found in eastern and northern ...
BIOSYSTEMATICS AND LIFE HISTORY STRATEGIES OF SCENTLESS CHAMOMILE (Matricaria perforata Merat) IN CANADA
Submitted to the Faculty of Graduate Studies and Research in Partial Fulfillment of the Requirements for the Degree of Master of Science in the Department of Crop Science and Plant Ecology University of Saskatchewan
by Sheridan Lois Woo Saskatoon, Saskatchewan, Canada August 1989
The author claims copyright. Use shall not be made of the material contained herein without proper acknowledgement, as indicated on the following page.
In presenting this thesis in partial fulfillment of the requirements for a Postgraduate degree from the University of Saskatchewan, I agree that the Libraries of this University may make it freely available for inspection. I further agree that permission for copying of this thesis in any manner, in whole or in part, for scholarly purposes may be granted by the professor or professors who supervised my thesis work or, in their absence, by the Head of the Department or the Dean of the College in which my thesis work was done. It is understood that any copying or publication or use of this thesis or parts thereof for financial gain shall not be allowed without my written permission. It is also understood that due recognition shall be given to me and to the University of Saskatchewan in any scholarly use which may be made of any material in my thesis. Requests for permission to copy or to make other use of material in this thesis in whole or in part should be addressed to: Head of the Department of Crop Science and Plant Ecology University of Saskatchewan Saskatoon, Saskatchewan Canada S7N OWO
Abstract The objectives of this thesis were to investigate the M~!Kl£~£l~
biosystematics and life-history strategies of
perforata Merat in Canada, giving emphasis to the taxon from the Prairies. Literature on the nomenclature of the Matricaria genera was surveyed and reviewed.
Matricaria perforata Merat was
accepted as the name for the Canadian species under study. Other
M~!£l£~£l~
taxa were identified and the synonymy of
these species was summarized.
The taxonomic characters used
to distinguish Matricaria from other genera and separate
M.
perforata from other species were noted. Two cytotypes of Matricaria perforata were found among 23 seed sources collected throughout Canada. Eight Atlantic populations were diploid (2n=18) and 13 populations from the
Prairies and East-central Canada were tetraploid (2n=36). One population from St. John's Newfoundland had anomalous chromosome counts of 2n=27, 36 and 37.
In addition to the
documentation of the present distribution of
M.
perforata,
the extent of crossability was also investigated. Greenhouse
experiments
were
conducted
reproductive biology of 13 populations of
M.
breeding system was found to be allogamous. and
on
the
perforata.
The
Achene length
achene width were good taxonomic characters for
differentiating the two cytotype races; however,
the number
of achenes per capitulum and achene weight were not. Twenty three Canadian populations of
M~!Kl£~~i~
~erforata
were grown in a common garden to examine the
phenological and morphological populations
took a
differences.
shorter period of
Diploid
time to bolt and
f lower, and exhi bi ted I ess overwintering abi I i ty than the tetraploid populations.
Consequently, diploid plants were
predominantly annual and the tetraploid plants were biennial and perennial
in growth form.
Morphologically,
the
tetraploid plants were larger, more erect and more spreading in growth than the diploid plants. Life cycle effects on four populations were examined by monthly planting dates in the field.
Plantings from May to
late-July resulted in a lower percentage of plants bolting or flowering from each population.
Plantings to the field
after July did not flower, whereas plantings after September did not bolt or flower during the first growing season.
No
plants survived from the October planting date. A morphometric study was conducted on 14 populations of
M.
~~£f2£~!~
Manitoba.
collected in Alberta,
Multivariate analyses were
morphological determine
charact~rs
if
the
correlations
populations,
be
not
made
discriminating between
were
correlated
the
the
if
characters.
observed to
and
among
the
environmental
It was felt that these differences were not
taxonomically meaningful characters
were
differences
but
performed on 32
and 13 environmental characters to
sites
could
Morphological
characters.
Saskatchewan and
were
since
vegetative
and
variability associated with them.
the main discriminating had
a
large
amount
of
Acknowledgements I would like to express my sincere gratitude to my advisors - Dr. Gordon Thomas and Dr. Vernon Harms, for their excellent co-supervision of my thesis. encouragement,
Their continued
advice and endless patience during
the
research and the arduous writing process is greatly appreciated.
I would also like to thank Dr. Ross Ashford,
Dr. Malcolm Devine and Dr. Bryan Harvey for their support as members of my thesis advisory committee. Financial support was provided by the Hooke Research Account, plus the Rene Vandeveld,
L.H. Hantelman and
University of Saskatchewan graduate scholarships. grateful
I am
for the use of the facilities and land at the
Agriculture Canada, Regina Research Station, as well as the facilities at the University for the duration of this study. My appreciation is extended to the valuable technical assistance provided by Robin Wise, Faiz Ahmad, Carol Bubar, Don Harron, Cathy Harron and Bill Wallace. thank Dr.
I would like to
John Sheard for his advice and review of the
multivariate analyses.
I am indebted to the generosity of
Martin Reaney for the loan of his personal computer. The never-ending rallying by Peggy, Carol, the Steve's, Manjula, Li plus many others must be thanked, and recognized as being paramount adventure!
to making
A special
this
thanks
thesis a
goes
to
worthwhile
Rene
for
his
criticisms, humour, unlimited patience and support which made the achievement of this thesis possible.
i
TABLE OF CONTENTS
Acknow 1 edgemen ts.. . . . . . . . . . . . . . . . . . . . . . . . . . . . . . . . . . . . . . . . . . . . . . . . . . . .
i
Table of contents....................................................
ii
List of Tables..... . . . . . . . . . . . . . . . . . . . . . . . . . . . . . . . . . . . . . . . . . . . . . . . . . .
v
List of FiQ\lI'es........... . . . . . . . . . . . . . . . . . . . . . . . . . . . . . . . . . . . . . . . . . . .
vii
1.
General Introduction.............................................
1
2.
The Nomenclature and Ta.xonany of Matricaria perforata Merat. . . . . .
5
2 .1 •
Introduction. . . . . . . . . . . . . . . . . . . . . . . . . . . . . . . . . . . . . . . . . . . . . . .
5
2.2.
History of the nomenclature................................
6
2.3.
Nomenclature of the Matricaria species in canada. . . . . . . . . . .
10
2.3.1. Matricaria maritima ssp. maritima L.................
11
Matricaria mari tima ssp. phaeocephala (Rupr.) Ra.'lJSchert. . . . . . . . . . . . . . . . . . . . . . . . . . . . . . . . . . . . . . . . . . .
12
2.3.2.
2.3.3. Matricaria perforata Merat.
13
Distinguishing Matricaria fram similar taxa................
15
2.4.1. Matricaria versus Chamomilla...............
15
2.4.2. Matricaria versus other genera......................
17
The Canadian species of Matricaria..................
18
M. perforata.........
23
3.1.
Introduction..... . . . . . . . . . . . . . . . . . . . . . . . . . . . . . . . . . . . . . . . . . .
23
3.2.
Distribution of the M. perforata cytotypes.................
27
3.3.
Materials and methods................................. .....
29
2.4.
2.4.3.
3.
The Cytogenetics of the Chromoscme Ra.ces of
ii
4.
Chranosome
3.3.2.
Interpopulation crosses
CO\lIlts.
.................................
29
.
32
3.3.2.1.
Crossing technique
.
32
3.3.2.2.
Viability of hybrid seed
.
34
.
35
3.4.
Results
3.5.
Discussion
.
40
Breeding biology in the Canadian M. perforata conplex. . . . . . . . . . . .
47
4.1.
Introduction
.
47
4.2.
1'1clterials and methods
.
49
4.2.1.
Breeding system experiments
.
49
4.2.2.
Reproductive biology
.
52
.
52
.
52
.
54
DisC\1Ssion . ............................•...................
56
Phenological and Morphological Variation in canadian M. perforata
65
4.3.
4.4.
5.
3.3 .1.
5.1. 5.2.
5.3.
Resul ts
M.
4.3.1.
Breeding system of
4.3.2.
Reproductive biology
perforata
Introduction ~terials
.
aI1d methods
M.
perforata
65
.
69
.
69
5.2.1.
Growth stages in
5.2.2.
Common garden study
.
70
5.2.3.
Study of different planting dates ....•.............
75
5.2.4.
Statistical analyses
.
75
.
75
Resul ts
5.3.1.
Growth and development
.
75
5.3.2.
Common garden study
.
80
iii
(1985-1988)
5.3.2.1.
PhenolOQ'Y. . . . . . . . . . . . . . . . . . . . . . . . . . . . . . . .
80
5.3.2.2.
Morpl1.olOQ'Y................ . . . . . . . . . . . . . . .
94
Effects of different planting times (1986-1988)....
101
DisC'USsion....... . . . . . . . . . . . . . . . . . . . . . . . . . . . . . . . . . . . . . . . . . .
113
CaIDllon garden. . . . . . . . . . . . . . . . . . . . . . . . . . . . . . . . . . . . . .
113
5.4.1.1.
Phenol
N
83 Generally,
diploid populations grew phenologically faster
and had a shorter developmental period than the tetraploid populat ions,
when grown
(Figure 5.2b and 5.2c).
together
in
the
common garden
A proportion of some populations
did not mature to flowering within the first growing season and remained in a pre-flowering rosette form at the end of the observation period (Figure 5.2d). The number of days to bolting for populations in 1985 ranged
from
57.6 days
Dauphin (Table 5.3).
for
Parrsboro,
to
82.4
days
for
In 1986, the range in the number of
days to bolting was wider than observed in 1985, from 39.6 days (Cail's Mills) to 79.0 days (Riding Mountain, Table 5.4).
In 1987, the range in the number of days to bolting
was similar to 1985, 60.7 days for York to 84.8 days for Riding Mountain (Table 5.5).
Tetraploids took longer to
bolt than diploids in 1985 and 1986. of
tetraploid
versus
diploid
An orthogonal contrast cytotypes
was
significant (p < 0.001) for both of these years.
highly
A contrast
of the western tetraploid versus the central tetraploid populations was not significant
(p < 0.05)
in
the
1986
experiment, but in the 1987 experiment, a similar contrast between the western and central tetraploids was significant (p < 0.05).
The removal of the Riding Mountain population
from the western tetraploid group, however, resulted in a non-significant
difference
separated tetraploid groups.
between
the
geographically
A subsequent contrast of
Riding Mountain to the other 12 populations was highly significant (p < 0.001).
84 Table 5.3. Time to bolt and percentage of population bolting in 13 canadian populations of Matricaria perforata grown in a common garden, 1985 (plot I).
Population
Chromosome Number
1. Dauphin, Man. 2. St. John's, Nfld. (#1) 3. Beaverlodge, Alta. 4. Vegreville, Alta. 5. Balgonie, Sask. 6. Borden, P.E.I. 7. St. Andrews, N.B. 8. Louisbourg, N.S. 9. Gail's Mills, N.B. 10. St. Chrysostome, P.E.I. 11. Moncton, N.B. 12. Great Village, N.S. 13. Parrsboro, N.S.
36 27,36,37 36 36 36 18 18 18 18 18 18 18 18
Percentage No. Days of Popn. to Bolt Bolting (days ± s.d.) 82.4 ± 16.2 79.8 ± 14.6 78.5 ± 8.9 -75.2 ± 8.7 68.3 ± 6.7 64.1 ± 12.7 62.3 ± 10.9 61.3 ± 9.4 60.4 + 12.1 60.0 ± 8.2 60.0 ± 8.9 58.3 ± 7.4 57.6 ± 6.5
79 97 79 90 100 100
98 100
93 100 98 100
98
85 Table 5.4.
Time to bel t and percentage of population bel ting in 23 Canadian populations of Matricaria perforata grown in a canmon garden, 1986 (plot II).
Population
Chromosome Number
1. Riding Mountain, Man.
Vegreville, Alta. SUdbury, Ont. Bolton (eN), Onto Grand Valley, Ont. 6. Beaverlodge, Alta.
2. 3. 4. 5.
7. saskatoon, sask.
8. Paradise Hill, sask. 9. Kamsack, 8ask. 10. St. Ann's, Onto 11. Balgonie, 8ask. 12. Bolton (JK), Ont. 13. Dauphin, Man. 14. York, Onto 15. St. John's, Nfld. (#1) 16. Great Village, N.S. 17. St. Andrew's, N.B. 18. Borden, P.E.I. 19. St. Chrysostome, P.E.I. 20. Moncton, N.B. 21. Parrsboro, N.S. 22. Louisbourg, N.S. 23. Gail's Mills, N.B.
36 36 NA
36 36 36 35,36 36 36 36,37 36 36 36 36 27,36,37 18 18 18 18 18 18 18 18
No. Days to Bolt (days ± s.d.) 79.0 78.0 74.1 73.4 72.9 68.8
± ± ± ±
± ±
13.1 17.5 15.5 14.2 12.3 9.5 9.6 12.5
67.0
± ± ±
65.0 63.5 63.3 60.4 59.8 55.7 51.6 48.4 46.3 46.2 45.1 45.0 44.7 39.6
8.5 8.0 14.4 8.0 11.7 13.0 ± 14.4 ± 10.3 ± 8.9 ± 12.9 ± 6.4 ± 8.9 ± 7.0 ± 2.9
67.7
67.1
±
± ± ± ± ±
13.3
Percentage of Popn. Bolting 96 85 76 72 100 100 91 100 100 100 100 100 92 100 100 100 100 100 100 100 100 100 100
86
Table 5.5.
Time to bel t and percentage of population bel ting in 23 Canadian populations of Matricaria perforata grown in a cammon garden, 1987 (plot III).
Population
Chromosome Number
1. 2. 3. 4. 5. 6. 7. 8. 9. 10. 11. 12. 13.
Riding Mountain, Man. Sudbury, Onto Bolton (CN), Ont. Grand Valley, Ont. saskatoon, sask. St. John's, Nfld. (#1 ) Kamsack, sask. St. John's, Nfld. (#2) St. Angustin-deDesmaures, Que. Bolton (JK), Ont. Paradise Hill, sask. St. Ann's, Onto York, Ont.
No. Days to Bolt (mean ± s.d.)
Percentage of Popn. Bolting
NA
84.8 ± 15.0 77.8 ± 12.9 72.6 + 9.2 72.2 ± 6.3 67.9 ± 10.4 67.5 + 7.8 65.4 ± 8.7 64.9 ± 8.1
78 73 86 97 97 100 100 100
36 36 36 36 36
64.7 63.4 62.9 61.4 60.7
± 9.2 ± 8.6 ± 10.8
93 90 97 100 100
36
NA 36 36 36 27,36,37 36
±
±
10.4 9.0
87 For the 1986 and 1987 analyses, the chromosome count for Sudbury was hypothesized as tetraploid. was included with the central contrasts.
Therefore,
tetraploid group for
it the
The two St. John's populations (#1 and #2) were
not included in the contrasts because of the anomalous chromosome counts obtained or unavailable chromosome counts. In 1986, St. John's #1 was positioned intermediate to the two cytotype groups when the number of days to bolting were ranked in descending order. The
percentage
of plants within
populations
that
bolted ranged from 72 to 100% for all years (Tables 5.3, 5.4, 5.5).
There were no apparent differences between the
tetraploid and diploid populations.
The plants that did not
bolt remained in a pre-flowering rosette form throughout the season. In 1985, the length of time to flower ranged from 74.3 days in Parrsboro to 108.3 days in Dauphin (Table 5.6).
The
number of days to flower in 1986 ranged from 58.4 days in Cail's Mills to 103.3 days in Sudbury (Table 5.7).
In 1987,
the range in the time to flower was from 79.7 days in St. John's #2 to 102.3 days in Riding Mountain (Table 5.8). orthogonal populations
contrast was
between
highly
tetraploid
significant
experiments conducted in 1985 and 1986.
(p
and
An
diploid
< 0.001)
for
According to a
contrast, western versus central tetraploid populations were not significant in 1986, but highly significant (p < 0.001) in 1987.
Removal of the Riding Mountain population in the
latter experiment still resulted in significant differences
88 Table 5.6.
Time to f lower and percentage of population
flowering in 13 canadian populations of Matricaria perforata grown in a canmon garden, 1985 (plot I).
Population
Chromosome Number
1. Dauphin, Man.
2. 3. 4. 5. 6. 7. 8. 9. 10. 11. 12. 13.
Beaverlodge, Alta. Vegreville, Alta. St. John's, Nfld. (#1) Balgonie, Sask. Borden, P.E.I. St. Chrysostome, P.E.I. St. Andrew's, N.B. Louisbourg, N.S. Great Village, N.S. Moncton, N.B. Gail's Mills, N.B. Parrsboro, N.S.
36 36 36
27,36,37 36
18
18 18
18 18 18 18
18
Percentage No. Days of Popn. to Flow=r Flov..ering (days ± s.d. )
± 9.6 103.5 ± 7.7 101.4 ± 7.9
108.3
95.0 + 11.0 93.2 ± 8.5 89.5 + 14.2 82.7 + 10.7 81.3 + 12.0 79.1 + 10.4 77.2 + 10.4 76.8 ± 11.5 76.0 ± 14.4 74.3 + 9.3
40 69
82 85 100 98 100 95 100 100
100 95 93
89
Table 5.7.
Time to f lower and percentage of population flowering in 23 canadian populations of Matricaria perforata grown in a c~on garden, 1986 (plot II).
Population
Chromosome Number
No. Days to Flo~r (mean ±S.d.)
1. Sudbury, Ont.
NA
2. Riding Mountain, Man. 3. Vegreville, Alta. 4. Paradise "Hill, sask. 5. Grand Valley, Ont. 6. Bolton (CN), Ont. 7. saskatoon, Sask. 8. Beaver1odge, Alta. 9. St. ~l'S, Ont.
36 36 36 36 36 36 36 36 36 36 36 36 36 27,36,37 18 18
10. 11. 12. 13. 14. 15. 16. 17.
Kamsack, Sask.
Balgonie, Sask. Dauphin, Man. York, Ont. Bolton (JK), Onto St. John's, Nfld. (#1) Great Village, N.S. Moncton, N.B. 18. St. Andrew's, N.B. 19. Borden, P.E.I. 20. 21. 22. 23.
St. Chrysostome, P.E.I.
Louisbourg, N.S. Parrsboro, N.S. Gail's Mills, N.B.
18 18 18 18 18 18
103.3 ± 99.5 ± 98.5 ± 96.6 ± 96.3 ± 95.6 ± 94.5 ± 94.0 ± 93.0 ± 91.0 .± 90.4 ± 87.0 ± 86.8 ± 85.6 .± 75.8 ± 75.8 ± 68.4 ± 68.3 ± 68.3 ± 68.1 ± 64.3 ± 63.5 ± 58.4 +
15.0 9.8 9.3 9.1 8.7 12.2 9.5 11.1 9.2 12.6 9.3 6.0 12.2 15.6 16.6 15.8 9.2 12.8 10.5 12.7 7.4 10.6 9.1
Percentage of Popn. Flowering 76 91 74 100 96 64 91 100 100 100 100 89 95 100 100 100 100
100 97 96 100 97
100
90 Table 5.8.
Time to flOi'oler and percentage of population flowering in 23 Canadian populations of Matricar ia perforata grown in a canmon garden, 1987 (plot III).
Population
Chromosome Number
1. 2. 3. 4. 5. 6. 7. 8. 9. 10. 11.
Riding Mountain, Man. SUdbury, Ont. Kamsack, sask. Bolton (CN), Ont. Grand Valley, Ont. Paradise Hill, sask. St. John's, Nfld. (#1) saskatoon, sask. St. Ann's, Onto York, Onto St. Angustin-deDesmaures, Que. 12. Bolton (JK), Ont. 13. St. John's, Nfld. (#2)
36 NA 36 36 36 36 27,36,37 36 36 36 36 36 NA
Percentage No. Days of Popn. to Flower (mean ± s.d.) Flowering 102.3 ± 93.5 ± 91.3 ± 90.3 ± 88.8 ± 88.7 ± 87.9 ± 87.3 ± 84.7 ± 83.4 +
12.8 12.7 9.1 12.7 10.4 10.7 9.6 10.3 9.2 8.6
67 63 100 89 97 97 100 100 100 100
82.9 + 7.1 81.3 + 5.7 79.7 ± 5.4
90 93 100
91 (p < 0.05) between the two tetraploid groups. The tetraploid populations took a longer time to flower than the diploid populations.
St. John's was intermediate
to the tetraploid and diploid groups when the values were ranked
descending
order for the 1985 and 1986 .. The percentage of plants flowering within the
in
experiments.
populations ranged from 40 to 100% for all years (Tables 5.6,
5.7,
5.8).
There were no
differences
between
the
diploid and tetraploid populations for the percentage of the population that flowered.
Not all plants that had bolted in
a population also flowered. For all years, diploids had 0-27%, John's
#2
had
4%
tetraploids had 20-95% survival, St.
John's
survival
(#1)
had
(Table
26-66% and St.
5.9).
When
the
experiment initiated in 1985 was continued to a third season (to
1987)
the
Therefore,
survival
was
zero
for
all
in the subsequent experiments,
populations. the two year
growing period was determined as an adequate length of time to observe population survival. In the 1985-1987 experiment, the tetraploid populations and St.
John's had a higher percentage of second season
flowering (12 to 61%) than the diploid populations (0 to 13%, Table 5.10).
Balgonie had the lowest values among the
tetraploid populations with only 12% of its plants flowering in the second season.
was
15 to
78% flowering observed in the
populations, eight
In the 1986 to 1987 experiment there
21% in St. John's and
diploid
a
to 7%
14 tetraploid
flowering in the
populations during the second season.
92
Table 5.9.
Survival of populations of Matricaria perforata overwintering from the first growing season to the second growing season.
Population
Chromosome Number
Percentage Population Survival - - - - - - - - - - - - - - 1987-88 1986-87 1985-87
Western Region Balgonie, Sask. Beaverlodge , Alta. Dauphin, Man. Kamsack, Sask. Paradise Hill, Sask. Riding Mountain, Man. Saskatoon, Sask.
Vegreville, Alta.
36 36 36 36 36 36 36 36
20
20
95 79
44
67 41
58 91 87 89
53 70 82
73
82
Central Region Belton (CN), Ont. Bolton (JK), ant. Grand Valley, Ont. St. Angustin-deDesmaures, Que St. Arm's, Ont. SUdbury, Ont. York, ant.
36 36 36
92 48
78
36 36
56
NA
76
36
20
79 57 77
93 60 70 40
Atlantic Region Borden, P.E.I. Gail's Mills, N.B. Great Village, N.S. Louisbourg, N. S . Moncton, N.B. Parrsboro, N.S. St. Andrew's, N.B. St. Chrysostome, P.E.I. St. John's, Nfld. (#1) St. John's, Nfld. (#2)
18 18 18 18 18 18 18 18 27,36,37 NA
27 5 2
9 2
8 20
15
o o o o o o
0
5
66
26
60 4
93
Table 5.10.
Percentage of plants within populations of Matricaria perforata flowering during the second growing season.
Population
Chromosome Number
Percentage flowering year two - - - - - - - - - - - - - - 1985-87
1986-87
1987-88
Western Region Balgonie, sask. Beaverlodge, Alta. Dauphin, Man. Kamsack, sask. Paradise Hill, sask. Riding Mountain, Man. saskatoon, sask. Vegreville, Alta.
36 36 36 36 36 36 36 36
12 41 33
15 48 35 37 33
43
78 78 48
43
53 74 70
Central Region Bolton (CN), Ont. Bolton (JK), Ont. Grand Valley, Ont. St. Angustin-deDesmaures, Que St. Ann's, Ont. SUdbury, Ont. York, Ont.
36 36 36
38 67
68 40 63
56 71 19
63 53 60 40
64
36 36 NA
36
Atlantic Region Borden, P.E.I. Gail's Mills, N.B. Great Village, N.S. Louisbourg, N. S . Moncton, N.B. Parrsboro, N. S. St. Andrew's, N.B. St. Chrysostome, P.E.I. St. John's, Nfld. (#1) St. John's, Nfld. (#2)
18 18 18 18 18 18 18 18 27,36,37
NA
5 2 2
4 2 2
13 0
61
7
o o o o o o 4 21
47 4
94 Balgonie and York had the lowest values for the tetraploids (15%
and
19%
respectively).
For
1987
to
1988,
the
percentage of flowering in year two ranged from 40 to 74% in 11 tetraploid populations, 47% in St. John's #1 and 4% in St. John's #2. Within the tetraploid populations, perennial
growth
forms
the annual
were more predominant
biennial growth forms (Table 5.11).
in
1985-1986
populations,
the annual
(52%).
the
Dauphin exhibited the
highest number of biennial plants among the populations
than
and
Among
tetraploid
the
diploid
life cycle was the predominant
growth form observed (81-100%).
St. John's (#1) was more
similar to the tetraploid group in the percentage of growth forms that the population exhibited, whereas, st. John's (#2) was more similar to diploid populations, predominance of the annual growth form.
displaying a
Vegetative growth
forms were not prominant in either of the cytotypes or specific to any of the populations. 5.3.2.2.
Morphology
The height of the central or main stem of
M.
perforata
plants grown in 1985 ranged from 19.6 cm in Cail's Mills, to 48.8 cm in Beaverlodge (Table 5.12).
An orthogonal contrast
of the tetraploid Beaverlodge population versus the other nine populations was highly significant (p < 0.001).
A
contrast of Beaverlodge plus St. John's versus the eight diploid populations was also highly significant (p < 0.001). The height of the central stem of 23 populations in
95 Table 5.11.
Percentage of plants exhibiting each growth form within Canadian Matricaria perforata populations grCMn in a conunon garden study.
Years grCMn/percentage of growth forms Population A
Western Region Balgonie, 5ask. Beaverlodge, Alta. Dauphin, Man. Kamsack, sask. Paradise Hill, 5ask. Riding Mountain, Man. 5askatoon, 5ask. Vegreville, Alta.
1986-87
1985-87 B
81 0 6 25 22 52
11
10
P
19 66 19
74
V
0 3 7
5
Central Region Bolton (CN), Ont. Bolton (JK), Onto Grand Valley, On. St. Angustin-de Desma:ures, Que St. Ann's, Ont. Sudbury, Ont. York, Ont. Atlantic Region Borden, P.E.I. Cail's Mills, N.B. Great Village, N.S. Louisbourg, N. S . Moncton, N.B. Parrsboro, N.S. St. Andrew's, N.B. St. Chrysostome, P.E.I. St. John's, Nfld. (#1) St. John's, Nfld. (#2)
81 90 98 92 98 86 83 100 30
2
15
0 5 0 2 0 8 0 2 7 0 2 15 o 0 11 54
A
B
P
V
85
0
15
0
30 56 59
0 11 0
70 30
0 1
41
42
0
58 82 78 63
a a
9
9
13 19
9 11
2 63 33
20 68 0 37 4 63
40 19 76
24
2
89
5 0 0 0
100
100 100 100
7 0 0
100 92
5
79
97
a 60 a
57 19
o 7 a a o a a a a a a a a a a 4 a 21
0
0 7
8
a a a a 5
4
o a a a 7
a 4
a
96
Table 5.11
continued
Years grcwn/percentage of grcwth forms Population A
Western Region Balgonie, 5ask. Beaver1odge, Alta. Dauphin, Man. Kamsack, Sask. Paradise Hill, Sask. Riding Mountain, Man. Saskatoon, 5ask. Vegreville, Alta. Central Region Belton (CN), Ont. Belton (JK), Ont. Grand Valley, On. St. Angustin-deDesmaures, Que
St. Ann's, Ont. SUdbury, Ont. York, Ont.
1987-88 B P
V
46 30 10 27
0 0 22 0
54 67 57 73
0 1 11 0
0
21
11
68
43
7
50
0
23
4
73
0
o
0 0 30 0
97 67 37 40
3 0 6 0
40
0
60
0
96
0
4
0
33 27 60
Atlantic Region Borden, P.E.I. Gail's Mills, N.B. Great Village, N.S. Louisbourg, N. S.
Moncton, N.B. Parrsboro, N.S. St. Andrew's, N.B. St. Chrysostome, P.E.I. St. John's, Nfld. (#1) St. John's, Nfld. (#2)
A = Annual B = Biennial P = Perennial V = Vegetative form -- population not planted
97 Table 5.12.
Height of central stem and height range in canadian populations of Matricaria perforata grown in a ccmmon garden, 1985 (plot I).
Population
Chromosane Number
1. Beaverlodge, Alta. 2. St. John's, Nfld. (#1)
3. 4. 5. 6. 7. 8. 9. 10.
Great Village, N.S. Parrsboro, N.S. St. Andrew's, N.B. St. Chrysostome, P.E.I. Moncton, N.B. Borden, P.E.I. Louisbourg, N.S. Gail's Mills, N.S.
36 27,36,37 18 18 18 18 18 18 18 18
Height of Center Stem (em ± s.d.) 48.8 ± 5.3 39.8 + 6.4 23.4 ± 4.7 23.2 ± 4.6 22.7 ± 7.0 22.3 ± 3.7 22.1 ± 3.9 20.7 ± 4.2 19.9 ± 4.6 19.6 ± 3.9
Height Range (em)
40 33 16 15 12 15 15 14 15 14
-
56 54 35 33 36 28 31 28 33 29
98 1986 ranged from an overall plant height of 15 cm for the
Louisbourg population to 68.0 cm for Sudbury (Table 5.13). Plant growth of Louisbourg plants was prostrate and did not show
distinctive central or main stem development as in
other populations.
Therefore, only the overall plant height
or the maximum height above ground could be measured for this population, not the height of the central stem.
A
contrast of tetraploid versus diploid populations was highly significant (p < 0.001).
The height of the tetraploid group
ranged from 44.9 cm to 68.0 and the diploid group measured from 21.4 to 32.0 cm (excluding Louisbourg).
A contrast
between tetraploid populations in western and central Canada was not significant. St. John's measured 47.8 cm, and it was positioned near the bottom of the tetraploid group when all values were ranked in descending order. Central stem height of the 13 populations in 1987 was from 33.6 cm (St. John's #2) to 66.8 cm (Grand Valley, Table 5.14).
It was hypothesized that St. John's #2 was diploid
due to the smaller stature of plants in the population. When a contrast was conducted for St. John's #2 versus the other 12 populations (including Sudbury and St.
John's #1),
the results were highly significant (p < 0.001). The morpho 1 og i ca 1 longest
basal
populations.
shoot
charac ter was
not
0
f
the
measured
1 ength on
0
the
f
the 1985
Measurements on the 1986 populations indicated
that the shortest basal shoots were in Cail's Mills (36.7 cm) and the longest basal shoots were in Paradise Hill (87.9 cm, Table 5.15).
Contrasts of tetraploid versus diploid
99 Table 5.13.
Height of central stem and height range in canadian populations of Matricaria perforata grown in a common garden, 1986 (plot II).
Population [Code]
Chromosome Number
1. 2. 3. 4. 5. 6. 7. 8. 9. 10. 11. 12. 13. 14. 15. 16. 17. 18. 19. 20. 21. 22. 23.
Sudbury, Ont. [Sd] Paradise Hill, sask. [PH] saskatoon, sask. [S] Kamsack, sask. [K] Balgonie, sask. [B] St. Ann's, Onto [SAn] Grand Valley, Ont. [GV] Bolton (JK), Onto [BtJ] York, Ont. [Y] Vegreville, Alta. [V] Dauphin, Man. [D] Riding Mountain, Man. [D] Beaverlodge , Alta. [Bv] St. John's, Nfld #1 [SJ] Bolton (CN), Ont. [BtC] St. Chrysostome,P.E.I. [Se] Borden, P.E.I. [Be] Great Village, N.S. [G] St. Andrew's, N.B. [SA] Moncton, N.B. [M] Parrsboro, N.S. [P] Gail's Mills, N.B. [eM] Louisbourg, N.S. (L]
36 36 36 36 36 36 36 36 36 36 36 36 36 27,36,37 36 18 18 18 18 18 18 18 18
Height of Center Stem (em ± s.d.) 68.0 ± 12.0 67.6 + 6.7 65.9 ± 6.7 64.6 + 10.2 61.2 ± 11.1 61.2 ± 7.6 59.7 ± 7.1 58.8 ± 14.3 58.8 + 9.1 58.6 ± 5.5 55.4 + 9.3 54.5 ± 7.7 52.8 ± 6.3 47.8 ± 14.9 44.9 ± 8.2 32.0 + 8.5 31.4 ± 8.6 28.6 ± 6.9 28.1 ± 10.6 27.9 ± 8.0 26.0 ± 9.7 21.4 + 4.5 15.0 a
Height Range (em)
40 57 58 50
-
85 82 76 81
44 - 85
53 - 78 45 - 72 30 - 80 40 - 65
52 43 44 48 23 28 23 20
-
68 74 70 71 77 57 45 45
20 - 40
15 19 17 15
-
45 38 45 28
a Central stem growth was not distinct from the other branches and all plants for this population grew prostrate. The overall height of the plants above the ground was approximate1y 15.0 ems.
100 Table 5.14. Height of central stem and height range in Canadian populations of Matricaria perforata grown in a common garden, 1987 (plot III).
Population
Chrcmosome Number
Height Range (em)
Height of Central Stem (em±s.d.)
----------------------------------------------------------------1. 2. 3. 4. 5. 6. 7. 8. 9. 10. 11. 12. 13.
Grand Valley, Ont. Paradise Hill, 5ask. York, Ont. SUdbury, Ont. Saskatoon, Sask. Kamsack, sask. St. Angustin-de Desma.ures, Que. St. Ann's, Ont. St. Jom's, Nfld. (#1) Bolton (JK) , Ont. Riding Mountain, Man. Bolton (CN) , Ont. St. Jom's, Nfld. (#2)
36 36 36 NA
36 36 36 36 27,36,37 36 36 36 NA
66.8 ± 4.6 64.6 ± 9.1 64.4 ± 10.2 63.9 ± 9.5 63.7 ± 9.3 63.4 ± 12.9
60 50 52 50 51 38
-
78 85 98 77 89 94
60.3 ± 12.8 56.7 ± 6.9 53.4 ± 9.0 51.9 ± 7.5 49.5 ± 12.6 48.4 ± 6.9 33.6 ± 6.1
42 44 39 40 32 38 20
-
89 67 72 63 60 63 43
101 populations and western tetraploid versus central tetraploid populations were both highly significant (p < 0.001).
St.
John's #1 was positioned intermediate to the two cytotypes, when values were ranked
in descending order,
measurement of 55.6
± 15.5 cm.
contained
populations grown under
all
con di t ion s ,
i t
23
having a
Since the 1986 experiment
ex e mp I i fie s
be s t
the
identical
morpho log i c a I
differences between the populations and cytotypes (Figure 5.3) . In the 1987 experiment, the shortest basal shoot length was 33.8 cm in St. John's #2 and the longest basal shoot length was 85.4 cm in Saskatoon (Table 5.16). an orthogonal contrast, population
According to
the difference between St. John's #2
and the other 12 population for basal shoot
length was highly significant (p < 0.001). 5.3.3.
Effects of different planting times (1986-1988)
The percentage of plants within the population bolting ranged from 50 to 100% in the 1986-87 experiment for two transplant
dates
and
from
4
to
100%
in
the
1987-88
experiment for three transplant dates (Table 5.17a).
No
plants bolted for the August transplant date in 1986, but there was small percentage of plants that bolted in July 1987 for this third transplanting date (4-38%). Neither the 1986 or the 1987 experiment had plants that bolted from the fourth or fifth transplanting dates (September and October). Plants from the September transplant date survived the initial
growing
season
vegetatively
as
pre-flowering
102
Table 5.15.
Length of the longest basal shoot and length range in Canadian populations of Matricaria perforata grown in a canmon garden, 1986 (plot II).
Population [Code]
Chranosome Number
1. Paradise Hill, Sask. [PH] 2. Saskatoon, Sask. [S] 3. Sudbury, Ont. [Sd]
4. Beaverlodge, Alta. [Bv] 5. Vegreville, Alta. (V] 6. Kamsack, Sask. [K] 7. Balgonie, Sask. [B] 8. Dauphin, Man. [D] 9. Grand Valley, Ont. [GV] 10. St. Ann's, Ont. [SAn] 11. York, Ont. [Y] 12. Riding Mountain, Man. [RM] 13. Bolton (JK), Ont. [BtJ] 14. Bolton (CN), Ont. [BtC] 15. St. John's, Nfld. #1 [SJ] 16. St. Chrysostome, P.E.I. [SC] 17. Moncton, N.B. [M] 18. Borden. P.E.I. [Bo] 19. Louisbourg, N.S. [L] 20. Great Village, N.S. [G] 21. St. Andrew's, N.B. [SA] 22. Parrsboro, N.S. [P] 23. Gail's Mills, N.B. [eM]
36 36 NA 36 36 36 36 36 36 36 36 36 36 36 27,36,37
18 18 18
18 18
18 18 18
Length of Basal Shoot (em ± s.d.) 87.9 83.8 82.6
79.7
± ± ±
±
± 78.7 ±
78.9 78.3
74.2 74.1
7.7 11.0 19.2 5.1 11.7 12.2
± 9.0 ± 10.8 ± 8.5
± 8.6 ± 15.6 71.6 ± 14.3 69.0 ± 17.9 64.5 ± 14.4 55.6 ± 15.5 73.9 71.8
47.2± 46.5 ± 42.2 + 38.6 ± 38.6 ± 38.5 ± 36.8 ±
36.7
±
4.3 8.9
6.1 5.9 5.0 5.6 5.9 5.2
Length Range (em)
74 - 96 67 45 75 62 59 62 60 61 60 45 45
40 39 40 42 27 35 26 28 31 27 30
-100 -120 - 90 - 95 -100 - 97 - 90 - 90 - 85 - 90 - 95 -100 - 80 - 87 - 52 - 58 - 55 - 45 - 45 - 47 - 45 - 46
103
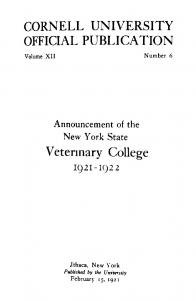
Figure 5.3.
Morphology of 23 Canadian Matricaria perforata
populations, tetraploid and diploid cytotypes: (a) mean height of central stem, (b) mean length of the longest basal shoot. Refer to Table 5.13 and 5.15 for population codes.
104
.SMGV.UYVO . . ..,
S~
etc
SC 80 GSA...
P
CW
L
(b)
--------------------------------r
.c) ......
-•u
eo 70
~
o o
.c
It
20 10
PH S
Set..,
V
I(
•
0
GV SM Y Rt.t 1It.J etc
1 .. ( - - - - - Tetraploid lestern Tetraploid
L
G
SA P
)fIE I t - - - Diploid Canadian seed source
n Central fetraplo id
Ld
SC ... 80
~ Atlantic
o
a.. ..
--oojI)f
St. John's
105 Table 5.16.
Length of the longest 'basal shoot and length range in Canadian populations of Matricaria perforata grown in a connnon garden, 1987 (plot III).
Population
Chromosome Number
1. saskatoon, sask. 2. Grand Valley, Ont. 3. St. Angustin-de DE=smaures, Que 4. Sudbury, Onto 5. Kamsack, sask. 6. Paradise Hill, sask. 7. York, Ont. 8. Riding Mountain, Man. 9. St. Ann's, Ont. 10. st. Johns's, Nfld. (#1) 11. Bolton (JK), Ont. 12. Bolton (CN), Onto 13. St. John's, Nfld. (#2)
Length of Basal Shoot
Length Range
(em±s.d.)
(em)
36 36
85.4 + 8.5 82.4 ± 11.8
72 -104 52 -100
36 36 36 36 36 36 36 27,36,37 36 36
77.5 77.5 72.8 70.8 66.4 63.5 63.3 62.7 60.6 58.9 33.8
+ 15.1 + 10.5 + 13.2 ± 12.5 + 9.7 ± 5.2 ± 9.7 ± 12.9 + 7.8 + 9.3 ± 4.2
50 - 96 64 - 96 48 - 90 55 - 92 48 - 83 58 - 70 46 - 79
NA
46 - 88
41 - 74 40 - 74 25 - 41
106 Table 5. 17.
Percentage of plants a) bol ting and b) f low=ring in four Canadian populations of Matricaria perforata planted at four different dates in the field during the first growing season.
Different Planting Times Population 1987-1988
1986-1987 Planting time a)
Sept
May June July
Sept
Percentage bolting
Balgonie, Sask. Bolton (JK), Onto Beaverlodge, Alta. St. John's, Nfld. (#1 )
b)
June July Aug
92 95 89 100
64 83 50 79
a a a a
a a a a
100 100 92 100
94 79 80 96
16 16 4 38
a a a a
100 100 90 100
21 50 20 71
a
a
81 74 85 96
0
a
100 100 96 100
a
0 0
a
a a
Percentage flowering
Balgonie, Sask. Bolton (JK), Onto Beaverlodge, Alta. St. John's, Nfld. (#1 )
a a
a
a
5
a
107 rosettes,
but they did not bolt.
Since plants from the
October transplant date did not survive longer than the initial season, this date was not considered any further for the experiment. In 1986, the number of days from germination to bolting for June ranged from 68.3 to 75.7 days and 71.1 to 82.8 days for July (Table 5.18a).
In comparison, populations in the
1987 experiment took less time to bolt, 59.3 to 66.0 days for May, 59.9 to 69.0 days for June and 63 to 73.1 days for July (Table 5.18b). The percentage of plants to flower from each population for the first transplant date was similar for both years, 100% in Balgonie, Bolton (JK) and St. John's #1, and 90 and 96% for Beaverlodge in 1986 and 1987 respectively (Table 5.17b).
In 1986,
the populations had a wider range of
values for percentage of plants flowering (20-71%) than the populations from 1987 (74-96%) for percentage of plants flowering from the second transplanting date.
Only St.
John's #1 had a single plant (5%) flowering for July in 1987.
Neither experiment had plants flowering from the
fourth transplant date. The number of days to flowering from germination in 1986 ranged from 88.5 to 99.4 days for June and 95.6 to 120 days for July dates (Table 5.19a).
The time to flower was
shorter for all populations in 1987, 80.8 to 88.7 days for May and
82.7
to
98.9
days
for June
(Table 5.19b).
St.
John's #1 was the only population to flower (a single plant) for the third transplanting date in 1987.
108 Table
5.18.
Number of days from germination to hoI ting in four canadian populations of Matricaria perforata planted at four different dates in the field, during the first growing season.
Population Planting time/month
a)
1986-1987
Balgonie, sask. 801 ton (JK), Ont. Beaverlodge , Alta. St. John's, Nfld. (#1)
b)
1987-1988
Balgonie, sask. 801 ton (JK), Ont. Beaverlodge , Alta. St. John's, Nfld. (#1)
Number of days to bolting
± s.d.
1
2
3
June
July
Aug
73.6 ± 9.1 68.3 + 7.8 75.7 ± 11.5 72.3 + 11.7
May
62.1 + 7.8 63.2 + 8.5 66.0 + 5.8 59.3 + 5.5
82.8
±
12.8
76.7 + 20.7 74.0 + 0.0 71.1
±
10.0
June
July·
63.4 + 8.7 68.7 ± 13.2 69.0 + 5.7 59.9 + 7.4
66.5 + 4.0 63.0 + 0.0 63.0 + 0.0 73.1
± 14.0
------------------------------------------------------------------
109 Table 5.19.
Number of days from germination to flcwering in four canadian populations of Matricaria perforata planted at four different dates in the field, during the first growing season.
Population
Number of days to flower
Planting time/month
a)
b)
1
2
3
June
July
Aug
- -
-
- - - -
98.4 88.5 99.4 91.5
+ + + +
1986-1987
Balgonie, 8ask. Bolton (JK) , Onto Beaverlodge, Alta. St. Jam's, Nfld. (#1 )
1987-1988
Balgonie, Sask. Bolton (JK), Ont. Beaverlodge, Al ta. St. John's, Nfld. (#1)
± s.d.
9.8 7.0 8.4 9.1
May
88.0 84.4 88.7 80.8
± ± ± ±
11.1 11.4 9.1 5.4
-
-
-
-
-
120.0 + 8.7 103.0 ± 17.0 117.5 ± 10.6 95.6 ± 14.2
June
94.2 ± 92.3 + 98.9 ± 82.7 +
16.2 9.4 9.8 14.2
July
90.0 + 0.0
110 In both years
of
the experiment,
for
the
first
transplant date, St. John's #1 showed the lowest survival (40 and 48%) and Beaverlodge showed the highest survival (95 and 96%, Table 5.20a).
The range of survival for the second
transplant date was from 75 to 100% in 1986 and 79 to 100% for 1987.
In both years, the third transplanting date had
100% survival in all populations except st. John's #1 in 1987 (91%).
In the fourth date,
the percentage of survival
was lower than the third date,
ranging from 60 to 93% in
1986 and 64 to 88% in 1987. The percentage of plants flowering from the populations in the second year followed a similar trend in both 1986 and 1987 (Table 5.20b).
The widest range in values was recorded
in the first transplant date (40 to 96%),
whereas the third
transplant date had the narrowest range and the highest percentage of
second season
flowering
(86
to
100%).
Flowering in the fourth date was similar to that observed for the first date. Annual,
biennial
and
perennial
growth
forms
were
exhibited by all populations for both experiments (Table 5.21).
For the first transplanting date,
growth forms were the annual and perennial.
the prevalent Beaverlodge
exhibited biennial forms for this planting date in both years (11 and 4%) and a smaller percentage of annual forms (5 and 4%) than the other populations.
st. John's #1 was
the only population to exhibit a vegetative form for the first transplant date (6%). The plant growth forms from the second planting date
111 Table 5.20.
Percentage of a) survival and b) flcwering in four canadian populations of Matricaria perforata planted at four different dates in the field during the second growing season. Different Planting Times 1986-1987
1987-1988
Population Jun Jul
a)
Sept
May
Jun
Jul
Sept
56 88 96 48
100 89 100 79
100 100 100 91
88 64 64 83
48 80 96 40
94 89 100 79
100 100 100 86
88 44 64 83
Percentage of survival in second year
Balgonie, Sask. Belton (JK), Ont. Beaverlodge, Alta. St. John's, Nfld. (#1 )
b)
Aug
63 58 95 40
93 75 100 86
100 100 100 100
88 60 93 93
Percentage of flowering in second year
Balgonie, Sask. Bolton (JK), Onto
Beaverlodge, Alta. St. John's, Nfld. (#1)
63 47 68 40
93 67 100 86
100 100 92 100
65 50 74 79
112 Table 5. 21.
Percentage of growth forms in four Canadian populations of Matricaria perforata planted at four different times in the field, over a two year period.
Percentage of growth forms ------- - - - - - - - 1987-1988 1986-1987
Population Planting time Month '86/'87
A
B
P
V
A
B
P
V
-----------------------------------------------------------------Balgonie,
sask. 1. June/May 2. July/June 3. Aug/July 4. Sept/Sept
0 79 o 100 0 69
67 14 0 0
0 0 0 31
48 0
33
7
0 19 o 100 0 88
52 81 0 0
12
0 0
a
Bolton (JK) , Ont. 1. 2. 3. 4.
June/May July/June Aug/July Sept/Sept
42 25
0 42 o 100 0 74
58 25 0 0
0 8 0 26
12 11
0 26 o 100 0 44
88 63 0 0
0 0 0 56
1. June/May 2. July/June 3. Aug/July 4. Sept/Sept
5 0 0
11 80 92 74
84 20 0 0
0
4
92 85 0 0
a 0 0 36
0 29 o 100 0 79
44 57
6
0 0
0 21
48 75 0 0
0 0 9 17
Beaverlodge, Alta.
0
0
8 26
4 0 15 o 100 0 64
St. John's, Nfld. (#1) 1. 2. 3. 4.
June/May July/June Aug/July Sept/Sept
50 14
0
52 21 5 0
0
4 86 83
-----------------------------------------------------------------A
= Annual
B = Biennial P = Perennial V = Vegetative form
113 were
predominantly
biennial
populations in both years.
and
perennial
for
all
Bolton (JK) and St. John's #1
exhibited the highest number of annual growth forms for this planting date (25 and 11%, 14 and 21% respectively).
No
vegetative forms were recorded for any of the populations. For both experiments,
the biennial was the predominant
growth form observed in the four populations for the third transplanting date.
Exceptions were Beaverlodge in 1986
which had 8% vegetative forms and St.
John's #1 in 1987
which had 5% annual and 9% vegetative forms for the third transplanting date.
Neither the third or the fourth
transplanting dates developed perennial plants in either year of the experiment.
In the fourth transplanting date,
there were 44-88% biennial growth forms and an increased number of vegetative growth forms (5-56%) exhibited by all populations, for both years. 5.4.
Discussion
5.4.1. 5.4.1.1.
Common garden Phenology
Phenological differences were observed between the two Canadian Matricaria perforata cytotypes in the common garden study. Under the growing conditions at Regina, tetraploid populations took more time to bolt and flower than diploid populations
in all
conclusions (1969)
years.
This is contrary to Kay's
that tetraploid plants grew faster than
diploid plants under identical British Isles.
field conditions in the
A previous study by Kay
(1965)
found
114 variation in time to flowering among 14 diploid populations (from
110
to
135
days
after
germination)
which
was
attributed to differing agricultural practices and field conditions.
M.
Roberts and Feast (1974) reported
2~~fQ~~!~
plants took about 50 days to flower from the
time of emergence in the field. Feast
(1974)
that British
utilized
the
Presumably, Roberts and
diploid
cytotype
since
this
appears to be the predominant cytotype in the British Isles, and there has only been one tetraploid plant discovered in, the British Isles (Kay 1969).
If in the present study, the
period from emergence to flowering was calculated as the time from germination to flowering minus seven days (the approximate number of days from germination to emergence in the field),
then the diploids would take a minimum of 51
days to a maximum of 82 days to flower.
This period of time
to flowering was intermediate to observations made by Kay (1965) and Roberts and Feast (1974). The tetraploid cytotypes took 15 to 23 days longer to bolt and 22 to 27 days longer to flower than the diploid cytotypes in the Regina common garden.
The percentage of
plants that bolted and flowered within diploid populations was slightly higher than in the tetraploid populations. all
plants that bolted also
flowered.
Not
The tetraploid
populations that did not bolt and flower remained in a pre flowering rosette form throughout the growing season. Tetraploids from Central Canada did not differ in the length of time to bolting or flowering from the Western Canada tetraploids. The diploid populations formed a closely
115
associated group that were readily separated from the above tetraploid group in respect to their phenology. The values for St.
John's (#1) were not specific to
either of the two cytotype groups for f lower.
Therefore,
grouping.
time to bolt and
it was considered as a
separate
The values for time to bolting and flowering
from the St. John's (#1) population were dispersed among the values for the tetraploid group,
or intermediate to the
values for both cytotype groups when ranked in descending order.
The values for the St. John's #2 population were
intermixed with the tetraploid populations for bolting and had the shortest time to flower among these same populations (1987-88 experiment only).
The St. John's #2 values were
not comparable to St. John's #1 values for either phenology character. The phenological variation between the two St. John's populations may be due to intermixed cytotypes in the seed sources. Seed from St. John's #1 contained both tetraploid and triploid chromosome counts (see section 2).
Kay (1969)
indicated that no natural triploid populations have been reported.
Since
the
triploid hybrids
are
sterile
(see
section 3), a mixture of tetraploids, diploids and triploids would be expected in the field.
Therefore, it is possible
that a mixture of seed, predominantly diploid, with some triploid and tetraploid seed, is present in St. John's #2 source. Then,
if the St. John's #1 seed is predominantly
tetraploid, with some triploid and diploid seed, differences
116 in development may be anticipated between these two seed
sources. Overwintering ability from the first growing season to the second season was greater in tetraploid populations (20 95%) than in diploid populations (O to 27%). ability of St. populations, diploid
Overwintering
John's #1 was similar to the tetraploid
whereas
St.
populations.
John's Kay
#2
was
(1965)
found
overwintering ability in two of fifteen i!!QgQ~~!!! (= M~.!~i£~~i~ I2~~f2.£~.!~)
common garden.
similar 10
to
the
and
20%
TriEl~grQ~£~~~Qffi
pop u I at ions p I ant e din a
Kay (1965) suggested that the overwintering
ability of the two annual
T.
i!!QgQ£~!!!
populations from
Northern Scotland was altered by introgression with 1. ~h~~Q£~~h~l~!!!
(=M·
!!!~£ili!!!~
var.
~h~~Q£~~h~l~),
the
perennial circumpolar species.
In later investigations, Kay
(1972)
diploid
found
~erforata
that
different
populations
of
M.
grown in a common garden had no overwintering
ability. Roberts and Feast (1974) found that M·
I2~~fQ~~.!~
(probably diploid)
level
had none
to
a
moderate
overwintering ability, which increased with in the summer.
of
later plantings
Both cytotypes were planted at the same time
in the present study.
Therefore,
under
the Prairie
conditions, the differences in overwintering ability were presumably due to genetic differences between the cytotypes. Pre-flowering rosettes and plants that had bolted but not flowered during the first season were forms that readily overwintered.
The survival of such overwintering vegetative
forms was documented by
Roberts and Feast
(1974)
with
117
!~i~1~~2~~~~ill~ill ill~~i!iill~ill ssp. ~~rfo~~ta),
!~£!2K~ill
Canadian
ill2g2~~ill (=M~!~i£~~i~
by Darwent and McKenzie
and by Klebesadel (1969) on
M.
(1978)
with
£~~£is
!hl~E~i ~KY~n~~.
In
perforata, the majority of overwintering plants
had developed a post-flowering rosette or several short, compact axillary shoots at the base of the plant in the previous
fall.
Plants were
noted as
hemicryptophytes
(Raunkiaer 1934) since re-growth in the following spring was initiated from lower branches,
near the caudex region.
The higher percentage of overwintering ability among tetraploid populations in comparison to diploid populations was reflected in higher percentage of second season flowering.
The result was a
lower percentage of annual
growth forms and a greater percentage of more persistent biennial and perennial growth forms (Balgonie and York were the exceptions).
Not all tetraploid plants that survived to
the second growing season also flowered. Therefore, a high number of biennial or semelparous perennial (Silvertown 1984) forms were recorded as plants that flowered during the initial year and remained vegetative during the second year as latent perennials. Among diploid populations,
the annual growth form was
dominant and the biennial form was virtually non-existent under the Prairie growing conditions. Generally, St. John's #1 was similar to the tetraploids (annual, perennial),
biennial and
whereas St. John's #2 was annual in growth form
like the diploid populations.
118 Plants that flowered during the second growing season were more robust, prolific, took less time to mature and exhibited less phenological variation than plants from the initial
year,
both within
populations
and between
cytotypes. During the first growing season, most plants initiated flowering by mid- to late-August and the time range from the first to the last plant to begin flowering within populations was wide.
All plants that flowered
during the second growing season started flowering early, by mid-July,
and the range from the first to the last plant to
begin flowering within populations was narrow.
Roberts and
Feast (1972) observed similar trends in the development of o v e rw in t ere d p I an t s
0
f 1:. in2.f!Q!:J:!ill
(= M. 12~!:fQ!:~.:t~),
as did
Darwent and McKenzie (1978) with the overwintered plants of Crepis tectorum. Kay
(1969,
1972)
indicated
that
the
diploid
M.
perforata is normally an annual plant, although late summer and autumn germinating plants may overwinter (Kay 1965). Nehou (1954),
as well as Roberts and Feast (1974), reported
that the species is annual or biennial depending on the time of germination during the season.
Lovkvist (1962) provided
the only report on the tetraploid cytotype and he indicated that this weedy type was an annual. studies,
Lovkvist noted that the coastal
Contrary to other
M.
perforata was a
perennial, but his description could easily be mistaken for the perennial
M.
maritimum, which is also 2n=18, instead of
the annual diploid
M.
perforata.
Although results from the
present study indicated that tetraploid populations were
119
more persistent than diploid populations, both cytotypes were capab 1 e perennials.
of being annua I,
biennia 1
This range in growth forms is documented in the
literature on the weedy Canadian 1982, 1984, 1985; 5.4.1.2.
or short-l i ved
M.
~rforata
(Anonymous
Frankton and Mulligan 1974).
Morphology
For all years,
tetraploid plants grew morphologically
larger than the diploid plants in the Regina common garden. Central stem height of the tetraploid plants was 1.4 to 4.5 times that of diploid plants. The central stem height was exceeded by the length of the basal shoots for plants of both cytotypes.
The basal shoots of tetraploid populations
were ascending and 1.4 to 2.4 times longer than those of diploid populations, which were spreading to decumbent.
The
larger stature of tetraploid plants over their diploid counterparts has been noted for several polyploid species (Stebbins 1950).
Kay (1965,
1969) indicated that tetraploid
plants of Tripleurospermum inodorum
(=M.
perforata) grew to
a larger size and were more erect than diploid plants which were diffuse and spreading in growth habit.
Diploid
populations had a primary stem (=central stem) that exceeded the length of the longest basal axillary stems and formed an angle less than 90 degrees between the two branches (Kay 1972) . Tetraploid plants in the present study had a marked development of an erect central stem.
The development of
the central stem in the diploid plants was prominent to non
120
existent and the growth habit was erect, angled to semi prostrate,
or completely prostrate.
The morphological
variability of the plants was maintained within populations and between cytotypes for each year of the common garden study.
Kay (1972)
~~fQ~!~
M.
found that some populations of
maintained their growth habit from the field to
the common garden, whereas other populations changed from erect growth to prostrate growth in the common garden. Nehou (1954)
found that with higher nutrient
increased clay content of the soil,
level
and
the morphology of
M.
maritima was altered from prostrate and diminutive to large, erect and spreading. Variation in erectness and bushiness were also influenced by timing of planting.
Roberts and
Feast (1974) reported that basal shoot growth occurred early in
the
season and
diminished
with
later
plantings.
Therefore, later emerging plants may appear more erect in growth. In the 1986-1987 experiment, the western tetraploids and central
tetraploids were comparable with regard to
central stem height, but the western populations had longer basal shoots than the central populations Riding Mountain were the exceptions). 1988 experiment,
(Sudbury and
However, in the 1987
the western and central tetraploid groups
were not readily separable for either central stem or basal shoot
length.
Therefore,
the general morphology of
the
geographically separated tetraploid populations was similar. Diploid populations
(excluding Louisbourg) were comparable
121 in size to each other.
St. John's #1 was intermediate to
the two cytotype groups in stature, whereas St. John's #2 was equivalent to the stature of the diploid populations. The distinct morphology of each cytotype was only maintained in the initial year of growth.
The second year's
growth of both cytotypes (the majority were tetraploid) was more robust and vegetative, appearing bushy and globose due to extensive development of axillary branches and a prominent central stem.
lack of
The small percentage of plants
which remained in a pre-flowering rosette form during the first season may not have achieved an adequate size for maturing,
thus
following year
prolonged
further
development
(Kachi and Hirose 1983;
for
the
Reinartz 1984).
If
the nutrient level or age of the plant limited first season maturity, then a similar trend would be expected for
all
plants of a population. The differences in population growth and development between years may be attributed to fluctuation in yearly climatic
conditions
at
the
Regina
site.
Monthly
precipitation in May 1986 exceeded that of May 1985 by 56.6 mm and that of May 1987 by 64.4 mm.
Overall, the phenology
and morphology of populations grown in 1986 and 1987 were similar, but the phenological stages of populations grown in 1985
took
longer
and
these
populations
were
also
morphologically smaller than populations from the other years.
Since field transplants of seedlings were made in
late May to early June, after the excessive precipitation in May,
this seasona 1 rainfa 11 was probab 1 y not a
factor
122
influencing the yearly differences in plant growth. Another deviation in monthly precipitation was noted for
July,
with
1985
having
68.0
and
67.6
precipitation than 1986 and 1987 respectively.
mm
less
The length
of time to bolt and flower in 1985 was 1.1 to 1.3 times longer than in the other years.
Plants in 1985 were 1.1 to
1.2 times smaller in stature than the plants from the 1986
and 1987 experiments.
Therefore, the July precipitation may
have influenced yearly differences in phenology and morphology among the populations.
The timing of mid-summer
precipitation may be especially important to the
late
flowering pattern of Matricaria perforata in the field.
There was no yearly difference in the number of days to bolting among the populations or among the planting dates (which bolting occurs).
However, in 1986, bolting was only
observed with the first and second transplanting dates (June and July), whereas in 1987, bolting was observed with the
123
first, second and third transplanting dates (May, June and July).
The 1987 experiment was initiated one week earlier
in the field and this timing may account for the observed phenological differences between the two years. McKenzie (1978)
Darwent and
found that the date of planting had no
effect on the number of days to bolt in
Q~i2
transplanted to the field in two week intervals.
tectorum With the
present experiments, the percentage of plants per population that bolted declined with later planting dates and plants transplanted later than July overwintered in a pre-flowering rosette form. that
A British study of five mayweed species found
TrlEl~2spermum
inodorum
(=M.
perforata) seedlings
emerging after the beginning or middle of August did not bolt, but remained vegetative, overwintered and flowered in the following year (Roberts and Feast 1974).
Studies on
other taxa found that plantings made in mid-July or later developed as winter annuals, whereas the earlier plantings developed as summer annuals, bolting and flowering in the first season (Klebesadel 1969;
Darwent and McKenzie 1978).
An increase in the number of days to flowering was observed with the later planting dates and differences were noted among the four populations grown at Regina.
Roberts
and Feast (1974) found that plantings from January to the end of May resulted in a linear decrease in the number of days from emergence to anthesis.
However, delayed plantings
of T. inodorum to the beginning of August, in the British Isles, increased the number of days to flower, a trend that
124
is similar to observations from the present study.
to these results,
Keeley et al.
decreased day lengths,
ie.
Contrary
(1987) observed that
later in the season, reduced the
time to flower in Amaranthus
~lmeri.
The percentage of flowering plants within populations decreased with later planting dates. bolted also flowered.
Not all plants that
Darwent and McKenzie (1978) reported
that plants from the July transplant date developed as summer annuals that either bolted, flowered and set seed during the first season, or not set seed, rosette form.
bolted and flowered, but did
or did not bolt and remained ina basal In 1986, the July transplant date acted as a
similar pivot for the development of summer annual versus more persistent forms,
exhibiting plants with the three
growth forms described by Darwent and McKenzie
(1978).
Darwent and McKenzie (1978) do not report any perennial plant
forms;
however,
without
carry-over of
experiment to a second growing season,
their
potential perennial
plants would only be perceived as summer annuals during the first year of the study.
In 1987, a pivotal date for the
short term versus the long term plant forms would occur intermediate to the June transplanting date,
when most
plants flowered and set seed, and the July planting date, in which only one population flowered. In both experiments, overwintering ability increased with later transplanting dates, peaked to 100% survival with the third transplanting date and then declined with later transplanting
dates
under
the
Prairie
conditions.
125
Transplants in late September and October did not survive to the following year.
The influence of planting date on
winter survival of Crepis tectorum showed a similar pattern to that observed with
M~.!ri£~ri~ 12ITfo~ta
(Darwent and
McKenzie 1978). The growth forms of
M~tri£ari~ ~rforata
varied with
the different planting dates and populations, as well as between the two years of the study. the
influence of
planting date
Many other studies on on plant
growth and
development have only differentiated two growth forms:
a
summer annual that flowers and sets seed in the year of initiation and a winter annual that germinates late in the season,
overwinters as a rosette and then flowers early in
the following year (Klebesadel 1969; 1974;
Darwent
and
McKenzie
1978).
Roberts and Feast The percentage of
Matricaria perforata plants exhibiting each growth form was related to the extent of phenological development during the initial growing season.
The first planting date (June 3,
1986 and May 26, 1987) produced summer annual plants that flowered and became senescent in the first year,
or
perennial plants that flowered in both the first and second year before becoming senescent.
There were few biennial
plants from the first planting date.
Latent perennials were
plants that had flowered in year one, overwintered and grown vegetatively in year two before senescing. The second planting date (July 2,
1986 and June 24,
1987) showed the widest range of growth forms due to the
126 varying stages of development during the first season (as indicated. above).
Growth forms included:
summer annuals;
biennials that grew vegetatively in year one and flowered in year two; and perennials that flowered in both year one and year two or flowered in year one and remained vegetative in year two.
In all populations, the biennial growth form was
more prevalent in the 1986-87 experiment than in the 1987-88 experiments, which exhibited more perennial growth forms. This variation in growth forms between the two years is not surprising since this second transplanting date appears to be a pivotal date influencing the development of the plant growth forms.
Only a few weeks difference in planting time
appears to determine if a plant develops as a biennial or perennial, i.e. flower for the first or second time in the following season. For both the first and second transplanting dates, all growth forms exhibited by than
those of
Beaverlodge were more persistent
the other populations
(e.g.
biennial
or
perennial) and exhibited a higher percentage of survival to the second growing season.
Geographically, this seed source
was collected from a higher latitude than any of the other Canadian locations. perforata,
This population of the introduced
originally from Europe,
M.
may have undergone some
climatic adaptations to the Beaverlodge location where it
has been naturalized.
The influence of latitude on plant
phenology has been investigated in numerous biosystematic and ecological studies.
The findings often indicate that
biennials and longer-lived individuals predominate at the
127
northern end of their latitudinal gradient, whereas annuals predominate at their southern end (Reinartz 1984; al.1985;
Weaver et
Lacey 1988).
Plants from the third planting date (August 5, 1986 and July 29,
1987) developed consistently as biennials for all
populations.
This growth form would be equivalent to the
winter annual described by other authors (Klebesadel Roberts and Feast 1974;
Darwent and McKenzie 1978).
1969; St.
John's was the only population to exhibit annual forms that had flowered (5%} during the initial season of the 1987 experiment from this planting date. No perennials were recorded in either the third and the fourth planting date (September 4, 1987),
1986 and September I,
since no flowering occurred in the first growing
season.
Consequently,
either the biennial growth form was
predominant for plants which survived to the second season to flower,
or the vegetative growth was present for plants
that remained vegetative for the first and/or second season before senescence. were
All plants from the fifth planting date
pre-flowering
rosettes
in year
one and had an
overwintering mortality of 100%. The highest percentage of flowering and seed set was observed with the first planting date which had perennial plants producing seed over a two year period.
The lowest
productivity, for all populations, was observed with the \
fourth
planting date which showed the
least number of
flowering plants over the two year period.
From an
128
agronomic perspective,
this implies that spring control of
scentless chamomile is necessary to prevent seed set in summer
annual
plants
perennial plants.
and
to
prevent
establishment
The earliest planting date chosen in
these experiments can be considered as a since under normal 12~!:f.Q!:at~
time
of
late planting,
field conditions on the Prairies
M.
would no longer be in the seedl ing stage at this
(June 3,
1986 and
May 26,
Prairie agricultural environment,
However,
1987).
in the
these planting dates may
be equivalent to the emergence time of new weed seedlings, after cultivation and crop-seeding.
Early tillage may
present a problem if patches of the weed are found ringing low-lying areas that are normally wet in the spring, or if the crop is fall-seeded and cannot be cultivated early in the spring.
If
these early germinated plants are not
controlled, anticipated problems include crop competition and prolific seed set which will result in a greater weed problem the following spring. Later germinated plants, after mid-July, can be controlled with
fall tillage and seed set
will be minimized since the percentage of flowering plants is small during the initial growing season.
Cultivation at
this time will also prevent establishment of biennial forms. 5.5.
Summary M~!!:i£~~ia 12~rf2~~!~
biennial,
perennial and vegetative plant.
stages in development were: rosette,
was recorded as an annual,
bolting plant,
Notable growth
the seedling, pre-flowering
flowering plant and either the
129
dormant overwintering plant or senescent plant. Twenty-three Canadian populations of
M.
perforata were
found to differ in phenology and morphology based on their cytotype
when
grown
in
a
common
garden
at
Regina.
Tetraploid populations took a longer period of time to bolt .. and flower than did diploid populations. The overwintering ability of tetraploid populations was higher than that of the diploid populations.
Consequently, a higher percentage
of persistent growth forms,
biennial and perennial were
recorded for the tetraploid plants,
whereas the annual was
the predominant growth form for the diploid plants grown under the Prairie conditions. The general morphology of the tetraploid plants was larger, erect and more spreading than that of the diploid plants.
Measurements for central stem height and basal
shoot length of the tetraploid populations were greater than that of the diploid populations. Two population sources from St. John's were found to differ from the two cytotype groups.
The values for time to
bolt and flower, as well as the growth forms exhibited by St. John's #1 were either intermixed with the values for the tetraploid group, groups.
or
intermediate
to
the
two
cytotype
The central stem height and basal shoot length of
St. John's #1 were intermediate in size to the diploid and tetraploid populations.
St. John's #2 differed from St.
John's #1 in phenology and morphology by having values more similar to the diploid populations. Different planting dates effected the percentage of
130
plants that bolted or flowered from each population, but did not inf I uence the actual number of days to bol t or f lower. Plants from May to late-July transplanting dates bolted, but only those plants in the field by the beginning of July also flow~red
during the first growing season.
Transplants to
the field after September did not bolt or flower, remained in a pre-flowering rosette form.
but
There was no
survival of plants from the October planting date. The percentage of survival to, and the percentage of f lowering in,
the second growing season increased wi th
transplanting dates after May, peaked with the late-July transplanting
date
and
then
declined
with
subsequent
plantings in the Regina common garden. Growth forms from the first planting date (late-May, early-June) were either annual, season, forms
or perennial, from
the
flowering only in the first
flowering for two seasons.
late-June
biennial and perennial.
planting
period
were
Plant mainly
The biennial plant developed as a
pre-flowering rosette during the initial season and flowered in the following season.
This growth form was prevalent
from the late July planting date.
The majority of growth
forms from the early-September plantings were biennial, with the remainder of
the
forms being vegetative and never
flowering during their life cycle.
131 6.
M0 r ph 0 log i c a I
va ria t ion
0
f
M.
I2~ r
f .Q.!5!!~
fro m the
Prairie Provinces 6.1.
Introduction Baker
(1965,
1974)
indicated that some important
attributes of an "ideal" weed were to either have different genotypes or
to be phenotypically plastic.
Genetic
diversity enables environmental adaptation and subsequent local
race or
context,
ecotype formation.
In the agricultural
adaptive changes could occur through interactions
with crops and other weeds in the Intraspecific
variability
of
field
life
(Harper 1965).
form,
reproductive
strategy and phenology often create problems in the identification of weedy taxa due to taxonomic-nomenclatorial
confusion and the possible differential response of biotypes and/or ecotypes to control measures (McNeill variability
is
a
possible
result
of
1976). the
Since
constant
introduction and spread of alien plants throughout North America,
intraspecific diversity should be considered prior
to establishment of control practices (McNeill 1976;
Mack
1985, 1986). Some researchers have recognized the variability which exists within weedy taxa and the subsequent consequences this has on control practices. Hodgson
(1963)
found
that
there
A preliminary study by was
morphological
and
phenological variation among populations of Cirsium arvense (L.) Scop. and he speculated that this contributed to the differential
herbicide
responses
observed
by previous
132 res ear c her s .
B 0 ugh e t a 1.
biotypes of PanicYill colour,
illilia~ym
growth form,
shattering abi 1 i ty.
(1 9 8 6) L.
phenology,
ide n t i fie d s eve r a 1
that differed in seed inflorescence form and
These biotypes were also observed to
have different responses to herbicide control. M~tri~~ia £~~forat~
has become a weed of increasing
economic importance in the agricultural land of the Prairie
M.
perforata
dates to 1905 in the black and gray soil zones.
A survey
region.
In Saskatchewan the earliest record of
conducted
by Douglas
(1989)
of
farmers
in
this
region
indicated that in the period prior to 1918 there were only two sightings of the weed.
During the period from 1959 to
1968 there were 77 sightings and during the period from 1969 to 1978 there were 209 sightings.
Between 1979 and 1988 the
number of sighting increased dramatically to 665.
It can be
assumed that a similar trend has been occurring in adjacent provinces that have problems with this weed. issued a warning about the spread of Peace
River
controlled,
region
of
Alberta,
M.
Lobay (1964)
~~fQr~ta
saying
that
in the if
not
the weed would "take the country by storm."
Saskatchewan,
scentless chamomile was
legislated as
In a
noxious weed in 1977 (Anonymous 1977). Ell is and Kay (1975a, herbicide responses among in Britain and France.
1975b,
M.
1975b) found different
perforata populations collected
They speculated that there was
genotypic variation in physiological characters effecting the selection for herbicide resistance. another Matricaria species,
In a study of
Popova and Peneva (1987) found
133
tha t
there were morpho 1 og i ca 1
M.
cytotypes of
~~£u!i!~
di f ferences
and that
between
two
these differences
corresponded to growth conditions of wild and introduced populations.
As indicated in Section 5,
morphological and
phenological differences have been found between the two cytotypes of Canadian
M.
perforata.
The tetraploid cytotype
was found as a weed of agricultural land and the most common habitats occupied were roadsides and railways, farmyards and occasionally cropped land (Kessler,
Thomas and Bowes 1988).
Multivariate analysis is the branch of mathematics that deals
with
the
simultaneously,
examination
of
numerous
variables
permitting the analysis of large data sets
and the summarization of the data to reveal the structure of the relationships (Gauch 1985).
Frequently, multivariate
statistical techniques are used in taxonomic studies to determine relationships among taxa (Harris 1975; Everitt 1982;
Digby and Kempton 1987;
Dunn and
Popova and Peneva
1987) .
In a taxonomic study, plants are collected from various locations and morphological characters are measured from these field specimens and/or from common garden transplants to determine taxonomic groupings (Warwick and McNeill 1982; Anderson and Taylor 1983; Ringius and Chmielewski 1987).
Morrison and Weston 1984; Uniform growing cond.i tions
of collected plant material may be preferred for study of genotypic variation,
thus eliminating the site-imposed
plasticity (McCarty 1985;
Weaver et al. 1985;
Warwick and
134 Black 1986). morphological and
Correlations can also be made between and phenological
environmental
factors
characters wi th ecological
from
the
collection
sites.
Preliminary analysis using principal components analysis will often indicate morphologically distinct groupings, then canonical can be applied
correlation or canonical to determine site
1984;
Weaver, Dirks and Warwick 1985;
1986;
Ringius and Chmielewski 1987).
In
theory,
numerical
variates anal ysis
relationships
groupings (Warwick and McNeill 1982;
and
of
the
Morrison and Weston
taxonomists
Warwick and Black
make
comparisons
between as many characters from the operational taxonomic units (OTU's) as possible for an objective interpretation (Sakal and Sneath 1963).
Multivariate methods have been
used extensively in studies of community ecology to obtain an understanding of the spatial distribution of individuals in their habi tat (Crovello 1970; Johnston 1972;
Gauch 1982;
Digby and Kempton 1987).
Goodall 1970;
Pielou 1984;
Gould and
Austin 1985;
Taxonomy is interested in the
ordering of organisms into discrete groups (Dunn and Everitt 1982).
Measurements
relationship,
of
OTU
similarity
-
resemblance or affinity of
the
phenetic
OTU's
to
one
another; or dissimilarity (distance) - differences, are used in the classification process. Two methods of multivariate analysis can be employed: (1) Cluster analysis leads to an explicit separation of OTU's into groups, Everitt 1982).
thus producing a classification (Dunn and
These clustering techniques either arrange
135
the OTU's into hierarchical groupings (agglomerative or divisive methods) or nonhierarchical groupings. are frequently displayed visually in a
The results
treelike structure
known as a dendrogram that indicates the relationships among the groups (Sokal and Sneath 1963; Gauch 1982).
Sneath and Sokal 1973;
(2) Ordination is a technique which arranges
the OTU's in reduced multidimensional space in such a way that a two-dimensional projection will reveal any apparent intrinsic pattern (Pielou 1984).
The hypothesis is that the
pattern of the OTU groupings have a relationship to the underlying environmental factors or taxonomic groupings (Austin 1985; Digby and Kempton 1987).
Visual display of
the groupings are in the form of two-dimensional scatter diagrams projected along axes extracted by the analysis. Ordination
techniques
were
more
applicable
to
the
present study because the purpose was to summarize the morphological
data,
determine
if
there
were
apparent
groupings among collection sites and determine if there were relationships to the environmental factors.
Principal
components analysis (PCA) and canonical correlation analysis (eCA) methods were selected. involves
the
projection
multidimensional space.
Principal of
component analysis
correlated
OTU's
in
Orthogonal axes are placed in this
space and rotated about the origin until the first principal component accounts for the maximum amount of variation in the OTU pattern, thus minimizing the sum of squares of the distance between the OTU's and the axis (Dunn and Everitt
136
1982;
Pielou 1984).
Subsequently, the second principal
component will account for the second highest variation, the third component will account for the next highest variation, etcetera.
By
relationships
comparisons with between
the
OTU's
the
original
and
the
data set,
environmental
factors can be determined. Canonical
correlation analysis
employs two data
matrices, for example, one of plant morphological characters and a second of site or environmental factors.
Correlations
are made within each matrix and between the matrices in order
to
summar i ze
and
c I ar i fy
the
na ture
f
the
relationships between the two data sets (Gittins 1985).
The
0
method of determination is similar to peA, entailing the rotation of coordinate axes; however, obtained by the use of
the desired result is
covariance between matrices
addition to variance within each matrix.
in
The important
assumption with either of these ordination techniques is that the grouping patterns and the relationships inferred, i.e. between morphological and environmental characters,
is
biologically meaningful. Due to the variety of habitats occupied and the wide geographical
range of
M.
2~~f2~~1~
across
the Prairie
provinces of Alberta, Saskatchewan and Manitoba, it could be speculated that genotypic differentiation might have occured since the time of introduction.
Based on the assumption
that a uniform genotype was introduced from Europe,
the
objectives of this study were to use multivariate techniques to determine
if
there
were:
1)
any morphological
137
differences among populations of
M.
2~~f2~~!~
throughout the three Prairie provinces, and
collected
correlations
2)
between the morphological characters and environmental factors,
i.e. a climatic gradient.
Materials and methods
6.2. 6.2.1.
Collection sites and specimens
In the summer 2~rf2ra!~
of
1986,
M~!!.l£~~l§!.
30 specimens of
were sampled from each of 10 Alberta sites, 11
Saskatchewan sites and five Manitoba sites (Table 6.1).
M.
Locations of the
£~~fo~~!~
infestations visited and
sampled were determined from studies of herbarium specimens (see section 3.2.
for
listing),
Thomas
(unpublished
records), and communication with agricultural personnel, researchers and farmers throughout the Prairie region. Seven plant characteristics were measured at
each
collection site (Table 6.2., Part I) and five soil samples were obtained per site, analysis.
from a 15 em core,
for
later
Entire plants, or portions of the plants, were
collected and pressed for additional measurements at a later date. During the collecting trip, 70 locations of were observed.
Plants from
similar in appearance,
the
26
sites
M.
perforata
sampled were
with none of the plants from the
sites being morphologically distinct from plants of the
other
si tes.
Therefore,
fourteen
si tes
were
random 1 y
subsampled from representative regions across the range of Prairie sites
for a morphometric analysis
(Table 6.1,
138
Table 6.1.
Site
Collection sites of M. perforata populations in Alberta, saskatchewan and Manitoba.
Town/province
Geographic Co-ordinates
F..abitat
Kandahar, sask. Kandahar, sask. Ridgedale, sask. Codette, 5ask. Nipawin, 5ask. Beaver Plains, sask. Wroxton, sask. Dauphin ,Man. Erickson, Man. St. Pierre, Man. Ladyw:>od, Man. Wirmipeg Beach, Man. Whitewood, Sask. St. Walburg, sask. Marshall, sask. Viking, Alta. Viking, Alta. Leduc, Alta. Leduc, Al ta. Bezanson, Al ta. Bezanson, Alta. Hythe, Alta. Beaverlodge, Alta. Keephills, Alta. Mundare, Alta. Edenw::>ld, 5ask.
510 46'N 51°46' N 530 04'N 53°17' N 53 0 22'N 51 046'N 51 0 14'N 51°09' N 50 0 30'N 490 26'N 500 12'N 500 31'N 500 20'N 53°39' N 53°11 'N 53 0 13'N 530 06'N 53 0 16'N 530 16'N 55°14 'N 550 14'N 55 0 20'N 550 13'N 53°24 'N 530 36'N 50 0 38'N
farmyard canola ditch flax field peas wheat wheat mixed forage seed alfalfa alfalfa mixed forage mustard wheat wheat canola causeway pasture alfalfa/brome canola wheat canola pasture wheat waste I arrl wheat wheat
Number
* *
2 4 7 9
*13 *18 19 *22 *24 28 *29 32 39 *41 45 49 *51 *54 55 58 *59 60 *63 *67 69 *70
*
1040 21'W 104 0 21'W 1040 09'W 104°02 'w 104000'W 101 048'W 1010 53'W 100°03 'w 99 055'W 9s059'W 960 30'W 960 58'W 1020 15'W 109°12 'w 109 047'W 111 043'W 1110 46'W 113 033'W 113~3'W
118°22 'w 11S022'W 11g033'W 1190 26'W 114 0 25'W 1120 20'W 104 0 15'W
sites used for morphological measuranents
139
Table 6.2.
Morphological characters measured on plant specimens and the character states from 14 collection sites.
---------------------------------------------------------------------Character Code
I.
Character Description/unit of measurement
From field collected specimens
1.
Height
2.
Basal
3.
Growth
4.
Phen
5.
Dens
6.
Antho
7.
Bush
Height of central stem (em) Length of the longest l:asal shoot (em) Growth habit/degree of erectness: (1) prostrate, (2) semi-prostrate, (3) semi-spreading, (4) spreading, (5) spreading to erect, (6) erect Plant phenology: (1) early flOlJering, (2) early to mid-flowering, (3) mid-flowering, (4) mid to late flOlJering, (5) late-flowering, (6) late-f lowering to flower ing with seed set, (7) flowering with seed set Densi ty /abmdance of plants aro1.ID.d collected specimen: (1) rare or solitary, (2) few, (3) numerous to 5% cover, (4) 5 to 25% cover, (5) 25 to 50% cover, (6) 50 to 75% cover, (7) >75% cover Amount of anthocyanin present: (1) none, (2) at base of plant only, (3) slightly red 1:ase to middle, (4) red streaks throughout plant, (5) stem and branches red Degree of bushiness/branching: (1) not bushy, (2) branching at top, (3) branching from top to center, (4) few basal branches, (5) extensive basal branching
II. From pressed specimens - 10 plants per site A.
8. 9.
10. 11. 12. 13. 14. 15. 16. 17. 18. 19. 20. 21. 22.
Peduncle measurements (mm) fran the base of terminal capitula on the: Pedal Peda3 Pedbl Pedb2 Pedb3 Pedcl Pedc2 Pedc3 Peddl Pedd2 Pedd3 Pede1 Pede2 Pede3 Pedfl
Central stem to the 1st branch axil Central stem to the 1st bract 1st branch to central stem 1st branch to the 1st branching 1st branch to the bract 2nd branch to central stem 2nd branch to the 1st branching 2nd branch to the bract 3rd branch to central stem 3rd branch to the 1st branching 3rd branch to the bract 4th branch to central stem 4th branch to the 1st branching 4th branch to the bract 5th branch to central stem
140
Table 6.2
23. 24.
B.
Variable Code
Variable Description/unit of measurement
Pedf2 Pedf3
5th branch to the 1st branching 5th branch to the bract
calculated measurements fran the branches (mm)
25.
Peda4
26. 27. 28. 29. 30.
Pedb4 Pedc4 Pedd4 Pede4 Pedf4
C. 31. 32. 33. 34. D.
E.
Distance stem Distance Distance Distance Distance Distance
between bract and branch axi 1 on the centra 1 between beb-een between between betw=en
bract bract bract bract bract
and and and and and
central central central central central
stem stan stem stan stan
on on on on on
1st 2nd 3rd 4th 5th
branch branch branch branch branch
Length of Internodes (mm) Inter1 Inter2 Inter3 Inter4
Between Between Between Between
1st 2nd 3rd 4th
and 2nd branches and 3rd branches and 4th branches and 5th branches
Gapi tula 3 terminal capitula per plant
35. Colour 36. -Rayno 37. Recpsh 38. 39.
continued
Rece};M Recepl
Phyllary colour (MUnsell colour chart) NUmber of ray florets Receptacle shape: (1) flat, (2) rounded, (3) hemispheric, (4) globose, (5) conical, (6) acute Receptacle width (mm) Receptacle height (mm)
Disk florets - three measuranents per capitula
40. 41.
Collar Gland
42.
GIang
43.
Diskl
Collar width (ocular scale converted to rom) Oil gland shape: (1) round, 1 x 1 dimensions, (2) roundish, 1 x 1.25, (3) rounded, 1 x 1.5, (4) oval, 1 x 1.75, (5) oval, elongated 1 x 2, (6) narrowly oval, (7) other shapes, not rounded . Oil gland angle: (1) horizontal - 180 , (2) inward left 45 and right 315 , (3) vertical - 90 , (4) outward - left 315 right 45, (5) one solid gland 180 Corolla length (ocular scale converted to nun)
Table 6.2
44. 45. 46. F.
Variable Code
Variable Description/unit of measurement
Diskw Lobe Anther
Corolla width (ocular scale converted to mm) Depth of corolla lobe (ocular scale converted to mm) Anther length (ocular scale converted to mm)
Ray florets - five measurements per capitula
47. 48. 49.
Rayl Rayw
50. 51. 52. 53.
Lobel Lobec Lober Lobex
G. 54. 55. 56. 57. 58. 59.
H. 60. 61. 62. 63. 64. 65. 66. 67.
continued
Apexsh
Corolla length (mm) Corolla width(mm) Apex teeth shape: (1) no lobes, (2) two slight lobes - wavy, (3) two side lobes - no center, (4) three slight lobes, (5) two distinct lobes, (6) three distinct lobes, (7) extra lobes, more than three Length of left lobe (ocular scale converted to rom) Length of center lobe (ocular scale converted to rom) Length of right lobe (ocular scale converted to mm) Length of extra lobe, if present, (ocular scale converted to mm)
Phyllaries - five measurements per capitula Inphyl Inphyw Inphym OUtphyl OUtphyw OUtphym
Inner Inner Inner OUter OUter OUter
phyllary phyllary phyllary phyllary phyllary phyllary
length (ocular scale converted to mm) width (ocular scale converted to mm) margin (ocular scale converted, to rom) length (ocular scale converted to rom) width (ocular scale converted to mm) margin (ocular scale converted to rom)
Leaves - fran five plants/site, five leaves per plant Length Lfleta Lfletb Middiv Diva Divb Areas Sections
Total leaf length (rom) Length of 5th leaflet (rom) Length of 6th leaflet (mm) Number leaflet divisions off center midrib Number divisions off midrib of 5th leaflet Number divisions off midrib of 6th leaflet Area of total leaf (em square) Area of a standard section size (em square)
142 Figure 6.1).
Within each chosen site, 10 plant specimens
were subsampled based on similar phenology and portions of the plant which were collected.
Preferred plants were
specimens consisting of the entire plant or the top central
stem portion of the plant, in late-flowering to seed set phenological stages.
Second preference was for specimens
collected from lateral or basal shoots,
in the same
phenological stage. Morphological measurements were conducted on 60 plant and flower characters (Table 6.2, Part II).
One measurement
per plant was conducted for the peduncle and internode characters (Part II - sections A, B, C).
Three capitula
from terminal branch positions were laxed in hot water and detergent for measurement of the floral
characters.
A
single measurement was conducted on each capitulum for characters 35-39 (Part II - section D).
Three measurements
per capitula were performed for the disk floret characters 40-46
(Part
II
- section E)
and
five
measurements
per
capitula were completed on the ray florets
(Part
section F) and phyllary characters (Part II -
section G).
All
II
measurements were averaged and a single value was
obtained for each character of each individual plant. Due to poor preservation of the finely dissected leaves on the pressed specimens, only five plants per site were subsampled for the leaf characters (Table 6.2, Part II section H).
Measurements on
th~
1 eaf
characters
were
destructive to the remainder of the specimen since the entire central
stem portion was
laxed
to
enable
leaf
143
Figure 6.1.
Collection s1 tes of M. perforata in Alberta,
saskatcht:Wan and Manitoba for the morphanetric study.
144
~
0
••
"
•
145 removal.
The laxed leaves subtending the top five branches
were removed,
"f loated" in water and arranged wi th minimal
overlap among the finely dissected divisions.
Leaves were
lifted from the water on screening and pressed.
Due to
their fragility, leaves were xeroxed onto sheets of clear acetate for area measurements on a Li-Cor portable area meter
(model
LI-3000).
Al though
the
xeroxing
process
enlarged images, it was felt that this was not a problem since all specimens would be relative to one another.
Five
measurements were conducted on leaf characters 60-65,
nine
on the total
leaf area (character 66)
and 12 on the
sectional area of the leaf (character 67).
The leaf
measurements were averaged together to obtain one value per character per plant. Environmental characters were based on 30 year averages (Table 6.3,
characters 1-5) and on yearly environmental
values calculated from August 1985 to the collection date in 1986 (characters 6-10) for weather stations close to each collection site (Anonymous 1980).
for the geographical
location,
Site specific characters
such as lati tude,
and altitude were determined from atlases.
longi tude
The degree of
disturbance or cultivation was evaluated at the collection site and then converted to a multistate scale (character 14).
Analyses
of
organic
matter,
texture,
pH
and
conductivity were performed on collected soil samples by the Saskatchewan Soil, Testing Laboratory at the University of Saskatchewan.
.1'*0
Table 6.3.
Si te characters used for 14 collection si tes throughout Alberta, Saskatchewan and Mani toba.
Character Code
A. 1. 2. 3. 4. 5.
B.
Character description/unit of measurement
30 year averages of environmental characters Frost
Max Min
ppt
Degday
Frost-free days per year (#) Daily maximum temperature per year (degrees celsius) Daily minimum tellperatue per year (degrees celsius) Yearly precipitation (mm) GrCMing degree days (sununation of degrees celsius > 5 celsius)
Yearly environmental values (August 1985 to collection date 1986)
6. Frost2
7. Max2 8. Min2 9. PPt2 10. Degday2
Frost-free days per year (#) Daily maximum temperature per year (degrees celsius) Daily minimum temperature per year (degrees celsius) Yearly precipitation (rom) Growing degree days (sunnnation of degrees celsius> 5 celsius)
C.
Site specific characters
11. 12. 13. 14.
Lat
Long Alt Cult
15. OM 16. Texture
17. pH 18. Cond
Degrees latitude north (converted to decimal values ) Degrees longitude west (converted to decimal values) Altitude (m above sea level) Degree of disturl:ance/cul tivation: (1) uncul tivated, wasteland, farmland, (2) pasture, (3) di tch and roadside, (4) forage crop, (5) cropland, wheat, canola Organic matter in soil (%) Soil texture: (1) fine sandy loam, (2) loam, (3) sil ty clay loam, (4) clay loam, (5) clay Soil pH Soil conductivity (InS/em)
----------------------------------------------------------------------
147 6.2.2.
Statistical analyses
An analysis of variance (ANOVA) was performed on the site means of the plant characters, among the 14 populations sites
by a
general
linear model
procedure
(SAS
1985).
Characters that were highly significant (p < 0.001) were retained for
further analyses,
whereas non-significan"t
values were eliminated since there was no discrimination among the characters for the sites.
Characters for which
precise measurements could not be made consistently were also eliminated. Principal components analyses (PCA) were conducted on data standardized to unit variance (procedure PRINCOMP, 1985),
of
SAS
the si te means from the 32 plant characters
retained from the ANOVA, as well as the 13 environmental
characters from both the 30-year average and yearly values, to determine which characters were discriminating.
This was
also a means of reducing the number of characters, since after the PCA,
data may be expressed in terms of fewer
characters without any significant loss of information (Dunn and Everitt 1982).
Only the first three principal
components were interpreted since there was a large drop in the proportion of variance accounted for after the third component
«
10%).
A fewer number of characters were selected from the peA on the basis of the amount of variance accounted for in the first three principal components.
The purpose was to obtain
the desired character to sample size ratio necessary for the canonical
correlation analyses.
It was
felt
that
148
characters with the highest loading values were significant to the analyses since: wi th
the
first
(1) these characters were associated
three
components;
and
(2)
the
high
eigenvectors indicated that the characters were important in the determination of variance accounted for by the given principal component.
Procedure FACTOR (SAS 1985) was used
to generate a variable x component correlation matrix for interpretation. Thirteen
plan t
characters
and
seven
env i ronmenta 1
characters were used in a canonical correlation analysis (procedure CANCORR, SAS 1985). The individual plants from the fourteen collection sites were used as samples instead of the site means, to produce a larger sample size (68) for the analysis. characters
Therefore,
the ratio of the number of
to samples was 19/68 = 0.279,
within the
preferred range discussed by Gittins (1985). 6.3.
Results Mean values and standard error of the means were
calculated to determine the amount of variability in the morphological characters retained from the ANOVA (Table 6.4).
In
the
first
three
pr inc ipa 1
components,
64.4%
variation was accounted for among the 14 sites (eigenvalues 9.93,
6.78 and 3.91 respectively, Table 6.5).
The influence
of each character on the determination of each principal component
was
Communalities
denoted (h 2 ,
by
the
correlation
the sum of
coefficients for each character)
coefficient.
the squared correlation indicated the amount of
Table 6.4.
Means and standard error of the site means for 32 morphological characters of Matricaria perforata collected fran 14 sites across the Prairie region.
Character Number
1
Character Code
Height
2
Basal
3 4 5
Growth Phen Dens Antho
6
7
Bush
8
Pedal Pedb3 Pedc3 Peda4 Pedb4 Pede 4 Inter1 Inter2 Inter3 Inter4
12 15 25 26 27 31 32 33
34 36 37 38 39 43 44 45 46 47 48 49 60 61 63 67
Rayno
Recpsh ReceP"l Recepl Diskl Diskw Lobe
Anther
Rayl Rayw Apexsh Length Lfleta Middiv Sections
Mean (lIDi t )
Standard Error
52.58 (em) 21.67 (em) 5.75 (6 scale) 4.80 (7 scale) 4.25 (7 scale) 2.98 (5 scale) 3.11 (5 scale) 78.44 (rom) 38.22 (mm) 39.32 (rom) 34.94 (rom) 60.21 (rom) 77.48 (rom) 19.46 (rmn) 22.58 (mm) 27.46 (mm) 27.94 (mm) 18.15 (#/capitulum) 3.96 (6 scale) 6.43 (nun) 5.38 (mm) 2.24 (mm) 0.37 (mm) 0.39 (mm) 1.43 (mm) 14.27 (mm) 3.00 (mm) 3.76 (7 scale) 45.78 (mm) 17.43 (mm) 14.38 (# divisions) 1.30 (mm squared)
16.310 15.740 0.100 0.704 0.889 0.884 0.822 17.074 21.299 15.600 8.060 17.231 25.341 7.896 8.268 8.230 4.964 1.187 0.313 0.729 0.540 0.210 0.032 0.071 0.170 1.767 0.496 0.313 11.465 5.469 3.683 0.432
Character
Correlation coefficients of 32 plant morphological characters of M. perforata to the first three principal canponents.
Table 6.5.
---------------------------------------------------------------------Corrununalities Principal Character Principal Principal h2 No. &. Code Component 1 Component 3 Component 2 - - - - -
-
-
-
- -
- - - - -
- - - - -
-
-
- -
-
-
-
- -
-
- -
- - -
0.0688 -0.3509 -0.3505 0.5759 -0.1933 -0.2064 -0.3199 0.8281 0.6857 0.7423 0.6642 0.5597 0.8684 0.8719 0.8485 0.8080 0.4808 -0.8316 0.3777 -0.1830 -0.1669 0.2152 0.7215 0.3427 0.3784 -0.1848 0.2358 0.2784 -0.7346 -0.2934 -0.7860 -0.6741
0.4329 -0.1506 -0.4267 0.4555 -0.1956 -0.5418 -0.0892 0.0911 -0.1897 -0.1620 0.3820 0.1817 0.0902 -0.1294 -0.1346 -0.1541 -0.4575 -0.1057 -0.5829 0.5853 0.7569 0.8665 0.4041 0.6997 -0.7807 0.8684 0.7933 0.5587 0.3517 0.4114 0.1312 0.1721
0.0760 0.7148 -0.2096 -0.2594 0.8261 -0.1057 0.5942 0.3677 0.4740 0.3575 0.1833 -0.1021 0.1588 0.2547 -0.0133 0.0725 0.1805 0.3664 -0.3115 0.6210 0.3275 -0.1860 -0.2698 -0.4664 0.2036 -0.0402 0.0529 0.5385 0.0488 0.2513 -0.2605 0.2386
0.1979 0.6568 0.3488 0.6064 0.7580 0.3473 0.4634 0.8292 0.7309 0.7051 0.6307 0.3567 0.7874 0.8418 0.7382 0.6819 0.4730 0.8369 0.5794 0.7617 0.7080 0.8317 0.7567 0.8245 0.7942 0.7898 0.6877 0.6796 0.6657 0.3185 0.7029 0.5413
9.9326
6.7800
3.9097
20.6223
% Variance
0.3104
0.2119
0.1222
Cumulative % Variance
0.3104
0.5223
0.6444
1 2 3 4 5 6 7 8 12 15 25 26 27 31 32 33 34 36 37 38 39 43 44 45 46 47 48 49 60 61 63 67
Height Basal Growth Phen Dens Antho Bush Pedal Pedb3 Pedc3 Peda4 Pedb4 Pedc4 Interl Inter2 Inter3 Inter4 Rayno Recpsh Recepw Recepl Diskl Diskw Lobe
Anther Rayl Rayw Apexsh Length Lfleta Middiv Sections
Variance Explained Proportion
----------------------------------------------------------------------
151 character variance accounted for principal components,
by the first
three
therefore specifying the overall
significance of the character to the PCA. The characters contributing to the first component were mainly vegetative: peduncle lengths, number of leaflet divisions
internode lengths,
and ray floret number (Table
6.5, characters 8, 15, 27, 31, 32, 33, 36 and 63). Peduncle and internode characters were highly positively correlated to one another, whereas number of leaflet divisions and ray floret numbers were negatively correlated to these six characters.
The second component was represented by the
flora 1 characters of receptac I e
length,
ray floret
length
and width, disk floret length and anther length (characters 39,
43,
46,
47, and 48). All characters were positively
correlated, with the exception of anther length. Characters 2, 5 and 38, which contributed to the third component, were a
mixture of:
vegetative - basal
shoot
length;
association - density/abundance of surrounding plants;
and floral - receptacle width.
M.
plant
perforata
Basal shoot length
and plant density were highly correlated, but receptacle length was not correlated to either of these characters. The character principal component scores (determined from transformed character values) are plotted for the site PCA (Figure 6.2).
Interpretation of the first versus the
second principal component indicates that sites 22 and 54 associated with principal component one have the smallest vegetative characters,
whereas site 63 has the largest
vegetative characters.
Sites 13 and 24, associated with
152
Figure 6.2.
Plot of the morphological character cOlliJOnent scores, principal component one versus principal component two, of M. perforata from 14 sites in Alberta, saskatchewan and Manitoba.
153
3.0
2.0
13
1.0
63
51
-2.~.O_ _....."';"_ _':-~1.0:..-~2=-......_ _~
~,...._ _~1.~O_ _..... 59
18 67
70 29
22
-2.0
P.C.2
9
... 2.o_ _~ P.C.l
154 principal component two, have the largest floral characters and plants from site 22 exhibit the smallest floral characters (Figure 6.2).
The remaining nine sites do not
discriminate along either principal component one or two for these characters. In a plot of the first principal component versus the third principal component,
si tes 22 and 29 associated wi th
the third component have the shortest basal shoots,
lowest
plant density and smallest receptacle width (Figure 6.3). In comparison, si tes 2, 70, 67 and 51 form a group wi th the maximum values for these characters on the opposite end of the third component.
An intermediate group was comprised of
six populations which did not discriminate along the third component. the
The 13 morphological character's discussed,
exception
of
receptacle
width,
were
applied
wi th to
a
canonical correlation analysis. Principal
components
analysis
on
the
environmental characters found that latitude,
30-year
longitude,
altitude and degree days above 50 C contributed to the first component (Table 6.6).
Organic matter and soil conductivity
were important on the second component and maximum daily temperature was the most important attribute on the third component.
There was a high correlation between latitude,
longitude and altitude, but a negative correlation to degree days. In
the
site
PCA
of
the
first
versus
the
second
component, site 29 had the lowest latitude and altitude, whereas site 63 had the highest latitude and site 67 had the
155
Figure 6.3.
Plot of the morphological character component scores, principal component one versus principal component three, of M- perforata from 14 sites in Alberta, Saskatchewan and Manitoba.
156
70 2
63 51
67
-2'~.o_ _--+
__.....__-+
:-'::'.0~
~o +-_ _---4~ _ _......
41
18
59
13
9
24
-1.0
22 29
-2~
P.C.3
...._ _... P.C.1
2~
.Lv/.
Table 6.6.
Variable Code
- - - -
Correlation coefficients of 13 environmental characters, 30 year averages, from 14 collection sites across the Prairie region with the first three principal components.
Principal Component 1
-
Long Lat Alt Frost Max
Min PPt Degday
Cult Om Tex pH Cand Variance Explained
- - - -
-
Principal Component 2
-----
Principal Component 3
- -
- -
- - -
-
-0.2775 -0.0830 0.0783 0.6529 0.1728 -0.0480 0.2764 0.2745 0.7631 0.9200 0.0447 0.4462 0.9003
0.2120 0.0222 0.0797 -0.0736 0.8914 0.7186 0.3606 0.1571 0.0145 -0.0683 0.0821 -0.1592 -0.1375
0.8277 0.9598 0.7975 0.4856 0.8338 0.6580 0.2085 0.8935 0.6328 0.9573 0.3371 0.7680 0.8836
4.5242
3.1404
1.5786
9.2432
0.3480
0.2416
0.1214
0.3480
0.5896
0.7110
Cumulative % Variance
h2
0.8401 0.9759 0.8860 0.2324 0.0973 0.3734 0.0452 -0.8908 -0.2243 0.3261 -0.5730 0.7373 0.2328
Proportion % Variance
CClJ!lIllUIlalities
-
158 highest altitude (Figure 6.4). Site 67 was also distinctive from the other si tes because it had the largest percentage of organic matter and the highest soil conductivity. In the plot of component one versus component three, site 54 had the highest daily maximum temperatures,
whereas site
41 had the lowest values for this character (Figure 6.5). From the 13 environmental characters,
the seven characters
with the highest loadings on their respective components were applied to a canonical correlation analysis. A principal components analysis was also conducted on the yearly environmental
characters.
Characters of
latitude, altitude, number of frost free days and daily minimum temperature discriminated on the first component; pH, conductivity, organic matter and longitude on the second component; and degree days on the third component (Table 6.7).
A site PCA
again,
along the first component due its high altitude
(Figure 6.6).
showed site 67 as distinctive,
once
The interpretation of the distinct separation
of site 67 along the second component was not apparent. Site 29 has the lowest longitude and highest pH and sites 59 and 63 have the highest longitude, whereas site 54 has the lowest pH. In a plot of the first versus the third component, site 29 is distinct on the third axis due to high degree day values (Figure 6.7).
Although site 18 was associated with
the lower end of component three,
the meaning was not clear
since it does not have the lowest degree day val ues. These seven yearly environmental characters were used in the
159
Figure 6.4.
Plot of the 30-year average, envirorunental character canponent scores, principal canponent one versus principal component two, of M. 2~~fQ~~!~ from 14 sites in Alberta, saskatchewan and Manitoba.
160
67
3.0
1.0
2
29
22 -2.0
.....----+----.....---__1 P.C.l 51
-1.0
...----...----~---,.;I&---~--24
9
2.0
1.0
18
13
59 5'" 63 -1.0
P.C.2
41
161
Figure 6.5.
Plot of the 30-year average, environmental character canponent scores, principal component one versus principal component three, of M. 2~£fQ£~1~ from 14 sites in Alberta, saskatchewan and Manitoba.
162
70
29
Sl
22
63 -2.~O~
"""
':'-~ 1.0
+
t-
+
+ 1.0
--+
S9
67 18
13
9 ·1.0
2
2A
~1
-2l)
P.C.3
-04
20
P.C.1
Table 6. 7.
Variable Code
Correlations of 13 year 1y environmental characters fran 14 collection si tes across the Prairie region to the first three principal canponents.
Principal Component 1
Principal Component 2
-
-
Camnunalities h2
-
- - - -
- -
Long Lat Alt Frost
0.6084 0.8429 0.8041 0.7798 -0.0196 0.8877 -0.0878 0.1930 -0.5122 0.6628 -0.5390 -0.5131 0.5349
-0.6337 -0.4763 -0.2804 0.2378 0.2043 0.2305 0.4635 0.3804 -0.5993 0.6590 0.2738 0.7033 0.6697
0.0024 -0.0154 -0.2913 0.4943 -0.0745 0.1466 -0.1720 0.8685 0.0876 -0.2214 0.3701 -0.2218 -0.3304
0.7717 0.9375 0.8100 0.9090 0.0477 0.8626 0.2521 0.9363 0.6293 0.9226 0.5025 0.8071 0.8439
4.7103
3.0296
1.4924
9.2322
0.3623
0.2330
0.1148
0.3623
0.5954
0.7102
Max
Min
ppt
Degday Cult Om Tex pH Cond Variance Explained
- -
- -
-
Principal Component 3
- -
- -
Proportion % Variance
Cumulative % Variance
- - -
164
Figure 6.6.
P lot of cal culated year 1 y environmental character canponent scores, principal canponent one versus principal component two, of M. E~£!Q£~!~ from 14 sites in Alberta, saskatchewan and Manitoba.
165
67
1.0
2
1.0
P.C.l 9
18
SI
13
S4
41 -1.0
.59
P.C.2
63
166
Figure 6.7.
Plot of calculated yearly environmental character canponent scores, principal canponent one versus principal component three, of M. ~~~!2~~1~ from 14 sites in Alberta, saskatchewan and Mani toba.
167
29
13
22
59 54
63
9 51 1.0
-1.0
2.0
P.C.l
67
2A
18
p.C.3
168 canonical correlation analysis. Separate canonical correlation analyses using 30 year averages and the calculated yearly environmental values did not differ in their results. that there were
The overall results showed
low communality values
(h 2 ) for
the
morphological characters, and a small amount of variance was accounted
for
environmental
in
both
the
morphological
and
the
intra-set and inter-set correlations to the
canonical variates (Table 6.8).
In addition,
the redundancy
values, amount of variance accounted for by the correlations between the two character sets, were very low. These results indicate that characters
the CCA was not discriminating among the
for
correlations
the
could
14 collection sites.
Therefore,
be
morphological
made
between
the
no
characters and the environmental factors. These
findings
do
not
necessarily
imply that
the
'measured characters are not influenced by environmental factors.
The use of different, more site specific or micro
environmental characters could possibly yield correlations between
plant
and
site
variables.
Duplication
of
environmental characters for each plant of a given site may have contributed to the unsuccessful analyses,
i.e.
14
different environmental characters were repeated for a number of the 68 plants. 6.4.
Discussion
The principal
components analysis of
M~!ri£~~i~
perforata from the Prairie region indicated that there were
Table 6.8.
canonical correlation analY$isof M. perforata fran the Prairie Provinces. Relationships between six environmental characters (30 year averages) and thirteen morphological characters: correlations between the characters and the canonical variates.
Intra-set Correlations canonical variate
ul
u2
u3
Inter-set Correlations
h2
VI
v2
h2
v3
- - - - - - - - - - - - - - - - - - - - - - - - - - - - - - - - - - - - - - - - -
-
- - -
Morphological character Pedal Inter2 Inter3 Inter4
Rayno Middiv LeIYJth
Rayl Diskl Rayw
Anther Dens
Basal
0.0154 -0.0870 -0.1977 -0.0536 -0.0463 -0.0488 0.2657 0.3318 0.5716 0.5580 -0.5914 0.0322 0.0036
0.2043 -0.1685 0.0079 0.2482 -0.0901 -0.1290 0.2681 0.0093 0.3196 -0.2919 -0.0153 0.1974 0.2660 -0.3931 0.0775 0.2872 -0.4417 0.1954 0.1468 0.4198 -0.0796 -0.0509 0.5953 0.1850 0.4863 0.0079
0.0704 0.0692 0.0638 0.0748 0.1895 0.0416 0.2959 0.1986 0.5600 0.5092 0.3587 0.3896 0.2366
0.0134 0.1460 -0.1182 -0.0757 0.0056 0.1741 -0.1720 -0.0644 -0.0905 -0.0466 0.1916 -0.0065 -0.0402 0.2284 -0.2047 -0.0424 -0.0109 0.1385 0.2311 0.1901 -0.2757 0.2886 0.0554 0.2014 0.4972 -0.3157 0.1371 0.4854 0.1049 0.2944 -0.5144 -0.0569 -0.0351 0.0280 0.4255 0.1298 0.0031 0.3476 0.0055
0.0355 0.0361 0.0419 0.0389 0.0957 0.0211 0.1655 0.1269 0.3657 0.3333 0.2691 0.1986 0.1209
Variance extracted
0.0941
0.0858
0.0553
0.2352
0.0712
0.0438
0.0272
0.1422
Redundancy
0.0712
0.0438
0.0272
0.1422
0.0712
0.0438
0.0272
0.1422
.....
0'\ \0
Table 6.8 .•.... continued
Inter-set Correlations
Intra-set Correlations canonical variate
u1
u2
-
h2
u3
Vl
V2
v3
h2
Environmental character Degday Alt pH ~
Cond Max
-
0.1158 0.0321 -0.3839 -0.2667 -0.1017 -0.1922
-0.4592 0.8134 -0.4866 0.3903 0.4031 0.6725
- - - - - - - - -
-
-
0.1593 -0.0766 0.3232 0.3416 0.5533 0.0186
- -
-
0.2497 0.6685 0.4886 0.3402 0.4790 0.4895
-
-
-
0.1008 0.0279 -0.3339 -0.2319 -0.0885 -0.1672
-
- -
-
-0.3282 0.5814 -0.3478 0.2789 0.2881 0.4806
0.1117 -0.0538 0.2267 0.2396 0.3881 0.0130
- - - -
-
-
0.1303 0.3417 0.2838 0.1890 0.2414 0.2591
-
-
Variance extracted
0.0467
0.3127
0.0932
0.4526
0.0353
0.1598
0.0458
0.2409
Redundancy
0.0353
0.1598
0.0458
0.2409
0.0353
0.1598
0.0458
0.2409
-
-
I-'
o '"
171 morphological differences among the sites. of
the
variation accounted
However,
for by the first
31.0%
principal
component was represented by vegetative plant characters. Discriminating factors from the environmental PCA did not correspond
to
the site differences
morphological PCA.
resulting
from
the
No climatic gradient was observed in
either of the ordinations. The high variance values suggest greater phenotypic plasticity in the vegetative characters such as peduncle,
internode and
leaf divisions than those of
characteristics from the disk and ray florets.
the floral The peduncle
and internode characters were highly correlated to one another, but leaf divisions and ray floret number had low negative correlations to these characters and a correlation to one another.
low
Low variance in the ray floret
number per capitulum indicated less site variability than the vegetative characters. Floral component, analysis.
characters
represented the second principal
accounting for 21.2% of the variation in the Low
variance
values
indicate
that
these
characters may be more taxonomically meaningful because the variation was less environmentally influenced.
Receptacle
length, ray floret length, ray floret width and disk floret length were positively correlated to one another and anther length was negatively correlated to these four characters. This relationship may have been the result of the late phenological stage that these measurements were conducted on the anthers.
Since the florets are protandrous, the anthers
172
may have been past maturity and shrivelled. Sites 22 and 54 have plants with the smallest peduncle and internode lengths,
whereas site 63 had the
measurements for these characters.
largest
The habitats were in
mixed forage, alfalfa/brome and wheat, respectively.
The peA
did not discriminate these sites based on the environmental characters measured;
therefore,
it is difficult to infer a
relationship between the morphology and sites. could be perennial
speculated crops
that
(sites
22
the and
habitats 54),
However,
it
associated with
in contrast
to
the
habitat associated with an annual crop (site 63), might be a factor influencing the vegetative growth.
The high density
and competition of annual crops may cause more erect growth in
M.
perforata, thus, greater elongation of the vegetative
characters.
Also,
the lower stature of alfalfa plants and
haying of this and other forage crops throughout the growing season might
be a factor limiting extensive vegetative
growth of the weed. The largest floral characters, receptacle length and floret measurements, were found in plants from sites 13 and 24.
Measurements among the other 12 sites were more similar
to one another than to sites 13 and 24.
However,
it was
felt that the differences exhibited by these two sites was an artifact, due to measurements conducted by different individuals,
rather than an indication of morphological
variation. Receptacle width was
not
correlated
to
the
floral
173
characters measured from the ray and disk florets.
Although
receptacle width was highly correlated to receptacle length, there appeared to be no correspondence of the sites that discriminated for
these two characters:
receptacle width values; values;
site 22 -
site 2 - high
low receptacle width
site 24 - high receptacle length values;
41 - low receptacle length values. width was not
thought
Therefore,
and site receptacle
to be a biologically meaningful
character for differentiating floral characteristics. The characters of the longest basal shoot length, plant density and receptacle width represented the third principal component, which accounted for 12.2% of the variation in the analysis.
Basal shoot length and plant density were highly
correlated
to
ecologically.
one
another,
which
was
i.e.
expected
It would be expected that there would be a
negative correlation between basal shoot density,
not
length and plant
with lower plant density,
the competition
would be less and the longer the basal shoots could grow. However, site 29 has both the lowest plant density and the shortest basal shoot length, whereas site 67 has the highest plant density and longest basal shoot length. Popova
and
Peneva
(1987)
found
that
of
the
ten
morphological characters that differentiated two cytotypes of M. recutita, the top seven were floral characters.
These
characters are similar to results obtained in the present study:
length and width of ray floret,
floret,
receptacle length and number of ray florets per
capitulum.
length of disk
The most important characters were capitulum
174
diameter (equivalent to twice the length of the rays plus receptacle width, in the present study) and height of the capitulum (=receptacle length).
Popova and Peneva (198?)
concluded that characters related to the inflorescences were the best characters to measure for cytotype differentiation. In addition, within a given cytotype, ecological differences had a great influence on the morphological variation of M. recutita.
Perhaps the results obtained in the present study
would be more applicable in differentiating between the two cytotype races of
M.
~rforat~
rather than the differences
within the presumably single tetraploid race of the Prairie region. Although
morphological
variation was
noted
in
the
present study, it was felt that these differences were not taxonomically important. The best differentiating characters were vegetative and have a large amount of variability, probably induced by environmental characters not evaluated in this study.
The floral
appear to be small, to
define
differences among the sites
inconsistent and not distinctive enough
differing
populations.
In order
to
more
accurately determine the taxonomic significance of the morphological characters, it would be necessary to conduct a study of plants from these 14 sites under uniform growing conditions. In summary,
the
collected across
14
the
populations Prairie
of
Provinces
M· of
~~~f2~~1~
Alberta,
Saskatchewan and Manitoba are not taxonomically separable.
175
No correlation could be made between plant morphology and the measured environmental
characters.
Although
M.
2~~f2~~1~
occupies a variety of habitats associated with . agricultural activities, this association has not imposed any genotypic differentiation.
In theory,
differential
responses to control practices would not be expected as a consequence of the morphology of this weed in the Prairie region. The similar results obtained among the 14 sites using 30-year averages and calculated yearly environmental values implies that
Matrl£~~l~
adapted' to the
2erforata is not morphologically
long term environmental
conditions,
but
influenced by seasonal climatic conditions during the year of growth.
This trend would be expected for a weedy
introduced plant species.
Since
M.
perforata has probably
had separate introductions to different locations throughout the Prairie region, a clinal gradient would not be expected. With geographical
isolation,
establishment would be more likely.
local
race or ecotype
176
7.
General summary and conclusions The
biosystematics
and
life
history strategies of
Matricaria perforata were studied to gain an understanding of the taxonomy and biology of this taxon in Canada.
The
agricultural implications were considered for the taxon distributed in the Prairie region. Based on a review of the taxonomic and nomenclatural literature,
Matricaria perforata Merat was accepted as the
name applied to the scentless chamomile species in Canada.
M.§!.!!: i £.§! r i.§!
.Q~!:f.Q!: a.!.§!
transcontinentally. ffi.§!!:i.!iill'§! L. and
M.
i sawe e d y
Conversely,
both
s pe c i es M.
f
0
und
ill.§!!:i.!iill'§! ssp.
ill.§!!:i.!im.§! ssp . .Qh.§!~o£~.Qh.§!l.§! (Rupr.)
Rausch. are associated with coastal or maritime regions and are not weedy.
Matricaria .Qerf.Q!:.§!ta can by distinguished
from these two taxa by its erect growth habit,
light
coloured phyllary margins, much finer dissected leaves, and achenes with three well separated, non-inflated ribs. Morphological variation was found among 14, presumably tetraploid,
M.
perforata populations collected in Alberta,
Saskatchewan and Manitoba. peduncle lengths,
The vegetative characters of
internode lengths,
number of ray florets
per capitulum and number of leaf divisions off the main midrib were the main characteristics among
the
locations.
However,
the
tha~
discriminated
large
amount
of
variability observed was attributed to environmental factors which influenced the phenotypic plasticity of the plants. Therefore,
these characters were not considered as good
177 taxonomic characters. The floral characters of receptacle length, disk floret length, anther length, ray floret
length and width were
secondary characteristics which also were variable among plants from the 14 locations.
Character variation among
plants from the sites was small,
i.e.
differences
measurement
were
smaller
than
among population error,
inconsistent and not distinctive enough to characterize the populations.
Therefore,
these floral
features were not
considered good taxonomic characters in this study due to the large amount of "noise" encountered in the data set. Two cytotypes of M,. ]2erforata were found in Canada.
A
tetraploid race, 2n=36, from the Prairie region and east central Canada, and a diploid race, 2n=18, from the Atlantic region.
The two cytotype races of
M.
differentiated by achene morphology.
]2~fQra!~
could be
Achene width and
achene length were good taxonomic characters,
however,
the
number of achenes per capitulum and 100 achene weight were not meaningful taxonomic characters.
Future research might
evaluate the taxonomic importance of the floral characters, which proved least variable for the tetraploid plants from 14
sites
in
the
morphometric
study,
for
possibly
differentiating the cytotype races in Canada. One population from St.
John's Newfoundland had
anomalous chromosome counts of 2n=27 and 2n=36,
suggesting
that tetraploid and diploid populations may be present at this locality, producing triploid hybrids.
The presence of
a tetraploid population in the Atlantic region may indicate
178
either a separate introduction of the weed from Europe or the spread of the weed from more western localities. Generally it is assumed that the tetraploid cytotype is associated with agricultural activities, whereas the diploid cytotype
is
ruderal,
usually
not
associated
with
agriculture. The documentation of a previously undetected tetraploid population B~fo~~!~
in Newfoundland
implies
that
M.
may become an agricultural weed in the Atlantic
region as well.
Phenological and morphological differences were observed among 23 populations of the
two
cytotypes grown
in a
M.
B~£fQ£~!~
and between
common garden at
Regina.
Diploid populations had a shorter period from germination to
bolting and flowering, as well as a lower overwintering ability than the tetraploid populations.
Consequently, most
plants from the diploid populations were annual, whereas plants from the tetraploid populations were either biennial or perennial. 1 arger,
Tetraploid plants were morphologically
more erect and spreading
in growth
habi t
than
diploid plants. Interbreeding occured within local populations, between local
populations within
each
cytotype
populations of the two cytotype groups of
and
M.
between
£erf~~!a.
Crossing tetraploids with diploids resulted in viable seeds which
grew
into
sterile
F1
plants.
Agronomically,
triploid plants would not be important contributors to the
weed seed bank.
Although no naturally occurring populations
179
of diploid, documented,
tetraploid and
triploid
plants
have
been
this situation is possible.
The breeding system of the Canadian
M.
Q~KfQK~!~
was
allogamous, comparable to the breeding system reported on the
European
Contrary
species.
to
one
of
the
characteristics of an "ideal" weed, this breeding system would be a disadvantage for perpetuation of the species in a new environment by a single colonizing individual.
However,
Matricaria perforata is a prolific seed producer of 344 to 553 achenes per capitulum, with the potential of over 1.5 million achenes per plant.
The establishment of dense
stands in low-lying wet areas would make spring tillage for weed control difficult.
In addition, some of the achene
characteristics are advantageous to the spread and increase of population size.
The achenes are small and light, which
readily allow for distribution by wind or water. movement of uncovered 'grain and screenings,
Therefore,
as well as the
airborne chaff at seed cleaning or transport facilities would be potential
modes of seed spread across
the
agricultural region. Plants from four populations of
M.
perforata were
transplanted to the field in monthly intervals from May to October.
Lower percentages of plants bolting or flowering
were observed from each population for planting dates from May to late July.
Plants bolted but did not flower after
the July planting date and did not bolt or flower after the September date.
Transplants from October did not survive.
This manipulation of the planting dates also influenced the
180
growth
forms
exhibited by
the
populations.
Plants
transplanted in Mayor early June developed either as summer annuals or as perennials.
Transplants in late-June and
early July resulted in annual, biennial and perennial growth forms.
All plants transplanted after mid-July developed as
biennials, flowering and setting seed in the second growing season.
The September transplants exhibited biennial growth
forms which flowered during the second year, as well as vegetative growth forms which did not flower during their life cycle. Effective control measures should be directed at the elimination of
M.
perforata seedlings early in the growing
season, prior to seeding, to eliminate crop competition. Post emergence control of
M.
of plants growing,
and suppress the flowering and seed
setting ability of
plants
control.
perforata will reduce the percentage
that
establish after spring
Once biennial and perennial forms are established,
control is more difficult due to the overall size of the plants and the extensive fibrous root system.
Biennial
plants established late in the growing season are not a problem because they remain vegetative for the first year and they may be controlled by cultivation during the fall or early the following spring. Changes in cropping practises towards reduced and zero tillage may augment the spread of
M.
E~£fQ£~!~
throughout
the agricultural region, since tillage is a good control method and there are few herbicides registered for chemical
181
control.
Fall seeded crops,
such as winter wheat and fall
rye, also limit the use of cultivation as a control practice in the spring.
The extensive movement of hay from more
northern to southern agricultural regions in recent years may have also aided in the spread of the weed, if the forage was
contaminated with
E~KfQK~!~
M.
~K1QK~l~.
Once established,
M·
is a robust plant and prolific seed producer.
These biological aspects make
M.
perforata a good competitor
which could severely limit the yield in poor competitor crops such as flax or lentil. During the collection trips in Alberta, Saskatchewan and Manitoba, habitats:
Matricaria perforata was observed in various
along roadsides,
or abandoned land,
in farmyards,
throughout waste
along drainage canals,
in pasture land,
in spring crops such as wheat, canola and flax, as well as perennial
crops
such as
alfalfa.
This
plant
is
more
abundant in moist habitats such as the low-lying areas in fields,
along the uncultivated edges of the field or in
other water accumulating areas,
such as ditches,
throughout
the black soil zone of the Prairie region. In Prairie
conclusion, region
M.
were
.2~fQK~ta
populations
morphologically
from
similar.
the Size
differences were observed and attributed to site factors. No
correlations
existed between
environmental characters measured.
the
morphological
and
Results from this study
indicated that differential response to control practices due to plant morphology and locality would not be expected. Theoretically, one herbicide should control all populations
182
of
M.
I2~!:.f.Q!:.~!~
f 0 u n don the P r air i e s .
Howe v e r ,
t his
research does not rule out the possibility of differential physiological responses to herbicides. plants
of
different
pop~lations
The similarity among would
also
be
a
consideration for biological control, where plant uniformity is important for host specificity. Although the present study has answered some questions about the biosystematics and life history strategies of M~!!:.i£~!:.i~ I2~!:.f.Q!:.~!~
in Canada, new questions are always
arising.
Some considerations for future research might
include:
1)
Further
investigations
into
the
taxonomic
variation of the 14 sites from the Prairie region by growing them in a common garden to eliminate the environmental effects.
2)
Additional chromosome counts,
from Sudbury and
St. John's, to document the distribution of the chromosome races.
An assessment could be made of the spread of the
tetraploid reciprocal of
M.
cytotype
in
the
Atlantic
region.
3)
A
transplant study of the 23 Canadian populations
I2~!:.f.Q!:.~!~
to determine if the observed phenological
and morphological differences are maintained.
4)
Determine
if triploid populations occur naturally and if changes occur in the reproductive state.
5)
Further studies into the
effect of different planting times by transplanting earlier to the field and by shortening the time period between plantings.
183
References Cited Allard, R.W. 1965. Genetic systems associated with colonizing ability in predominantly self-pollinated species. In Baker, H.G. and Stebbins, G.L. (eds.). Genetics of colonizing species. Academic Press. New York. pp. 49-76. Anderson, A.V.R. and Taylor, R.J. 1983. Patterns of morphological variation in a population of mixed species of Castilleja (Scrophulariaceae). Syst. Bot. 8 (3):
225-232.
Anonymous. 1977. The noxious weed act, R.S.S. 1965 Section 2 (i). The Saskatchewan Gazette, Volume 73, Number 36, Par t I I : 519. Anonymous. 1980. Canadian climate normals 1951-1980, temperature and precipitation, Prairie Provinces. Environment Canada. Anonymous. 1982. Scentless chamomile: a problem weed. Alberta Agriculture. Agrifax. Agdex 640-6. Anonymous. 1984. Scentless chamomile. Weed control notes. Weed identification series. Saskatchewan Agriculture, Plant Industry Branch, Crop Protection Section. Anonymous. 1985. Scentless chamomile. Weeds of Alberta. Alberta Agriculture and Alberta Environmental Centre. Arora, O.P. and Madhusoodanan, K.J. 1981. Nature of tetraploidy in M~trl£~~l~ lllQg2~~ L. Cytologia 46: 773-779.
Austin, M.P. 1985. Continuum concept, ordination methods and niche theory. Ann. Rev. Ecol. Syst. 16: 39-61. Bailey, L.H. 1954. Manual MacMillan Company. New York.
of
cultivated
plants.
Baker, H.G. 1965. Characteristics and modes of origin of weeds. In Baker, H.G. and Stebbins, G.L. (eds.). The genetics of colonizing species. Academic Press, New York. Pp. 147-172. Baker, H.G. 1974. The evolution of weeds. Ecol. Syst. 5: 1-24.
Ann.
Rev.
Barbour, M.G., Burk, J.H. and Pitts, W.o. 1980. Terrestrial Plant Ecology. The Benjamin/Cummings Publishing Company Inc., Menlo Park, California. Pp. 604.
184
Barkley, T.M. 1986. Asteraceae Dum., the sunflower fami 1 y. In Great Plains F lora Association. F lora of the Great Plains. University Press of Kansas, Lawrence, Kansas. Boivin, B. 1972. Flora of the Prairie provinces. Phytologia 22-23, Part III Connatae. Bough, M., Colosi, J.C. and Cavers, P.B. 1986. The weedy biotypes of proso millet (Panicum miliaceum) in Canada. Can. J. Bot. 64: 1188-1198. Briggs, D. and Walters, S.M.
1984. Plant variation and evolution. Second edition. Cambridge University Press. Cambridge. 412 pp.
Clapham, A. R. 1962. Tr i.121.~1!.r.2~~!:!!n:!!!1. In Clapham, A. R. , Tutin, E.H. and Warburg, E.F. (eds.). Flora of the British Isles, 2nd ed. Cambridge University Press, Cambridge. pp. 852-854. Clausen, J., Keck, D.D. and Hiesey, W.M. 1940. Experimental studies on the nature of species. I. The effect of varied environments on western North American plants. Carnegie Institution of Washington. Publ. 520. Washington, D.C. Clausen, J., Keck, D.D. and Hiesey, W.M. 1947. Heredity of geographically and ecologically isolated races. Am. Nat. 81: 114-133. Cronquist, A. 1952. Order Asterales. Compositae, the com p 0 sit e f am i 1 Y. In GI e a son, H. A. ( e d . ) The new Britton and Brown illustrated flora of the Northeastern United States and adjacent Canada. The New-York Botanical Garden, New York, Volume 3. Cronquist, A. 1955. Part 5: Compositae. In Hitchcock, C.L., Cronquist, A., Ownbey, M. and Thompson, J.W. Vascular plants of the Pacific Northwest. University of Washington Press. Seattle and London. Crovello, T.J. 1970. Analysis of character variation in ecology and systematics. Ann. Rev. Ecol. Syst. Vol. 1: 55-98. Darwent, A.L. and McKenzie, J.S. 1978. Effects of planting date on the growth and development of narrow leaved hawkrs-beard. Can. J. Plant Sci. 58: 1087-1094. Digby, P.G.N. and Kempton, R.A. 1987. Multivariate analysis of ecological communities. Population and community biology. Chapman and Hall. London. 206 pp.
185 Douglas, D.W. 1989. The weed scentless chamomile. Farmers' perspectives, history and distribution, habitats, biology, effects on crop yield and control. Report prepared for the Canada/Saskatchewan Subsidiary Agreement on Agriculture Development (ERDA). 92 pp Dunn, G. and Everi tt, B.S. 1982. An introduction to mathematical taxonomy. Cambridge University Press. Cambridge. 152 pp. Ehrendorfer, F. 1965. Dispersa 1 mechanisms, genet ic systems and colonizing abilities in some flowering plant families. In Baker, H.G. and Stebbins, G.L. (eds.). The genetics of colonizing species. Academic Press, New York. Pp. 331-352. Ellis, M. and Kay, Q.O.N. 1975a. herbicide resistance in
Genetic variation in scentless mayweed (1~i21~~~2~2~~m~m in2g2£~m (L.) Schultz Bip.). I. Differences between populations in response to MCPA. Weed Res. 15: 307-315.
Ellis, M. and Kay, Q.O.N. 1975b. herbicide resistance in
Genetic variation in scentless mayweed (Tri21~~£2~~~!!m in2£2£~m (L.) Schultz Bip.). II. Intraspecific variation in response to ioxynynil and MCPA, and the role of spray retention characteristics. Weed Res. 15: 317-326.
Ellis, M. and Kay, Q.O.N. 1975c. Genetic variation in her b i c ide res i s tan c e i .n s c e n tIe ssm a y wee d (Tri~l~B.ros~mum in2£2£B.m (L.) Schultz Bip.). III. Selection for increased resistance to ioxynil, MCPA and simazine. Weed Res. 15: 327-333. Enayet-Hossain, A.B.M. 1973 . . Materials for a flora of Turkey, XXIX: Tripleurospermum Schultz Bip. Notes from the Royal Botanical Garden, the Royal Botanical Garden, Edinburgh, 32(2): 251-254. Fernald, M.L. 1950. Gray's manual of botany. American Book Company, New York.
8 th ed.
Frankton, C. and Mulligan, G.A. 1974. Weeds of Canada. Canada Dept. of Agriculture, Publication 948. Fritsch, R.M. 1973. In Love, A. lOPB chromosome number reports XLI. Taxon 22: 459-464. Gadella, T.W.J. 1983. Some notes on the determination of the mode of reproduction in higher plants. Proc. K. Ned. Akad. Wet Sere C. BioI. Med. Sc. 86 (2): 155-166. Cyto logy and the mode of Gadella, T.W.J. 1984. reproduction of some taxa of Ri~£~£i!!m subgenus
186 Pil.2.§~ll.2.. Proc. K. Ned. Akad. Wet Sere C. BioI. Med. Sc. 87(4): 387-400.
Gadgil, M. and Solbrig, C.T. 1972. The concept of r- and K-selection: Evidence from wild flowers and some theoretical considerations. Amer. Nat. 106: 14-31. Gauch, Jr. H. G. 1982. Multivariate analysis in community ecology. Cambridge University Press, Cambridge. 298 pp. Gittins, R. 1985. Canonical analysis. A review with applications in ecology. Springer-Verlag. Berlin, Heidelberg, New York, Tokyo. 351 pp. Gleason, H.A. 1952. The new Britton and Brown illustrated flora of the Northeastern United States and adjacent Canada. The New-York Botanical Garden, New York. Goodall, D.W. 1970. Statistical plant ecology. Ecol. Syst. Vol.l: 99-124. Gould, S.J. and Johnston, R.F. variation. Ann. Rev. Ecol. Syst.
1972. Vol 3:
Ann. Rev.
Geographic 457-498.
Halliday, G. and Beadle, M. 1983. Consolidated index to the Flora Europaea. Cambridge Uni versi ty Press, Cambridge. Hamet-Ahti, L. 1967. Tripleurospermum (Compositae) in the northern parts of Scandinavia, Finland and Russia. Acta Botanica Fennica 75: 3-19. Hanf, M. 1983. The arable weeds of Europe with their seedlings and seeds. BASF United Kingdom Ltd. Harling, G. 1951. Embryological studies in the Compositae. II. Anthemideae-Chrysantheminae. Acta Horti. Bergiani 16: 1-56. Harper, J.L. 1965. Establishment, aggression, and cohabitation in weedy species. In Baker, H.G. and Stebbins, G.L. (eds.). The genetics of colonizing species. Academic Press. New York. Pp. 243-265. Harper, J.L. 1977. Population biology of plants. Press Inc. Ltd. New York. 892 pp.
Academic
Harris, R. 1975. A primer of multivariate statistics. Academic Press Inc. Ltd. New York. 332 pp. Heywood, V.H. and Humphr ies, C.J. 1977. Anthemideae, systematic review. In Heywood V.H., Harborne, J.B. and Turner, B.L. (eds.). The biology and chemistry of the Compositae. Academic Press, London. Volume 2: 851 898.
187
Hitchcock, C.L. and Green, M.L. 1929. In Jeffrey, C. 1980. Note on the lectotypification of the names Cacalia L., Matricaria L., and Gnaphalium L. Taxon 28: 349-351. Hitchcock, C.L. and Green, M.L. 1935. In Rauschert, S. 1974. Nomenklatorische probleme in de gattung M~ tr icar ia L. Fo 1 ia Geobot. Phytotax., Praha 9: 249 260. Hodgson, J.M. 1964. Variations in ecotypes of Canada thistle. Weeds 12: 167-171. Holmgren, P.K., Keuken, W. and Schofield, E.K. 1981. Index Herbariorum. Part I, the herbaria of the world. 7th ed. Dr. W. Junk B.V. Publ. The Hague-Boston. Hulten, E. 1968. Flora of Alaska and neighboring territories. Stanford University Press. Stanford, California. Jeffrey, C. 1979. Note on the lectotypification of the names Q~~ll~ L., M~!~l£~~l~ L. and Qn~Eh~li~~ L. Taxon 28(4): 349-351. Jain, S.K. 1976. The evolution of inbreeding in plants. Ann. Rev. Ecol. Syst. 7: 469-495. Jordan-Molero, J.E. and Stoller, E.W. 1978. Seasonal development of yellow and purple nutsedge (QYE~~~~ esculentus and Q. rotundus) in Illinois. Weed Sci. 26: 614-618. Kachi, N. and Hirose, T. 1983. Bolting induction in Oenothera erythrosepala Barbas in relation to rosette size, vernalization and photoperiod. Oecologia (Berlin) 60: 6-9. Kartesz, J.3. and Kartesz, R. 1980. A synonymized checklist of the vascular flora of the United States, Canada and Greenland. Vol II. The biota of North America. The University of North Carolina Press, Chapel Hill. Kay, Q.O.N. 1965. Experimental and comparative ecological studies of selected weeds. Ph. D. thesis, University of Oxford, Oxford. Kay, Q.D.N. 1969. The origin and distribution of diploid and tetraploid Tripleu~2~E~~~~m lnQdo~~m (L.) Schultz Bip. Watsonia 7(3): 130-141.
cr·
Kay, Q.O.N. 1972. Variation in sea mayweed m~~l!ll!n!m (L.) Koch.) in the British Isles. Watsonia 9: 81-107.
188
Kay,
Q.O.N. 1976. 60. M~!£i£~£i~ L. In Tutin, T. G., Heywood, V.H., Burges, N.A., Moore, D.M., Valentine, D.H., Walters, S.M. and Webb, D.A. (eds.). Flora Europeae. Vol. 4. Cambridge University Press. Cambridge. Pp. 165-167.
Keeley, P.E., Carter, C.H. and Thullen, R.J. 1987. Influence of planting date on growth of palmer amaranth (Amaranthus I?§!lmeri). Weed Sci. 35(2): 199-204. Kessler, D.D., Thomas, A.G. and Bowes, G.C. 1989. Occurrence and distribution of scentless chamomile (M~!~i£~~i~ E~~f2~~!~ Merat) in Saskatchewan. ECW Minutes of Western Canada. Section meeting, Winnipeg, Manitoba. 1988. Pp. 39. Klebesadel, L.J. 1969. Life cycles of field pennycress in the subarctic as influenced by time of seed germination. Weed Sci. 17: 563-566. Koul, M.L.H. 1964. Cytology of some composites. Sci. Res. Banaras Hindu University 14: 20-22.
Jour.
Kynclova, M. 1970. Comparative morphology of achenes of the tribe Anthemideae Casso (family Asteraceae) and its taxonomic significance. Preslia 42: 33-53. Lacey, E.P. 1988. Latitudinal variation in reproductive timing of a short-lived monocarp, Q~Y£Y~ £~£Q!~ (Apiaceae). Ecology 69(1): 220-232. Lankosz-Mroz, M.
Karyological investigations on !~iBl~~2§'Qerill.!!!!l ~!: i t i mu ill (L .) K0 c h . ssp. i n29.2£R!!! (L.) Hyl. ex. Vaarama from Poland. M. Acta BioI. Cracov, Sere Bot. 19: 93-105. 1976.
Law r en c e , M. E . 1985. 2~n~£i2 L . ( As t era c e a e ) i n Australia: Reproductive biology of a genus found primarily in unstable environments. Austr. J. Bot. 33(2): 197-208.
Linnaeus, C. 1753. Holmiae: 891.
Species Plantarum.
Lobay, W. 1964. Scentless mayweed. Central Weed Control Conference. Lansing, Michigan.
First edition. Proc. 20 th North pp. 60-61. East
Looman, J. and Best, K. 1979. Budd's flora of the Prairie Provinces. Research Branch, Agriculture Canada. Publ. 1662.
Lotz, L.A.P. and Blom, C.W.P.M. 1986. Plasticity in life history traits of ~1~n!~g2 m~12£ L. ssp. Eli~2~E~~!!l~
189 Pilger.
Decologia (Berlin) 69:
Love, A. 1984. 33: 756-760.
25-30.
Chromosome number reports LXXXV.
Taxon
Love, A. and Love, D. 1948. Chromosome numbers of Northern plant species. Rep. Dep. Agric. Univ. Inst: Appl. Sci. (Iceland), Sere B., 3: 1-131. Lovkvist, B. 1962. Chromosome and differentiation studies in flowering plants of Skane, South Sweden. I. General aspects. Type species with coastal differentiation. Bot. Notis. 115: 261-287. Mack, R.N. 1985. Invading plants: their potential contribution to population biology. In Studies on plant demography. A festschrift for John L. Harper. Academic Press. London. Pp. 127-142. Mack, R.N. 1986. Alien plant invasion into the intermountain west: a case history. In Mooney, H.A. and Drake, J.A. (eds.). Ecology of biological invasions of North America and Hawaii. Springer Verlag. New York. Pp. 191-213. Madhusoodanan, K.J. and Arora, D.P. 1980. B-chromosomes in tetraploid Matricaria inodora L. Curro Sci. 49(2): 76-77. McCarty, M.K. 1985. A nursery study of large-flowered taxa of Carduus. Weed Sci. 33: 664-668. McNeill, J. 1976. The taxonomy and evolution of weeds. Weed Res. 16: 399-413. Merat, F.V. 1812. Nouvelle flore des environs de Paris. 1st edition, Paris: 332. Mitsuoka, S. and Ehrendorfer, F. 1972. Cytogenetics and evolution of Matricaria and related genera (Asteraceae Anthemideae). Osterr. Bot. Zei tschr., Wien, 120: 155 200. Moore, D.M., Tutin, T.G. and Walters, S.M. 1976. CLXIX. Compositae. In Tutin, T. G., Heywood, V.H., Burges, N.A., Moore, D.M., Valentine, D.H., Walters, S.M. and Webb, D.A. 1976. Flora Europeae. Vol. 4. Cambridge University Press. Cambridge. Morisset, P. and Boutin, C. 1984. The biosystematic importance of phenotypic plasticity. In Grant, W.F. (ed). Plant biosystematics. Academic Press. Orlando, F I or ida. Pp. 293-306. Morrison,
D.A.
and Weston,
P.H.
1985.
Analysis of
190 morphological variation in a field sample of Caladenia catenata (Smith) Druce (Orchidaceae). Aust. J. Bot. 33 (2): 185-195. 1974. Aims and Mueller-Dombois, D. and Ellenberg, H. John Wiley and Sons, m~thods of vegetation ecology. New York. Mulligan, G.A. 1959. Chromosome numbers of Canadian weeds. II. Can. J. Bot. 37: 81-92. Mulligan, G.A. 1960. Polyploidy in Canadian weeds. J. Genet. Cytol. 2: 150-161.
Can.
Mulligan, G.A. 1965. Recent colonization by herbaceous plants in Canada. In Baker, H.G. and Stebbins, G.L. (eds.). The genetics-of colonizing species. Academic Press. New York. Pp. 127-146. Nehou, J. 1954. Etude comparative de Matricaria inodor~ L. et de M. m~~i!im~ L. (Composees,Radiees). Bull. Soc. Sci. Bretagne 28: 133-153. Packer, J.G. 1983. Flora of Alberta. 2nd edition. University of Toronto Press, Toronto. 687 pp. Pielou, E.C. 1984. The interpretation of ecological data. A primer on classification and ordination. John Wiley and Sons, Inc. New York. 263 pp. Pobedimova, E.G. 1961. !~i~1~~~2s~~~m~m Sch. Bip. (translated to english). In Shishkin, B.K. and Bobrov, E.G. (Eds.). Flora S.S.S.R. Botanical Institute of the U.S.S.R. Academy of Science, Moscow. Vol. 26: 157 184. Popova E.D. and Peneva, P.Z. 1987. Morfologicna izmencivost na medicinskata lajka (Matricaria recutita L.). II. Disciminanten analiz. (translated to english). Genetika i Selekcija: 319-325 (Bulgaria). Porsild, A.E. and Cody, W.J. 1980. Vascular plants of continental Northwest Territories. Canada National Museum of Natural Sciences, National Museums of Canada. 1974. Powell, A.M., Kyhos, D.W. and Raven, P.H. Amer. J. Bot. Chromosome numbers in Compositae. X. 61: 909-913. Raunkiaer, C. 1934. The life forms of plants. In Mueller-Dombois, D. and Ellenberg, H. 1974. Aims and methods of vegetation ecology. John Wiley and Sons, New York. Pp. 449-465. Rauschert,
S.
1974.
Nomenklatorische probleme in de
191 gat tun 9 M~!!'. i £~!'.1~ L. (t ran s I ate d toe n 9 lis h) . Geobot. Phytotax., Praha 9: 249-260.
F0 I i a
Reinartz, J.A. 1984. Life history variation of common mu I lei n ( Y,§!!'.Q~§'£}!ill !h~E§'}! s ) . I. La tit ud i na I differences in population dynamics and timing of reproduction. J. Ecol. 72: 897-912. Ridley, H.N. 1930. The dispersal of plants throughout the world. L. Reeve and Company Ltd., Ashford, England. Ringius, G.S. and Chmielewski, J.G. 1987. Morphological variation within and among six populations of Trillium '§!!'.~£!~ill in southern Ontario. Can. J. Bot. 65: 2450 2457. Roberts, H.A. and Feast, P.M. 1974. Observations on the time of flowering of mayweeds. J. Appl. Ecol. 11: 223 229. Roland, A.E. and Smith, E.C. 1969. The flora of Nova Scotia. The Nova Scotia Museum, Halifax. Rottgardt, K. 1956. Morphologische, cytologische und physiolologische untersuchungen von okotypen in Schleswig-Holstein. Beitr. BioI. Pflanzen. 32(2): 225 278. SAS Institute Inc. 1985. SAS user's guide: version 5 edition. SAS Institute Inc. Carolina. 956 pp.
statistics, Cary, North
Schultz-Bipontinus, C.H. 1844. Ueder die tanaceteen, mit besonderer berucksichtigung der deutschen arten. Neustadt ander Haardt: 31-34. Scoggan, H.G. 1979. The flora of Canada. Part 4. National Museum of Natural Sciences. National Museums of Canada. Silvertown, J. Nature 310:
1984. 271.
Death of the elusive biennial.
Sneath, P.H.A. and Sokal, R.R. 1973. Numerical taxonomy. The principles and practice of numerical classification. W.H. Freeman and Company. San Fransisco. 573 pp. Sokal, R.R. and Sneath, P.H.A. 1963. Principles of numerical taxonomy. W.H. Freeman and Company. Stafleu, F.A. et ale 1972. International code of botanical nomenclature. 11th Int. Bot. Congo Regnum Vegetabile 82, Utrecht.
192 Stearns, S.C. 1977. The evolution of life history traits: a critique of the theory and a review of the data. Ann. Rev. Ecol. Syst. 8: 145-171. Stebbins, G.L. 1950. Variation and evolution in plants. Colombia University Press, New York. 643 pp. Stebbins, G.L. 1970. Adaptive radiation and reproductive characteristics in angiosperms, I: pollination mechanisms. Ann. Rev. Ecol. Syst. 1: 307-326. Stephenson, A.G. and Bertin, R.I. 1983. Male competition, female choice and sexual selection in plants. In Real, L. (ed.). Pollination biology. Academic Press, Inc. New York: 110-140. Turesson, G. 1922. The genotypical response of the plant species to the habitat. Hereditas 3: 211-350. Tutin, T. G., Heywood, V.H., Burges, N.A., Moore, D.M., Valentine, D.H., Walters, S.M. and Webb, D.A. 1976. Flora Europeae. Cambridge University Press. Cambridge. Vaarama, A. 1950a. Cases of asyndesis in M~tri£ari§!. inodora and Hyoscyamus niger. Hereditas 36: 342-362. Vaarama, A. 1950b. Cytotaxonomic studies on Northern Tripleurospermum forms (Piikio, Finland). In, Osvald, H. and Aberg, E. (Eds.). Proc. of the 7 t n- Int . Bot. Congr., Stockholm: 279-280. Voss, E.G. (editorial chairman). 1983. International code of botanical nomenclature. 13th Int. Bot. Congr., Sydney. Regnum Vegetabile Vol. 111. Warwick, S.I. and Black, L.D. 1986. Genecological variation in recent 1 y establ ished populations of ~Q~!112n !h~QBh~~~!l (velvet leaf). Can. J. Bot. 64: 1632-1643. Warwick, S.l. and McNeill, J. 1982. Population variation in fl~g!~gQ ill~i2~ from souther Ontario. Can. J. Bot. 60 (12): 2846-2856. 1985. Weaver, S.E., Dirks, V.A. and Warwick, S.I. Variation and climatic adaptation in Northern Can. J. Bot. populations of Qa!~~~ ~!~~ill2ni~m. 63: 1303-1308. W.S.S.A. 1984. Composite list of weeds. suppl. 2: 1-137.
Weed, Science 32,
193
Appendix A
The
following
list
includes names used for
the
Matricaria species in Canada and the associated synonymous names
which
lack
publication source.
proper
references
to
the
The literature source.
author's
The literature
source from which the name usage was observed are noted following the synonyms. 1.
Matricaria maritima L. ssp. maritima Synonym
M~!!:i£~r i~
-
inod.Q!:~
var.
§.~lin~
(Wa 11 r.)
Babcock The usage of the epithet "g 1ina" was observed from ~!:eth!:~m
2.
in.Qg.Q!:gm var.
1965).
However,
Scoggan
(1 9 79)
§.~lin~
Wallr.
1822
(in Kay
the above application was noted in
.
M~!ri£~!:i~ m~!:i!im~
L.
ssp.
£ha~.Q£~£h~l~
(Rupr.)
Rauschert Synonym -
(not of Orlova 1966). &
3.
Bead 1 e
hookeri Schultz-Bipontinus
Tri£l~os£~mum
This usage was noted in Halliday
(1 983 ) .
Matricaria perforata Merat Synonyms
a)
M. maritima ssp.
noted in Kartesz
&
inodor~ (L~)
Kartesz
Clapham
(1980),
~s
Hulten
( 1968) .
b)
M. maritima var.
(not of Weiss 1895).
~gre§.ti§.
(Knaf) Wilmott
Usage noted in Kartesz &
194
Kartesz (1980), (1979),
Porsild & Cody (1980),
Fernald
Hitchcock et al. this
(1950), (1955)
application was
(1950).
Hulten who
Scoggan
(1968)
indicated
according
to
and that
Fernald