Jul 29, 2017 - Problem 2: H-SVM and RIP can discriminate linearly separable data ... The best models of RIP are better than other seven LDFs confirmed by ...
Abstract We developed the new theory of discriminant analysis after R. Fisher (Theory) published from Springer in last Dec. Theory consists three Optimal Linear Discriminant Functions (OLDFs) such as Revised IP-OLDF (RIP)based on Minimum Number of Misclassifications (MNM) criterion, Revised LP-OLDF and Revised IPLP-OLDF, and two Methods, such as the 100-fold cross-validation for small sample method (Method1) and Matryoshka feature selection method (Method2). Although there are five serious problems of discriminant analysis, Theory solves five problems completely. Especially, many researchers could not obtain good results of cancer gene analysis over than 30 years (Problem5). We solved it within 54 days by Method2 and LINGO Program3. Therefore, Problem5 is very easy thema. 7/29/2017
• In this paper, we introduce Method2 finds six microarray datasets are Linearly Separable Data (LSD) and consist disjoint unions of small linearly separable gene subspaces (Small Matryoshka, SM). We explain the results of 179 SMs by common statistical methods using Singh et al. dataset. • Only logistic regression can discriminate all SMs correctly in addition to three OLDFs and SVM. However, one-way ANOVA, Ward cluster analysis and PCA cannot show the linearly separable signs because both classes are overlap. • Therefore, we introduce new statistic named RatioSV (=SV width/ RIP discriminat score range (SR)*100). This statistic tells us 179 RIP discriminant scores are good malignancy indexes of cancer gene diagnosis. Moreover, analysis of discriminant score data by Ward cluster and PCA tell us surprising results. • We expect these results are helpful for cancer gene diagnosis. 7/29/2017
1. Introduction • I had established a new theory of discriminant analysis after R. Fisher (Theory[29]). The Theory consists • Four optimal LDFs (OLDFs) defined by Mathematical Programming (MP. ) • IP-OLDF, Revised IP-OLDF (RIP) based on minimum number of misclassifications (minimum NM, MNM) criterion, Revised LP-OLDF (LP), Revised IPLP-OLDF (IPLP). • There are five serious problems of discriminant analysis • Problem 1: Only RIP can discriminate the cases on the discriminant hyperplane correctly. • Problem 2: H-SVM and RIP can discriminate linearly separable data (LSD) theoretically. • Problem 3: Generalized inverse of variance-covariance matrices has serious defect. • Problem 4: Statistical discriminant analysis is not traditional inferential statistics because Fisher never defined the equation of standard error (SE) of discriminant coefficient and error rate. • The 100-fold cross-validation for small sample (Method 1) solved Problem 4. • Problem 5: Over than 30 years, many researchers have struggled to make feature-selection for gene analysis. The Matryoshka feature selection (Method 2) solved Problem 5 within 54 days. • RIP can select features naturally for six microarray datasets (the datasets) quickly. • The dataset consist of several disjoint union of small gene spaces with “MNM=0” (SM). 7/29/2017
2. The Theory • We develop four OLDFs. However, we focus on RIP, H-SVM and Fisher’s LDF in this research. • IP-OLDF finds two new facts. • Because it is defined in p-dimensional coefficient space, we can understand the relation of NM and LDF. • MNM decreases monotonously (MNMk>=MNM(k+1)). • If MNM=0, all models including k-variables are 0. • This fact explains the Matryoshka structure of the datasets. • Revised IP-OLDF (RIP) solves Problem 1, 2 and 5.
• The 100-fold cross-validation for small sample method (Method1) instead of LOO procedure solved Problem 4. • The best models of RIP are better than other seven LDFs confirmed by six different types of data.
• The Matryoshka feature selection method (Method 2) reveals a surprising structure of six datasets. • The dataset consists of several disjoint union of small gene subspaces with MNM=0. 7/29/2017
2.1 Problem 5 • Because six datasets collected by six US research groups are LSD, result of Problem 2 is related to Problem 5. • Only H-SVM and RIP can discriminate LSD theoretically. • In many experimental cases, Revised LP-OLDF (LP), Revised IPLPOLDF (IPLP), SVM4 (S-SVM for penalty c=10000), and logistic regression can often discriminate LSD for six common data. • Although NMs of logistic regression are zero, it may not make feature-selection. • Statistical discriminant functions based on variance-covariance matrices may be impossible for gene analysis. • Error rates of these functions are very high for LSD, nevertheless MNMs are 0. • Problem 3 shows the defect of variance-covariance matrices. • Because H-SVM cannot discriminate non-LSD, there is no research of LSD discrimination before RIP. 7/29/2017
2.2 MP-based LDFs and statistical LDFs H-SVM • H-SVM tells us LSD clearly. Until now, there is no technical word “MNM”. • “MNM=0” equals to LSD. “MNM>=1” equals to non-LSD. • Many statisticians misunderstand the purpose of discrimination is to discriminate overlapping data (MNM >= 1), not LSD. • They cannot define “overlapping data” until now.
• If we call all linearly separable gene space and sub-spaces “Matryoshkas”, the smallest Matryoshka (Basic Gene Set, BGS) can explain the Matryoshka structure completely because of monotonic decrease of MNM. • Although MNMs of H-SVM are 0, H-SVM cannot select features naturally for Swiss bank note and Japanese 44 cars data. • I guess the generalization ability causes this fact.
• MIN = ||b||2/2 + c*Σei ; yi* ( txib + b0) >= 1 - ei ; c: penalty c to combine two objectives. e : non-negative real value. 7/29/2017i
(3)
IP-OLDF based on MNM criterion • IP-OLDF in (1) fix the intercept to one. It is defined in the p-dimensional coefficient space. • Although yi*(txib+ 1) = 0 is a linear hyperplane and divides discriminant space to two half planes such as plus half plane (yi*(txib+1) > 0) and minus half plane (yi*(txib+1) < 0). • If we choose bk in plus hyperplane as LDF, LDF such as yi*(tbkxi+1) discriminate xi correctly because of yi*(tbkxi+1) = yi*(txibk+1) > 0. On the other hand, if we choose bk in minus hyperplane, LDF misclassify xi because of yi*(tbkxi+1) = yi*(txibk+1) < 0. • It looks for the right vertex of an Optimal Convex Polyhedron (optimal CP, OCP) if data is a general position. However, if data is not general position, IP-OLDF may not looks for correct vertex. • Because LDF corresponding to CP interior points discriminate the same cases correctly, it has unique NM. • MIN = Σ ei; yi*(txib + 1) >= - ei ;
(1)
ei: 0/1 integer variable corresponding to classified/misclassified cases. yi: 1/-1 for class1/class2 or object variable. xi: p-independent variables. 7/29/2017
b: discriminant coefficients.
Revised IP-OLDF based on MNM criterion • If data is not general position, IP-OLDF may not find true vertex of optimal convex polyhedron (OCP). • RIP finds true OCP interior point defined by IP-OLDF directly. • It can discriminate all types of data. • The best model of RIP are better than other best model of seven LDFs. • The best model has minimum error rate mean in the validation samples among all possible models.
• Because most of coefficients become zero, it can select features naturally. • MNM criterion and/or branch & bound algorithm may cause the surprising result. • Because Revised LP-OLDF and Revised IPLP-OLDF have weak feature selection, only three SVMs cannot make feature-selection.
• MIN = Σei ; yi* ( txib + b0) >= 1 - M* ei ; ei : 0/1 integer variable. b0: free decision variables. M: 10,000 (Big M constant). 7/29/2017
(2)
Statistical LDFs and discriminant functions Problems of variance-covariance matrices • Generalized inverse of variance-covariance matrices has defect (Problem 3). • QDF and RDA misclassify all cases in class 1 to class 2 for particular condition (Japanese automobile data).
• Error rates of Fisher’s LDF and QDF are very high for LSD discrimination. • We never use these functions for the important discrimination such as medical diagnosis, gene analysis, pattern recognition, rating….. • We had better reviewed the old important research rejected because of high error rates.
• Therefore, LASSO based on variance-covariance matrices may not be able to select features. • Remember: Researchers tried to discriminate the datasets by Fisher’s LDF and QDF over 30 years ago and showed miserable results.
• Researchers of LASSO examine their results with my results. 7/29/2017
LSD Discrimination • When we discriminate Swiss banknote data with six variables, IP-OLDF finds two-variables models, such as (X4, X6), is linearly separable. • By the monotonic decrease of MNN, 16 MNMs including these two variables are zero among 63 models (= 26-1 = 63). • Other 47 MNMs are greater than one. • (X4, X6) is BGS and explain the structure of Swiss banknote data completely.
• RIP in (2) can naturally select features for ordinary data such as Swiss banknote data, Japanese-automobile data, the pass/fail determination using exam scores, and the student linearly separable data. • However, we develop more powerful model selection procedure such as the best model by Method 1. • Therefore, we had ignored the natural feature selection for ordinary data before Method 2. • If LASSO cannot select features naturally for ordinary data, we have better considered 7/29/2017 it cannot make feature selection naturally for the dataset.
Problem 3 and Method 5 by Japanese-automobile Data Because two MNMs of X1 and X3 are zero, two one-variable model are two BGSs. RIP, Revised LP-OLDF (LP) and Revised IPLP-OLDF (IPLP) can select features naturally. (X1-X6)⊃(X1). The discriminant hyperplane of X1 is 0.82625. (X2-X6)⊃(X3). The discriminant hyperplane of X3 is 4.5. However, H-SVM, SVM4, and SVM1 cannot select features naturally and all coefficients are p Var t LDF QDF MNM λ=γ =0.8 λ=γ =0.1 not zero.
7/29/2017
1
Emission (X1)
11.37
2
0
0
2
0
2
Price (X2)
5.42
1
0
0
4
0
3
Capacity (X3)
8.93
1
29
0
3
0
4
CO2 (X4)
4.27
1
29
0
4
0
5
Fuel (X5)
-4.00
0
29
0
5
0
6
Sales (X6)
-0.82
0
29
0
5
0
2.4 Short Story of Feature Selection • 1971 ~ 1974: We discriminated ECG data by Fisher’s LDF and QDF that was inferior to the decision tree logic developed by medical doctor. • I concluded Fisher’s assumption was not adequate for medical diagnosis. • Logistic regression is more suitable for medical diagnosis that is as same as my claim.
• Miyake & Shinmura (1980) proposed heuristic OLDF based on MNM. • 1998~2000: I proposed IP-OLDF and discriminated Iris and CPD. • 2000~2004 (Research of LSD discrimination): • Swiss banknote data is LSD. • The pass/fail determination using exam scores are good research data for LSD. • Trivial LDF: f=T1+T2+T3+T4-50. • Only Fisher’s LDF does not become trivial LDF because it assumes Fisher’s assumption..
• The defect of IP-OLDF and Revised IP-OLDF. • Revised IP-OLDF solves Problem 1 and 2. • Method 1 solves Problem 4 and I misunderstand to establish the Theory.
• In October 2015, RIP solves Problem 5 and establish Method 2 within 54 days. 7/29/2017
3. Matryoshka Feature Selection Method (Method 2) • On Oct. 25 2015, I presented the useful meaning of 95% CI of coefficient and thought the end of the Theory [51] [52]. • After my presentation, young researcher presented the result of PCA using six datasets. • On Oct. 28, she send me a e-mail address about datasets.
• I downloaded six datasets from Jeffrey et al. HP [12]. • When I discriminate Shipp et al. dataset [54] on Oct. 28, 2015, I find only 32 coefficients of RIP are zero and 7129 coefficients are not zero within 4 second. • Because NM of Fisher LDF are not zero, it is not used for gene analysis. • Although NMs of SVM are almost zero, most coefficients are not zero. Therefore, SVM are not helpful for cancer gene feature selection. • This is the reason of Problem 5 because discriminant functions are not helpful for gene analysis until now. 7/29/2017
3.1 Outlook of Method 2 • When we discriminate Shipp et al. data [54] on Oct. 28, 2015, RIP, Revised LP-OLDF (LP), and Revised IPLP-OLDF (IPLP) can make feature-selection drastically. • Although NMs of three SVMs are zero, they cannot make feature-selection. • NMs of Fisher’s LDF are not zero by JMP12. • QDF, RDA and logistic regression cannot discriminate the dataset.
• We confirm these fact by Golub et al. and Alon et al. datasets.
• Next, we find Matryoshka structure as follows: Golub7129 ⊃ Golub34⊃ Golub11 • We called Golub11 “Small Matryoshka (SM)” that may include several BGSs.
• Third, after we delete Golub11 from Golub7129, we made new dataset with Golub7118. When we discriminate Golub7118 again, we found the second SM (SM2). • We continued to repeat this process by manual and gave up to find all SMs.
• I develop the LINGO program and found all SMs of six datasets [45-50]. • The dataset consists of several disjoint union of SMs. • We can easily analyze these SMs because those are small samples. • However, we cannot get useful facts to analyze the dataset by ordinary statistical methods. 7/29/2017
3.2 Results of Six Datasets (See Springer) Data
Alone et al.
[1]
Golub et al. [10]
Shipp et al.
[54]
Description
Normal (22) vs. tumor cancer (40)
All (47) vs. AML (25)
Follicular lymphoma(19) vs. DLBCL (58)
Size
62 *2000
72*7129
77 *7130
SM: Gene
64 [47]:1152
69 [46]:1238
213 [45]:3032
Min/Mean/Max
11/18/39
10/18/31
7/14/43
JMP Ver.12
20:2/3:37
20:5/3:44
17:2/1:57
% and error rate
63%, 8%
43%, 11%
56%, 4%
Data
Singh et al. [56]
Tian et al. [59]
Chiaretti et al. [2]
Description
Normal (50) vs. tumor prostate (50)
False (36) vs. True (137)
B-cell (95) vs. T-cell (33)
Size
102 *12626
173 *12625
128*12625
SM: Gene
179 [48]:3990
159 [49]:7221
270 [50]:5385
Min/Mean/Max
13/22/47
28/45/104
9/19/62
JMP Ver.12
46:4/6:46
16:20/9:128
94:1/2:31
% and error rate
46%, 10%
60%, 17%
49%, 1%
7/29/2017
CPU time and Final Models of six LDFs Although IPLP and LP can reduce gene space drastically, those cannot reduce again. Why can RIP find smaller gene sub-spaces ? Why cannot three SVMs make feature-selection? Alon et al.
Chiaretti et al
Golub et al.
Shipp et al.
Singh et al.
Tian et al.
RIP
0s
62 11s
127 1s
72 4s
43 36s
91 14s
173
IPLP
1s
40 6s
38 2s
27 2s
32 4s
75 9s
118
LP
1s
40 4s
38 1s
27 2s
32 2s
75 5s
139
HSVM
0s
2000 4s
12625 1s
6252 3s
7129 2s
12625 8s
12625
SVM4
0S
2000 6s
12625 1s
7127 3s
7129 4s
12625 8s
12625
SVM1
0s
2000 7s
12625 2s
6241 3s
7129 2s
12625 7s
12625
7/29/2017
3.3 Detail of Method 2 by LINGO Program Loop1=1 finds first SM1 with Golub11. Loop2 is a small search to find Golub7129⊃ Golub11 ⊃ Golub11.
Golub dataset consists of 69 disjoint union of SMs that are linearly separable gene subspaces. The 68th and 69th SMs are the biggest samples with 72 cases by 31 genes. L1
SN
LOOP1
LOOP2
Gene
MNM
1
1
1
7129
0
2
1
2
34
0
3
1
3
11
0
4
1
4
11
0
16
2
1
7118
0
17
2
2
36
0
18
2
3
18
0
19
2
4
16
2
5
16
20
7/29/2017
L2
Gene
n
MNM
35
11
6630
17
0
1
11
7129
11
0
36
11
6613
19
0
2
11
7118
16
0
37
11
6594
12
0
3
11
7102
11
0
38
11
6582
16
0
-
-
-
-
-
-
-
-
-
-
32
11
6683
19
0
67
11
5976
23
0
0
33
11
6664
16
0
68
11
5953
31
0
0
34
11
6648
18
0
69
11
5922
31
0
3. Analysis of 179 SMs of Singh et al. dataset • Singh et al. dataset [32] consist 50 normal cases (class1) and 52 tumor prostate cases (class2) with 12,625 genes. • LINGO Program3 finds the dataset consists disjoint union of 179 SMs (Signal) and 11,387 (=12625 - 1238) gene subspace (Noise) that is not linearly separable. Therefore, Program3 can select cancer genes and separate signal and noise subspace naturally. • We analyze 179 SMs with 1238 genes by common statistical analysis that are not useful for the dataset. • Because the 179 RIPs can discriminate two classes completely, we call 179 SMs as cancer gene sets in statistics. We hope the medical specialists examine our results. • Claim1: We claimed common statistical analysis could analyze SM very easy because each SM is a small sample. However, we cannot obtain useful results. 7/29/2017
3.1 Validation of 179 SMs by Discriminant Functions
Table2. Summary of NMs of 179 SMs SN Gene
logistic QDF
LDF2
LDF1
1
20
0
3
3
3
…
…
…
…
…
…
179
47
0
0
17
17
47
0
9
18
19
22.29
0
2.04
8.57
8.50
13
0
0
1
1
MAX MEAN MIN
7/29/2017
• “Gene” column is the number of genes in each SMs. • Because all NMs of logistic regression are zero, we can confirm 179 SMs are linearly separable. • The 16 NMs of QDF are zero. • “LDF2 and LDF1” are NMs of two different prior probability options of Fisher’s LDFs. • The prior probability of LDF2 is proportional to the case number of 50:52. • The prior probability of LDF1 is “1:1” that is default in much statistical software because this probability follows Fisher’s assumption.
3.1 Continue
• However, we use the former prior probability because we wish to compare NMs of six MP-based LDFs. • Twenty-nine NMs of LDF2 are greater than NMs of LDF1, and 24 NMs of LDF2 are less than NMs of LDF1. • The 126 NMs of LDF2 equal LDF1. Last three rows are the maximum, mean, and minimum of 179 SMs. • The range of Gene is [13, 47], and 179 SMs include 1238 genes. The ranges of QDF is [0, 9]. The ranges of LDF2 and LDF1 are [1, 18] and [1, 19], respectively. • Because 16 NMs of QDF are zero and only one NM of LDF2 and LDF1 is zero, QDF can discriminate more linearly separable SMs than both LDF. • Although we analyze SM by common statistical analysis, we cannot find the clear results each SM is linearly separable. • Claim2: This analysis can analyze SMs very easy. However, those are not helpful for cancer gene analysis. On the other hand, we can get useful results with the analysis of 179 discriminant scores of RIP. 7/29/2017
3.2 ANALYSIS OF 179 DISCRIMINANT SCORES • We cannot obtain useful results of 179 SM data with 102 cases by 1238 genes using common statistical methods except for logistic regression in section 3.1. • Next, we analyze 179 discriminant score data with 102 cases by 179 variables (discriminant scores of RIP) by common statistical analysis and get the next surprising success. • Above facts are very important. • The statistical discriminant functions were of no use for gene analysis at all. • Therefore, researchers used cluster analysis and t-test. • Medical researchers expected the AI based on the cluster analysis.
• Normal statistical methods can not find signs that can be linearly separated by SM. • Cluster analysis, t-test, Principal Component Analysis (PCA), and statistical discriminant functions based on variance covariance matrices except for logistic regression.
• However, cancer gene diagnosis is very easy if we analyze the RIP discriminant score data. 7/29/2017
3.2.1 Discriminant Scores and RatioSV Malignancy Index of Cancer New Statistics RatioSV = 2/SR*100 (%) Table 3. Summary of 179 Discriminant Scores Y SM2 SM179 MAX MEAN MIN
Min
Max MIN MAX
RatioSV t ( ≠)
SR
-8.58
-1
1
8.6
17.1
-266.6
-1
1
440.4
707.0
0.28
5.78
-8.2
-1
1
440.4
707.0
11.67
15.5
-33.9
-1
1
47.5
81.4
3.59 10.85
-266.6
-1
1
8.6
17.1
0.28
7/29/2017
11.67 14.57
5.78
• Table 3 is the summary of 179 discriminant scores that is sorted in descending order of RatioSV. • The “Min and Max” columns are the range of the 50 normal cases. “MIN and MAX” columns are the range of the 52 tumor cases. • The 50 normal cases are less than and equal -1 and the 52 tumor cases are greater than equal 1. • Two SVs separate 102 cases correctly. • The sixth column is the range of discriminant scores (SR). • The seventh column is “RatioSV (= 200 /SR).” • Because the distance of two SVs is two, this statistic is the ratio (%) of two SV’s distance for SR range. • We expect this statistic indicates the degree of separation of the two classes and malignancy index of cancer. • The last column is the t-values under the condition that both variances are not equal.
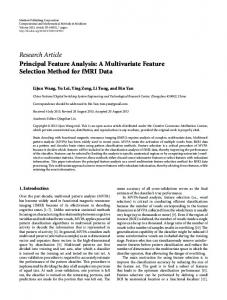
3.2.1 Continue • Because the distance of two SVs is two, RatioSV is good statistics for LSD discrimination. • We can understand two classes are separated in SM2 clearly. On the other hand, SM179 scarcely separates two classes. • The last three rows are the maximum, mean and minimum of seven variables. The range of SR, RatioSV and t are [17.14, 706.99], [0.28, 11.67] and [5.78, 15.5], respectively. • We confirmed t-values are not helpful for cancer diagnosis because those cannot find linearly separable sign as same as t-test in Section 3.1. • The “RatioSV” recommends SM2 because it is the maximum value among 179 SMs. The range of the second SM2 is [-8.58, 8.56] and its width is 17.14 (SR). We focus on SM2, nevertheless NMs of QDF, both LDF are 2, 3 and 3, respectively. 7/29/2017
3.2.1 Continue • We think RatioSV is vital statistics for the discrimination of linearly separable model. • RIP of SM2 separates two classes by 11.67% gap for SR range. On the other hand, SM179 has a minimum value of RatioSV; that is 0.28%. • Therefore, the 179th RIP may not discriminate the validation samples correctly. • Until now, there is no research on LSD discrimination. MNM is the first important statistics because it defines LSD by MNM=0 and overlapping data by “MNM>=1” clearly. • Some statisticians claim the purpose of discrimination is to discriminate the overlapping data, not LSD. However, they cannot define the overlapping data definitely because they did not have a technical term such as MNM. RatioSV is other relevant statistics for cancer gene analysis since it shows the ease of classification of two classes. • Claim3: We claim “RatioSV” is the best index for the discrimination of two classes and malignancy index of cancer. 7/29/2017
• Figure 1 is two Box-Whisker-Plots of two classes. • Left plot is SM2. Two ranges of two classes are [-8.58, -1] and [1, 8.56], respectively. • RatioSV is 11.67 % for SR. If we will examine the validation samples, RIP of SM2 discriminates two validation samples in two classes very easy. • Right plot is SM179 with minimum RatioSV. Because the RatioSV is 0.28%, RIP of SM179 may not discriminate the validation samples correctly. • Method1 will be able to validate 179 RIPs. However, because we examine two BoxWhisker-Plots of all genes do not separate two classes clearly, one-way ANOVA with t-test is not helpful for gene analysis.
7/29/2017
3.2.2 Ward Cluster Analysis and PCA •
•
W
7/29/2017
Ward Cluster Analysis
Ward Cluster Analysis
• Many statisticians analyzed the datasets by cluster analysis and could not obtain the clear results. • However, if we analyze 179 discriminant scores data, the Ward cluster separates two classes as two clusters, and both dendrograms of case and variable may be meaningful. • We expect the medical specialist will explain the medical meaning of our statistical results. • We are willing to offer the results.
3.2.2 Ward Cluster Analysis and PCA
7/29/2017
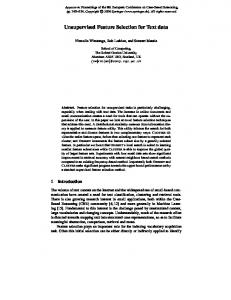
• Figure 2 is three plots of PCA. • Middle scatter plot shows two classes are completely separable. Normal 50 cases locate on minus first principal axis (Prin1). Tumor 52 cases scatter on the first and fourth quadrants that look like a fan. • Right factor loading plot locates on the first and fourth quadrants that look like a fan. Therefore, Prin1 may be useful for the malignancy degree of cancer. • The ranges of 52 tumor cases and 50 normal cases are [0.99, 22.53] and [-17.89, -4.81], respectively. Therefore, the range of SR is [17.89, 22.53]. Because SR=40.42, RatioSV = (0.99+4.81)*100/40.42 = 14.3%. Because RatioSV of SM2 is 11.67 %, the Prin1 is more reliable than the discrimination of SM2 because the Prin1 is the total judgment result of 179 RIPs.
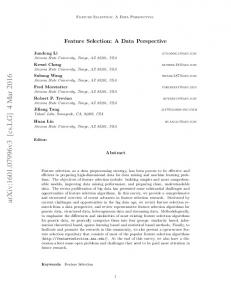
We transpose the discriminant scores data with 102 patients by 179 discriminant scores and analyze the transpose data with 179 discriminant scores (179 cases) and 102 patients (102 variables).
7/29/2017
• Figure 3 is three plots of PCA. Factor plot shows normal 50 cases locate in the 2nd and third quadrant and tumor 52 cases locate in the first and fourth quadrants. • Scatter plot shows most discriminant scores are on the line of 45 degrees with Prin1. • The 174th, 178th, 179th and other several discriminant scores are outliers. If we can cooperate with medical specialists, we can understand the different role of 179 RIPs more precisely. • If medical doctors confirm these RIPs shows the variety of cancer, we can use 179 RIPs and Prin1 as a cancer diagnosis in addition to five-year survival rate.
4. Conclusions • We solve Problem5 only 54 days because our Theory is most suitable for gene analysis. Although datasets are LSD, there is no research on LSD discrimination. • Only RIP can solve Problem1, Problem2, and Problem5. Method1 solves Problem4. RIP and Method2 solve Problem5 completely that reveals the structure of the datasets. • Although common statistical analysis can analyze each SM easily, these methods cannot find the significant facts. • However, if we analyze all discriminant scores of RIP, we can obtain the clear and surprising results. • Especially, all cases are almost on the Prin1 that shows the malignant index of cancer. We expect our research will be helpful for cancer diagnosis. • We had already obtained 130 RIPs and Prin1 for cancer diagnosis of Alon et al. dataset. • If we can discriminate new patients by these 179 RIPs, we can carry out definitive cancer diagnosis in addition to five-year survival rate. • On the other hand, discriminant functions based on variance-covariance matrices cannot solve five serious problems.
7/29/2017
New Theory of Discriminant Analysis After R. Fisher
From Cancer Gene Analysis to Cancer Gene Diagnosis • Amazon Kindl: $9.99
447 pages Free;25 June
1 New Theory of Discriminant Analysis and Cancer Gene Analysis 2 Cancer Gene Analysis of 130 BGSs of Alon et al. Microarray Dataset 3 Cancer Gene Analysis of 64 SMs of Alon et al. Microarray Dataset 4 Cancer Gene Analysis of Singh et al. Microarray Dataset 5 Cancer Gene Analysis of 69 Small Matryoshkas (SMs) of Golub et al. Microarray Dataset 6 Examination of 159 Small Matryoshka (SM) of Tian et al. Microarray Dataset 7 Examination of 95 Small Matryoshka (SMs) of Chiaretti et al. Microarray Dataset 8 Examination of 130 Small Matryoshka (SMs) of Shipp et al. Microarray Dataset 7/29/2017
9. Validation of Matryoshka Feature Selection Method by LINGO Program 1 using Common Data