Maximum Margin Matrix Factorization for Code Recommendation Markus Weimer
Alexandros Karatzoglou
Marcel Bruch
TU Darmstadt Darmstadt, Germany
INSA de Rouen, LITIS Rouen, France
TU Darmstadt Darmstadt, Germany
[email protected]
[email protected]
ABSTRACT
[email protected]
increase the quality of the final product. Apart from these obvious advantages, software frameworks also impose usage and programming patterns that can be particularly helpful in large collaborative projects. Learning to use a new framework is a time consuming task and thus programmers often resort to example code. Example finding tools have been proposed to aid in the retrieval of relevant examples. More recently, the idea of code recommenders has been proposed and investigated, e.g. in FrUiT[1]. These systems are trained on databases of working code that uses frameworks with the goal to assist the programmer by providing recommendations during programming. Ultimately, the use of such systems promotes implicit learning i.e. “learning while doing”. The systems recommend calls to methods based on the context in which the recommendation is made. In this paper, we will restrict ourselves to two contexts: (i) the class in which the recommended call shall be placed and (ii) the method in which the recommended call shall be placed. Essentially all systems studied in the literature use rule mining methods at their core. On the other hand, much of the collaborative filtering literature recently focused on factor models such as variants of the singular value decomposition (SVD). These models have been shown to perform well in the rating setting where Categories and Subject Descriptors given a (user, item) pair, a rating is predicted. Ratings on H3.3 [Information Search and Retrieval]: Information items by users are usually assumed to be natural numbers. filtering—Collaborative Filtering; G3 [Probability and Statis- However, in code recommender systems the available data tics]: Correlation and regression analysis consists of calls to methods in contexts. This data seems to be binary: given a (context, method) pair, predict whether or not the method is called within this context. However, General Terms the data is binary only with special semantics, as the abAlgorithms, Experimentation sence of a call carries less information than its presence. We can assume that most calls were placed on purpose while the Keywords absence of a call can be attributed to different reasons, e.g. explicit decisions by the programmer, harmless omissions or Collaborative Filtering, Matrix Factorization those that constitute a bug. Thus, the available data consists of positively labeled and 1. INTRODUCTION unlabeled (context, method) pairs. Data of this kind can Properly used, software frameworks and libraries lower be referred to as dyadic interaction data. This type of data the cost of software engineering, the time to market, and does not only occur in code recommender settings, but also in many more traditional recommender systems where e.g. only user purchase information is available. Contribution: We transfer the matrix factorization apPermission to make digital or hard copies of all or part of this work for personal or classroom use is granted without fee provided that copies are proach to dyadic interaction data. To this end, we built not made or distributed for profit or commercial advantage and that copies upon our research on the Maximum Margin Matrix Factorbear this notice and the full citation on the first page. To copy otherwise, to ization approach [5] and extend it by introducing two new republish, to post on servers or to redistribute to lists, requires prior specific loss functions. We demonstrate that these two loss functions permission and/or a fee. allow for a natural trade-off between recall and precision of RecSys’09, October 23–25, 2009, New York, New York, USA.
Code recommender systems ease the use and learning of software frameworks and libraries by recommending calls based on already present code. Typically, code recommender tools have been based on rather simple rule based systems while many of the recent advances in Recommender Systems and Collaborative Filtering have been largely focused on rating data. While many of these advances can be incorporated in the code recommendation setting this problem also brings considerable challenges of its own. In this paper, we extend state-of-the-art collaborative filtering technology, namely Maximum Margin Matrix Factorization (MMMF) to this interesting application domain and show how to deal with the challenges posed by this problem. To this end, we introduce two new loss functions to the MMMF model. While we focus on code recommendation in this paper, our contributions and the methodology we propose can be of use in almost any collaborative setting that can be represented as a binary interaction matrix. We evaluate the algorithm on real data drawn from the Eclipse Open Source Project. The results show a significant improvement over current rule-based approaches.
Copyright 2009 ACM 978-1-60558-435-5/09/10 ...$10.00.
309
the results obtained by the recommender system. We evaluate these algorithm improvements on real data available to a code recommender system. The remainder of this paper is organized as follows: Section 2 introduces the Maximum Margin Matrix Factorization approach as well as the two new loss functions. Section 3 contains our experimental evaluation. Section 4 concludes the paper with an analysis and possible future research directions.
2.
ommender systems in general and in our case in particular is to predict the remaining items in a row: given some calls in a context, compute a prediction for the remaining calls. In the recommender literature, this is often referred to as the new user problem. It is possible to extend Y by these new rows and perform training as suggested above. However, this approach seems wasteful. Instead, we propose to optimize the objective function (1) on the known data. It is plausible to believe that M will not change significantly for a few new rows in Y . Thus, we can compute a prediction f = uM for a new row y by solving the following optimization problem:
MATRIX FACTORIZATION MODELING
Factor models and in particular matrix factorization methods are at the core of many successful recommender system algorithms. In matrix factorization methods, the data is contained in a sparse matrix Y ∈ Rn×m where Yi,j typicaly indicates the rating of item j by user i . The basic idea of matrix factorization is to fit this matrix Y with a low rank approximation F . Here, F is computed as F = U M where U ∈ Rn×d and M ∈ Rd×m . More specifically, the goal is to find an approximation that minimizes a loss measure such as the sum of the squared distances between the known entries in Y and their predictions in F . One way of doing this is to compute a Singular Value Decomposition of Y and to use only a small number of the vectors obtained by this procedure. Note, however, that this method does not do justice to the way Y was formed, as it ignores the sparsity of Y and assumes the sparse elements of Y to have a constant value, typically 0 or some kind of average value. In [3], an alternative approach is suggested in that the aim is to find a factorization of Y in two matrices U and M such that F = U M with the goal to approximate the observed entries in Y rather than approximating all entries at the same time. Several methods to control the capacity of the model in order to prevent overfitting have been proposed. Here, we follow the Maximum Margin Matrix Factorization [4] approach where the Frobenius norm of U and M is used.
2.1
minimize l(f, y) + u
2.2
λu λm kM k2F + kU k2F 2 2
The Loss Function
In the situation at hand, Yi,j indicates whether method j has been called in context i. An entry of 0 does not necessarily indicate an incompatibility of i and j but merely the absence of a label. In that respect, our matrix factorization problem has some similarities with the supervised machine learning from positive and unlabeled data settings addressed e.g. in [2]. Additionally, the data is highly unbalanced. There are many more 0’s in the data than 1’s. Thus, minimizing the squared error as typically done in factor models will not yield good results in our scenario of dyadic interaction data: the resulting predictions will be heavily biased towards 0. We address these issues by introducing two new loss functions to matrix factorization: the weighted soft margin loss and the weighted logistic regression loss [2]. We will also introduce the gradient of the loss with respect to F here as it is needed for efficient optimization of the objective. Weighted soft margin loss: The weighted soft margin loss for matrix factorization can be defined as:
Optimization Problem
U,M
(2)
Here, l(f, y) is the loss function defined on a single row. The Frobenius norm decomposes per row to L2 norms, hence its use as the regularizer for a single row.
Above, we omitted one crucial step: how to find “good” matrices U and M in the first place. Finding the appropriate matrices U and M is achieved by minimizing the regularized loss functional where the Frobenius norm (kU k2F = tr U U > ) of the matrices U and M is used for capacity control. This leads us to the following optimization problem: minimize L(F, Y ) +
λu kuk2 2
L(F, Y ) =
n X m X
max(0, 1 − g(Yij )Fij Yij )
(3)
i=0 j=0
This assumes that we code the calls in Y with 1 and the non-calls with −1. The prediction function is the sign of the entries in F . The loss vanishes for all i, j where Fi,j and Yi,j have the same sign and ||Fi,j || ≥ 1. The weight of the positive class is introduced via ( g+ x > 0 g(x) = 1 else
(1)
Here λm and λu are the regularization parameters for the matrices M and U and the prediction F is computed as F = U M . Moreover, L(F, Y ) is a loss measuring the discrepancy between Y and F . See below in Section 2.2 for a discussion of appropriate loss functions. The optimization problem (1) can be solved exactly by using a semi definite reformulation as shown in [4]. However, its computational complexity dramatically limits the size of the problem to several thousand rows and columns in Y . While the objective function (1) is not jointly convex in U and M , it is still convex in U and M separately. Thus, we can resort to the alternating subspace gradient descent optimization procedure described in [5]. Generalization to new rows in Y : A common case in rec-
The gradient of this loss with respect to F can be computed as: ( 0 if Yi,j Fi,j ≥ 1 (δF L(F, Y ))i,j = (4) g(Yi,j )(−Yi,j ) otherwise Weighted logistic regression Often, one is not only interested in a binary decision but also in a probability thereof, e.g. to allow for proper sorting and filtering of the recommendations. In order to compute these probabilities, we transfer the results on logistic regression from the supervised machine learning setup to collaborative filtering and extend
310
140
them with a weight like for the soft margin loss above:
120
n,m
=
100
g(Yij ) log (1 + exp (−Fij Yij ))(5) # CALLS
L(F, Y )
X i,j=0
(δF L(F, Y ))ij
=
−g(Yij )Yij exp(−Fij Yij ) 1 + exp (−Fij Yij )
(6)
40 20
A good initial value for the weight parameter g + is the proportion of positively labeled data in the training data. The weight parameter provides an intuitive way of adjusting performance properties of the algorithm and in particular the level of precision and recall, as will become apparent in Section 3.
3.
0 0
600
900
1200
1500
1800
2100
2400
2700
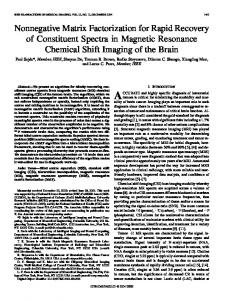
Figure 2: Histogram of the number of calls to SWT per class in Eclipse
EXPERIMENTS favors small components with small responsibilities. However, there exist more complex classes that use up to 130 different methods and unless their developers have a precise understanding of the framework their application is unlikely to function properly. The distribution of the call frequencies shows a long tail of methods that have been called very infrequently. On the other hand, 2.5 % of the methods amount to 50 % of all the recorded calls. A qualitative analysis revealed that the more frequently called methods represent the core of the SWT framework such as the UI classes. Side Note: both of these long tail distributions are commonly seen in other recommender systems. There are some users who buy or rate a lot while there is a long tail of infrequent users. The same is true for the items, some are very popular and there is a long tail of items that are only infrequently bought or rated.
The data
class A {
}
class A void foo() { Button b = new Button(); b.setText("text"); Text t = new Text(..); t.setText(..); .. class B }
Bu tt Bu on. tt ( Te .() ) Te xt ()
We chose to evaluate our system on calls from the Eclipse Integrated Development Environment to the User Interface (UI) Framework used in Eclipse, the Standard Widget Toolkit (SWT). Data extraction: As mentioned above, we perform experiments for two possible contexts of recommendation: Classes and Methods. We used the Wala toolkit1 to extract the calls from each method and class in Eclipse to SWT. These calls are then recorded in a sparse matrix Y where Yi,j = 1 indicates that a call to SWT method j was found in context i.
1
1
1
1
…
0 …
0 …
1 …
1 …
… …
3.2
Evaluation procedure
To evaluate our system, we simulated its use by a developer that asks the system for help after writing half the code in a context. To evaluate this scenario, the system is trained on 90 % of the data by minimizing the objective function (1) to obtain M . Then, it is presented with half the known calls per context in the remaining 10 % of the data. This forms the input for the system which then minimizes the objective function (2) to predict additional calls for each context. This output of the recommender system is evaluated using the information retrieval measures F 1, precision and recall. We repeated this procedure 10 times for different random samplings of the train data.
Y
Figure 1: From source code to binary vector
Figure 1 illustrates this process for class A as context. In this class, four SWT methods are called. Each of these calls is recorded in the row of Y that corresponds to class A. The matrix also shows a hypothetical class B that contains only two calls to SWT methods. Data characteristics: We found 1, 557 methods in SWT that have been called from Eclipse. We found 5, 642 methods in Eclipse that call at least one method in SWT and 2, 733 classes in Eclipse that do so. The method data contains 52, 895 calls, for the class data we recorded 41, 369 calls. Figure 2 shows the distribution of the number of calls per class. The data for the method context shows the same long tail distribution. We observe both a few classes with many calls to SWT and many classes with only a few calls to SWT. 24% of the classes in Eclipse call only a single SWT method and two thirds of the classes invoke less than 15 SWT methods. These properties can be attributed to the way modern object oriented software is constructed which 1
300
ECLIPSE CLASSES USING SWT
In this section we detail the experimental setup, the evaluation process and present the results that allow us to assess the performance of the system.
3.1
80 60
3.3
System Performance
Baseline: To evaluate the performance of our system, we implemented a baseline recommender system based on association rule mining. It was choosen as it is similar to existing code recommender systems. Results: For both the class and the method context, we performed parameter tuning on one of the ten data splits for optimal F 1 score. Table 1 shows the performance of the different loss functions of our approach in comparison to the rule based baseline. Please note that the unanswered cases, the cases for which the systems don’t suggest any call, are generally fewer for our system. We observe that our algorithm with a logistic regression loss performs best in terms of the F 1 score, closely matched
http://wala.sf.net
311
Algorithm: F1 Precision Recall Unanswered F1 Precision Recall Unanswered
Rules
Softmargin Logistic Method Context 0.68 ± 0.01 0.73 ± 0.01 0.74 ± 0.01 0.83 ± 0.02 0.72 ± 0.02 0.82 ± 0.02 0.57 ± 0.01 0.75 ± 0.01 0.68 ± 0.02 144 ± 11 118 ± 11 124 ± 8 Class Context 0.67 ± 0.02 0.73 ± 0.02 0.74 ± 0.02 0.79 ± 0.03 0.74 ± 0.02 0.78 ± 0.02 0.58 ± 0.02 0.73 ± 0.02 0.70 ± 0.02 56 ± 5 48 ± 10 50 ± 8
4.
We have shown that MMMF, one of the focuses of recent collaborative filtering research, can be used successfully for the task of code recommendation by introducing two new loss functions. One obvious future direction is to apply the method to more traditional recommender systems settings. Additionally, we will investigate the performance in the multi-framework setting where recommendations shall be made not only for a UI framework, but at the same time for multiple concurrently used frameworks. Another interesting question is whether the method or the class context perform better from an user perspective. As we have seen, prediction performance is virtually identical for both of these contexts. Lastly, the domain provides a rich feature set which can be integrated into a hybrid recommender approach. Code is well structured and thus offers well structured features. Class, control flow and other hierarchies provide an interesting field to study from the point of view of feature hierarchies. Software availability: The software developed for this paper will be made available on http://www.cofirank.org. Acknowledgements: Markus Weimer is funded under Grant 1223 by the German Science Foundation. Alexandros Karatzoglou was supported by a grant of the ANR-CADI project. We gratefully acknowledge support by the Frankfurt Center for Scientific Computing in running our experiments.
0.6
0.8
1.0
Table 1: Averaged results in terms of F 1, precision and recall over 10 runs. Note that the differences in F 1 between softmargin and logistic loss as well as the difference in precision between rules and logistic loss are not statistical significant
0.2
0.4
F1 Precision Recall
5. 2
4
6
REFERENCES
[1] M. Bruch, T. Sch¨ afer, and M. Mezini. FrUiT: IDE support for framework understanding. pages 55–59, 2006. [2] W. S. Lee and B. Liu. Learning with positive and unlabeled examples using weighted logistic regression. In Proceedings of the 20th International Conference on Machine Learning (ICML 2003). AAAI Press, 2003. [3] N. Srebro and T. Jaakkola. Weighted low-rank approximations. In Proceedings of the 20th International Conference on Machine Learning (ICML 2003), pages 720 – 727. AAAI Press, 2003. [4] N. Srebro, J. Rennie, and T. Jaakkola. Maximum-margin matrix factorization. In L. K. Saul, Y. Weiss, and L. Bottou, editors, Advances in Neural Information Processing Systems 17, Cambridge, MA, 2005. MIT Press. [5] M. Weimer, A. Karatzoglou, and A. Smola. Improving maximum margin matrix factorization. Machine Learning, 72(3), September 2008.
0.0 0
CONCLUSION
8
log(weight)
Figure 3: F 1, precision and recall for MMMF with a soft margin loss for different value of the weight parameter (on a natural log scale)
by the soft margin loss. Matrix factorization overall is significantly better than the rule based approach in terms of the F 1 score. However, both loss functions exhibit different performance characteristics. For the logistic regression loss, recall and precision differ significantly while the performance of the soft margin loss function is more balanced. Note that precision and recall are sensitive to the value of the positive weight. Thus, a desired balance between the two measures can be easily achieved by tweaking this value. Figure 3 depicts the relation between the performance measures and the weight parameter for our system with a soft margin loss. As to be expected, the value of precision decreases as the positive weight increases while the recall behaves in an inverse manner. The weight parameter thus provides a way of adjusting the performance of the system.
312