Among the most commonly used maximum performance tests are the following: ... Downloaded From: http://jshd.pubs.asha.org/ on 01/20/2014 Terms of Use: ...
Journal of Speech and Hearing Disorders, Volume 52, 367-387, November 1987
MAXIMUM
PERFORMANCE
TESTS
RAY D. KENT
OF S P E E C H
PRODUCTION
JANE F. KENT
University of Wisconsin-Madison JOHN C. ROSENBEK
Veterans Administration Hospital Madison, WI The maximum performance tests of speech production are those tests that examine the upper limits of performance for selected speech tasks. Among the most commonly used maximum performance tests are the following: maximum duration of phonation, maximum fricative duration, maximum phonation volume, maximum expiratory pressure, fundamental frequency range, maximum sound pressure level, maximum occluding force of the articulators, and diadochokinetic (maximum repetition) rate. Many clinicians use at least some of these tasks as part of an assessment protocol. These tests are analogous to strength, range, or speed tests in clinical neurology. Given the widespread use of these tests and a rather scattered literature on normative values obtained for them, a survey of the data base seemed in order. This paper summarizes the published normative data, discusses the adequacy of these data for clinical application, and recommends interpretive guidelines to enhance the usefulness of maximum performance tests.
Maximum performance tests of speech production have a long history of application in speech pathology and allied clinical fields. One important consideration in the use of these tests is the availability and adequacy of normative data. The central purpose of this paper is to summarize the relevant normative data in the archival literature. In addition, the published data base will be considered with respect to its adequacy for clinical application. Specification of clinical testing procedures and clinical data interpretation are not within the scope of this paper, although some clinical implications of the normative data base are described. The chief rationale for this paper is that an examination of the normative data base is a preliminary, but necessary, step in the continued development of state-of-the-art clinical procedures. Testing methods per se are discussed primarily as they relate to evaluation of the normative data base and to basic issues of calibration and measurement. In a paper in progress, we are examining issues other than the normative data base that relate to the clinical use of maximum performance measures. For each of the most commonly used measures of maximum performance, this review summarizes the published normative data. In addition, primary task variables are identified, and guidelines for data interpretation are offered. Units of measurement are those of the International System (Systeme International d'Unites). Conversions for different systems of units are given in the Appendix.
the maximum volume of air used during a phonatory task such as sustained vowel phonation. The subject is instructed to inhale maximally and then to phonate for as long as possible. T h e phonation usually is done with a normal or habitual pitch level and a moderate vocal effort. Essentially, phonation volume is the subdivision of lung volume that can be used to support a maximally sustained phonation. Phonation volume varies with vital capacity (VC). Yanigahara and yon Leden (1967) and Kelman, Gordon, Simpson, and Morton (1975) reported that for normal adults, phonation volume bears a linear relationship with VC. The linear equations are as follows: Yanigahara and von Leden: MPV = 0.86 VC - 0.891 (liters); Kelman et al.: MPV = 0.64 VC + 0.22 (liters). Beckett (1971) recommended calculation of the maximum predicted phonation time with the following formulas: Males: VC/100 x 0.67; Females: VC/100 x 0.59. VC, in turn, can be predicted from a subject's age, sex, and height. Several predictive equations have been given in the literat~re; but fotmulas of Baldwin, Courand, and Richards (1948) seem to be among the most frequently cited: VC (for males) = (27.63 - 0.112 x Age) x Height; VC (for females) = (27.78 - 0.101 x Age) x Height.
Phonation Volume (PV)
Other formulas for subjects of various ages and either sex were compiled by Altman and Dittmer (1971, pp. 36-37). However, the clinical interpretation of pulmonary function measurements is hindered by the large variance in
Volume measurements are made with a spirometer or by integrating the airflow information obtained with a device such as a pneumotaehograph. Phonation volume is © 1987, American Speech-Language-Hearing Association
367
Downloaded From: http://jshd.pubs.asha.org/ on 01/20/2014 Terms of Use: http://asha.org/terms
0022-4677/87/5204-0367501.00/0
368 Journal of Speech and Hearing Disorders the normative data base. As pointed out by Glindmeyer (1981), the predicted values from different published studies vary by as much as 20% for an individual subject. In a recent study of 2,454 nonsmoking White adults aged 25-74 years, Doekery et al. (1985) concluded that forced expiratory volume in 1 s (FEV1) and forced vital capacity (FVC) can be standardized for body size by dividing each measurement by the square of the standing height. Both pulmonary function measurements were fitted to a fourparameter normative model: FEV1 = HT 2 (1.541 - 0.209 Sex - 0.00406 Age 0.0000614 Age2); FVC = HT 2 (1.750 - 0.287 Sex - 0.000135 Age 0.0001008 Age2), where FEV1 and FVC are in liters, height (HT) is in meters, age is in years, and sex is 0 for men and 1 for women. One advantage of dividing the pulmonary function measurements by height squared is that this calculation permits a simple two-dimensional graph of the lung function-age relationship. The striking feature of this graph is the overall reduction of pulmonary function with advancing age. Thus, lung function, and any tasks dependent on it, are predicted to decline as an adult ages. Empirically determined values for phonation volume are less than the subject's vital capacity, with the estimates of phonation volume falling in the following percentages of VC: Bless and Hirano (1982a), 93% for men and 91% for women; Inglis (1977), 88% for men and 89% for women; Isshiki, Okamura, and Morimoto (1967), 68.7°70--94.5%; Yanagihara and Koike (1967), 50070--80% for men and 45070-75% for women; Taylor (1980), 85% for men and 89% for women.
Maximum Phonation Duration (MPD) MPD is measured as the greatest length of time over which phonation can be sustained for a vowel sound, typically/a/, though/i/arid/u/sometimes are used as well. This measure is sometimes called maximum phonation time. In terms of the underlying respiratory and phonatory mechanics, the MPD task requires that the subject expend the maximum volume of air available for phonation (see phonation volume) during an effort of sustained phonation. MPD normally is affected by the same factors that determine phonation volume, especially vital capacity, which in turn varies with age, sex, and stature. Additionally, MPD depends on the airflow through the larynx. For a given phonation volume, different MPD values will be obtained depending on the airflow, or time derivative of volume. A speaker who wastes air (i.e., has a large airflow) will have a shorter MPD than a speaker who has the same phonation volume but a lower value of airflow. MPD, by itself, cannot be used to distinguish a deficit in respiratory support (reduced phonation volume) from an inefficiency in vocal
52 36%387
November 1987
fold vibration (high airflow). The s/z ratio, to be discussed in the following section, is one measure that has the potential to distinguish between defieiency of respiratory support and inadequacy of laryngeal valving. Because MPD covaries with phonation volume and airflow, discussion of MPD necessarily is based on an understanding of the latter variables. Phonation volume was considered earlier in this paper. Airflow during phonation has been described in several published reports, and a reasonable data base is available to establish norms for at least some age-sex groups. Normative data on phonation airflow are summarized in Table 1. Considering first nongeriatric men and women, it is clear that airflow is sex dependent. Men have somewhat greater airflows than women. Hirano, Koike, and von Leden (!968) reported that for their sample of 50 normal subjeets, critieal-value ranges were 46-222 ec/s for men and 43-197 ec/s for women. Some lower limit of airflow is needed to sustain phonation. Estimates of this lower limit are 33.3 cc/s (Cavagna & Margaria, 1968), 65 cc/s (Van den Berg, 1956), and 30 cc/s (V6gelsanger, 1954). The upper limit of airflow is reached under extremely breathy phonation or, of course, in whispering when phonation per se ceases. Normal whisper has a mean airflow of about 400 cc/s (von Leden, 1968). Airflows in vocal pathologies may exceed 800 cc/s (von Leden, 1968). The results of Murry and Schmitke (1975) indicate that the pattern of airflow (i.e., its time course) during sustained phonation may be a useful characteristic to note clinically. Another useful measure of laryngeal aerodynamics is laryngeal airway resistance, which can be estimated with noninvasive procedures described by Smitheran and Hixon (1981), Resistance is calculated simply as the ratio of translaryngeal pressure to translaryngeal flow. It is conventionally expressed in centimeters H20/LPS. Normative means for laryngeal airway resistance range from about 34 to 40 em H20/LPS (Kunze, 1962; Sant & Logemann, 1970; Shipp & MeGlone, 1971; Smitheran & Hixon, 1981). Normative data on MPD are collected in Table 2. Clearly, MPD varies with subject age and sex. Variability is large. For example, the data for 6-year-olds in the Harden and Looney (1984) study range from 3.8 to 30.6 s. The coefficient of variation (standard deviation divided by the mean) does not appear to vary systematically with age, except that higher values occur for the 6-year-olds and the geriatric subjects. I f one follows the guideline sometimes recommended in the clinical literature that children should have MPDs of about 10 s and that men should have MPDs of about 20 s, then a number of the normal subjects in these studies would be judged to be deficient. Another shortcoming of this guideline is that it neglects the speaker's age and height, both of which relate to lung volume and therefore determine MPD. Relatively little attention has been given to the effect of praetiee on maximum performance tests. One exception is in the study of maximum phonation duration. Many of the results do not offer much support for the stability of this measure over fewer than 10 trials. Neiman and Edeson (1981) determined that the mean trial number on which
Downloaded From: http://jshd.pubs.asha.org/ on 01/20/2014 Terms of Use: http://asha.org/terms
KENT ET AL.: Maximum Performance Tests
369
TABLE 1. Normative values for airflow (ce/s) during sustained vowel phonation. Values rounded to units.
Source
Subject sample
Bless & Hirano (1982a)
60 normal adults
Hirano et al. (1968)
50 normal adults
Iwata, von Leden, & Williams (1972) Kelman, Gordon, Morton, & Simpson (1981) Koike & Hirano (1968)
50 normal adults
von Leden (1968)
Normal adults using "easiest phonation" Normal subjects using whisper 5 normal adults
yon Leden (1968) Morgan & Gilbert (1984) Yanagihara &von Leden (1967) Beekett, Thoelke, & Cowan (1971
Sex
M
SD
Range
M F M F M F
160 162 101 92 --126
37 47 ----24
85-252 62--249 46-222 a 43-197 a 86-117 79-107 83-183
M F M F
112 94 141 119
36 32 22 25
37-237 37-187 109-182 76-172
413
72
340-585
2M, 3 F
98
21
73-127
M F
110 110 96 72
30 32 23 20
51-128 46--115
"Normal controls" 42 normal adults
Normal subjects Boys--mean age 7.55 years Girls--mean age 7.56 years
aCfitical region (95%). adult subjects achieved MPD was 5.1 when the examiner modeled the task and 9.85 when the task was not modeled. Stone (1983) reported that the maximum phonation durations of 21 adults varied considerably with trial number. The group data showed increases in maximum phonation duration up to the 15th trial, the highest trial number reported. Stone concluded from questioning of the subjects that they gave less than maximum performance in the early trials, but "with their desire to do better," they improved their performance in repeated trials. Stone considered this evidence as grounds to question the validity of this measure--and perhaps any test of laryngeal performance requiring maximum effort. Improved performance on maximum phonation duration with repeated trials has been demonstrated for children by Lewis, Casteel, and McMahon (1982) and Finnegan (1984, 1985). Lewis et al. reported that at least 10 trials were needed before 50% of the subjects achieved maximum effort in the task. Finnegan reported the trial number equal to or greater than the mean of the three longest phonations. The mean trial number for boys was 8.6; for girls it was 7.6. A cumulative frequency distribution showed that only 16.2% of the boys and 23% of the girls achieved their maximum effort by the 3rd trial. Finnegan remarked that maximum performance on this task may require repeated trials, visual feedback, careful instructions, and encouragement to the subject. It would appear from the data of Stone (1983), Lewis et al. (1982), and Finnegan (1984) that no fewer than 10 trials are needed to yield a stable maximum result for the maximum phonation duration task. This number of trials may not be practical for some individuals, especially those who are taxed by this effort. When it is not possible to measure maximum phonation duration for a minimum of 10 trials, the examiner
should report the number of trials actually used [e.g., in a notation like MPD (5 trials) = 12.6 s]. In contrast to these results indicating that 10 or more trials are needed for a valid assessment of MPD, Sawashima (1966) and Bless and Hirano (1982b) reported that 3 trials were sufficient, provided that proper instructions and practice were given the subjects. Perhaps if care is taken to instruct and encourage subjects, MPD can be adequately assessed with as few as 3 trials. Reich, Mason, and Polen (1986) reported that coaching and instruction resulted in a mean increase in MPD of 5.2 s for the third-grade girls in their study. Depending on the circumstances, the usual procedure of obtaining maximum phonation duration (i.e., asking the subject to perform 3-5 trials) may underestimate the actual maximum duration that could be recorded under ideal conditions. The improvement of performance over as many as 15 trials may indeed prompt one to question the validity of this "maximum" performance measure. Nonetheless, the test may still have clinical utility as a screening procedure if it is recognized that the object is to determine if the client can reach some minimal standard duration (e.g., 10 s for a child, 15 s for a young woman, and 20 s for a young man). If the client's maximum effort falls below this standard, the data reviewed above are good reason to repeat the test, perhaps several times. Stable performance over repeated trials or performance judged to be adequate tells the clinician when to stop. Repeating trials to 10 or more may tax the subject and may be a poor use of clinical time relative to the value of the information obtained. Whatever interpretation might be made of the MPD measure, the sustained vowel phonation on which MPD is based offers several other opportunities for analysis of
Downloaded From: http://jshd.pubs.asha.org/ on 01/20/2014 Terms of Use: http://asha.org/terms
370
Journal of Speech and Hearing Disorders
52 367-387
N o v e m b e r 1987
TABLE 2, Normative data on maximum phonation duration (in seconds except for the coefficient of variation, C, which is dimensionless) for vowel/a/. M = male; F = female,
Source
Subjects
Sex
M
SD
Harden & Looney (i984)
6-year-olds
M F
10.4 10,6
5.1 6.3
3.8 -16.8 6.2 -30,6
.49 .59
Beckett et al. (1971)
7-year-olds
M F
14,2 15.4
3.3 2.7
12.0 -22.0 910 -19.0
.23 .175
Finnegan (1984)
3-year-olds 3-year-olds
M F
7.9 6.3
1,81 1.76
4.38-11.46 2.84- 9.72
,23 ,28
4-year-olds 4-year-olds
M F
10.0 8.7
2,51 1.84
5.08--14.90 5,26--12,46
.25 .21
5-year-olds 5-year-olds
M F
10,1 10.5
3.05 2.57
4.15-16.09 5.44-15,50
,30 .24
6-year-olds 6-year-olds
M F
13.9 13,8
2.98 3.65
8.06-19.74 6.66-20.96
.21 .26
7-year-olds 7-year-olds
M F
14.6 13.7
2.82 2.45
9.11-20.15 8.88-18.48
.19 .18
8-year-olds 8-year-olds
M F
16.8 17.1
4.51 4,62
7.98-25.64 8.07-26.17
.27 .27
9-year-olds 9-year-olds
M F
16.8 14.5
6,07 3,78
4,94-28,72 7.07-21.87
.36 .26
10-year-olds 10-year-olds
M F
22.2 15.9
4.74 5.99
12,91-31,49 4,14-27.62
.21 .38
11-year-olds 11-year-olds
M F
19.8 14.8
3.79 2.06
12,43-27.27 10.73-18.79
.19 .i4
12-year-olds 12-year-olds
M F
20,2 15.2
5.72 3.87
13-year-olds 13-year-olds
M F
22,3 19.2
8.19 4.58
6.29-38.29 10.27-28.21
.37 .24
14-year-olds 14-year-olds
M F
22.3 18.8
6.89 5.15
8.84-35.84 8.76-28.94
.31 .27
15-year-olds 15-year-olds
M F
20.7 19.5
5,32 4,66
10.32-31.16 10.40-29.93
.26 .24
16-year-olds 16-year-olds
M F
21.0 21.8
4,40 4.47
12.43-29.66 13.09-30.61
.21 .20
17-year-olds 17-year-olds
M F
28.7 22.0
7.08 6.30
14,83-42,57 9,65-34,33
.25 .29
8-year-olds 8-year-olds
M F
20.0 19.1
-
11.5 -24,5 11.9 -23,0
10-year-olds 10-year-olds
M F
24.9 16.5
-
15,9 --39.0 12.9 -21,8
Lewis et al. (1982)
p h o n a t o r y function. It is b e y o n d the scope and p u r p o s e of this p a p e r to c o n s i d e r t h e m in detail, b u t several p o s s i b l e analyses are d e s c r i b e d in the literature. I f a s p e c t r o g r a p h is available, t h e n spectrograms can b e u s e d to d e s c r i b e or m e a s u r e various features of the acoustic pattern (Rontal, Rontal, & Rolnick, 1975; Yanagihara, 1967). Vocal tremor, noise, voice breaks, and other irregularities are features to b e noted. U s i n g a graphic level recorder, the noise level
Range
9.0"2--31.44 7,58-22.74
C
.28 .25
in the s p e c t r u m can b e e s t i m a t e d to d e r i v e the spectral noise level (SNL), d e f i n e d as the l o w e s t p e a k marking of the graphic level r e c o r d e r stylus in each 100-Hz section of the s p e c t r u m (Arnold & E m a n u e l , 1979; E m a n u e l , Lively, & McCoy, 1978; E m a n u e l & Sansone, 1969; E m a n u e ] & W h i t e h e a d , 1979; H a n s o n & E m a n u e l , 1979). Perturbations in f u n d a m e n t a l f r e q u e n c y (jitter) and amp l i t u d e (shimmer) also can b e d e r i v e d from the s u s t a i n e d
Downloaded From: http://jshd.pubs.asha.org/ on 01/20/2014 Terms of Use: http://asha.org/terms
KENT ET AL.: M a x i m u m Performance Tests
371
TABLE 2. continued
Source
Subjects
Sex
M
SD
Williams (1977)
8-year-olds 8-year-olds
M F
13.3 13.6
2.5 5.2
-
.19 .38
11-year-olds 11-year-olds
M F
17.8 15.8
4.7 4.1
-
.26 .26
10-year-olds 10-year-olds
M F
20.2 15.1
4.7 4.3
-
.23 .28
Reich et al. (1986)
8.5-10.4 years
F
14.3
4.69
-
.33
Ptacek & Sander (1963)
Young adults
M F
22.6 15.2
8.1 5.0
9.3-43.3 6.2-28.4
.36 .33
Ptacek et al. (1966)
Young adults
M F
24.6 20.9
6.7 5.7
12.5-36.0 11.8--32.0
.27 .27
Kreul (1972)
Young adults
18.2
4.3
Child (1979)
Hirano et al. (1968)
Range
-
C
.24
Adults
M F
34.6 25.7
-
Inglis (1977)
Young adults
M F
24.8 22.8
8.4 4.1
-
.34 .18
Taylor (1980)
Young adults
M F
28.0 22.9
8.9 5.8
-
.32 .25
Neiman & Edeson (1981)
Young adults
M F
29.0 19.6
5.5 4.7
-
.19 .24
Yanagihara & Koike (1967)
Young adults
M F
30.2 22.5
9.7 6.1
20.4-50.7 16.4-32.90
.32 .27
Bless & Hirano (1982b)
Young adults
M F
33.6 26.5
11.4 11.3
16.7-58.4 11.6--60.5
.34 .43
20.6a
-
14.8-42.4
-
Canter (1965)
Men (35-75 years)
15.0-62.3 (CR) 14.3-40.4 (CR)
Kreul (1972)
Aged M (65-75 years) F (66--93 years)
14.6 14.6
5.9 5.8
-
.40 .40
Ptacek et al. (1966)
Aged M (68-89 years) F (66-93 years)
18.1 14.2
6.6 5.6
10.0-37.2 7.0-24.8
.36 .39
Mueller (1971)
Aged M (51-65 years) F (49-72 years)
13.0 15.4
-
-
-
Mueller (1982)
Aged M (85-92 years) F (85-96 years)
13.0 10.0
-
7.0-12.0 6.9-18.0
-
Note. CR = critical region. "Median. phonation. Normative data are available in several papers (e.g., Hollien, Michel, & Doherty, 1973; Horii, 1979, 1985; Klingholz & Martin, 1985; Koike, 1973; Ramig & Ringel, 1983; Sorenson & Horii, 1984). For sustained vowel p h o n a t i o n in the modal register, jitter averages about 1% a n d s h i m m e r averages about 0.5 dB. Kojima, Gould, Lambiase, a n d Isshiki (1980) used F o u r i e r analysis to derive a signal-to-noise (S/N) ratio; a n d Yumoto, Gould, and Baer (1982) d e s c r i b e d a harmonics-to-noise (H/N) ratio for voice analysis. Finally, digital processing t e c h n i q u e s can be u s e d to derive several measures of
voice function (Davis, 1976). See J o h n s o n (1984) for a helpful review of voice analyses. Another voice analysis tool is the phonetogram, which describes the f u n d a m e n t a l f r e q u e n c y and i n t e n s i t y ranges of a voice and is therefore a portrayal of vocal m a x i m u m performance. This a n a l y s i s - - w h i c h also has b e e n n a m e d a voice profile, voice field, voice area, and fo/SPL profile--is discussed further in c o n j u n c t i o n with m a x i m u m vocal i n t e n s i t y (to follow). S o n n i n e n , H u r m e , T o i v o n e n , a n d Vilkman (1985) d e s c r i b e d a voice field description of vowel phonation. T h e voice field is a plot
Downloaded From: http://jshd.pubs.asha.org/ on 01/20/2014 Terms of Use: http://asha.org/terms
372 Journal of Speech and Hearing Disorders
52 367--387
of the amplitude of each pitch period versus the frequency for that period. The display is automatically plotted by computer. A phonation that is stable in both its amplitude and frequency characteristics has a narrow scatterplot. With instability in amplitude, frequency, or both, the scatterplot widens. The use of other methods of examination--such as electroglottography, endoscopy, and detailed airflow recordings-increases substantially the number of useful measures of vocal function (Ludlow & Hart, 1981). Sustained phonation also gives information on supraglottal control. Gerratt (1983) evaluated vowel formant frequency variability from sustained vowel phonations of normal speakers and speakers with tardive dyskinesia. The two groups were observed to be significantly different on measures of formant frequency variability. Useful variability measures include the standard deviation of consecutive measures of formant frequency, mean formant frequency fluctuation (the average of the consecutive pair differences in formant frequency), and the formant frequency fluctuation ratio (the mean formant frequency fluctuation divided by the mean formant frequency, with the quotient multiplied by 1,000).
M a x i m u m Fricative Duration and the s/z Ratio A variant of the task of sound prolongation was suggested by Boone (1977) as a clinical means of separating respiratory and laryngeal factors contributing to a phonation problem. He proposed the use of a voiceless/voiced sustained production ratio based on the sounds/s/and/z/. Boone noted that subjects with vocal fold pathology (e.g., thickening, polyps, or nodules) generally perform normally on the voiceless sound but abnormally on the voiced sound. That is, the voieeless/voieed ratio will be around unity for speakers with normal phonatory mechanisms but larger than unity for individuals with laryngeal pathology. Normative data on the voiceless/voiced ratio were reported by Tait, Michel, and Carpenter (1980). Their
results for 5-, 7-, and 9-year-old children are summarized in Table 3. Tait et al. concluded that, "five year olds can sustain/s/for just over 8 sec, seven year olds for about 10 see, and nine year olds for almost 16 sec" (p. 244). The voiceless/voiced ratios based on t h e / s / a n d / z / p r o d u c tions did not differ significantly between boys and girls or with differences in age. Generally the duration o f / z / exceeded that f o r / s / s o that the overall mean voiceless/ voiced ratio was 0.87 (median = 0.85). Tait et al. regarded the stability of the ratio as a promising feature for its clinical application. (Results in general agreement with those of Tait et al. have been reported by Workinger,
1986.) Sustained fricative productions may be useful to assess the stability of the forces developed by the tongue muscles (von Cramon & Ziegler, in press). Sustained, stable production of fricatives requires a reliable regulation of the muscle forces that produce the aerodynamic conditions of turbulence. Motor disorders can result in instabilities of intensity, spectrum, or both. Hence, the task of fricative prolongation can contribute information on both phonatory and articulatory performance. Regarding the latter, it can be useful to assess sustained production for different places of fricative production, especially labiodental (/f/ and /v/), interdental (/0/and/6/), alveolar (/s/ and /z/), and palatal (/J'/ and /3/). Normative data reported by Eckel and Boone (1981) for 86 individuals with normal voice also are shown in Table 3. The subjects ranged in age from 8 to 88 years (mean of 27.7 years). The results of Eckel and Boone are in general agreement with the Tait et al. (1980) data for 9-year-old boys. It cannot be determined from the published data whether the maximum durations o f / s / a n d / z / a r e significantly reduced with advanced age, but such reduction is predicted given the age-related losses in pulmonary function and the likely decrease in laryngeal effleiency. It also is likely that maximum durations o f / s / a n d / z / w i l l , like maximum phonation duration, increase with repeated trials. Finally, it should be noted that the s/z ratio and the maximum durations on which it is based are highly
TABLE 3. Normative data on maximum/s/and/z/duration and the s/z ratio (all values in seconds).
Source
Subjects
Maximum/s/ duration M SD Range
Taitetal. (1980) Girls, 5years Boys, 5years
8.3 7.9
Girls, 7years Boys, 7years Girls, 9years Boys, 9years Mixed ages, both sexes Sedate geriatrics Active geriatrics
Eckel & Boone (1981) Young & Bless (1983)
November 1987
Maximum/z/ duration M SD Range
s/z ratio
M
Range
4.0 4.8-18.3 10.0 3.3 1.4 5.4- 9.8 8.6 2.1
5.2-16.0 6.6-13.0
0.83 0.50-1.14 0.92 0.82-1.08
10.2 9.3
2.6 7.3-16.0 1.7 7.4-12.5
13.1 4.0 13.2 3.6
9.1-20.0 9.2-19.6
0.78 0.51-1.10 0.70 0.52-0.97
14.4 16.7 17.7
3.1 9.3-20.9 8.5 7.1-44.0 7.6 5-38
15.8 5.2 8.5--24.2 0.91 0.75-1.26 18.1 6.8 10.1-33.1 0.92 0.66-1.50 18.6 7.0 5-37 0.99 0.41-2.67
14.7
4.4 7.7-21.6
19.3 8.4 10.'2--35.6 0.76
-
20.2 13.4 6.4-51.3
24.5 8.0 14.7-36.6 0.82
-
Downloaded From: http://jshd.pubs.asha.org/ on 01/20/2014 Terms of Use: http://asha.org/terms
KENT ET AL.: Maximum Performance Tests variable. This variability m u s t be c o n s i d e r e d in clinical application of this task.
F u n d a m e n t a l Frequency Range (FFR)
Max
Hz )
rb i ?(0"
to
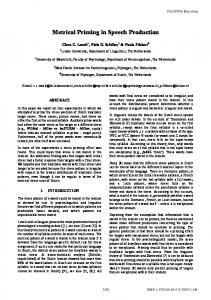
F F R is the range of a speaker's f u n d a m e n t a l frequency, from lowest to highest. T h e term physiological frequency range is also used, especially w h e n the m a x i m u m p h o n a t i o n a l range is to b e d i s t i n g u i s h e d from the musical f r e q u e n c y range or the speaking f r e q u e n c y range. F F R can b e d e t e r m i n e d for different vocal effort levels, b u t a moderate level is typically used. F F R should encompass the f u n d a m e n t a l f r e q u e n c i e s over all three registers (pulse or vocal fry, modal or chest, falsetto or loft) b u t at the m i n i m u m m u s t span the f u n d a m e n t a l f r e q u e n c y range of the modal register. T h e range is normally expressed in either hertz or semitones. F F R is c o m b i n e d with a m e a s u r e of vocal i n t e n s i t y range in the p h o n e t o g r a m , discussed in a later section on m a x i m u m vocal intensity. As a rule of t h u m b , the F F R for adults should extend over a b o u t 3 octaves. Representative normative data on F F R are p r e s e n t e d in T a b l e 4 and Figures 1 and 2. T h e data in T a b l e 4 p e r t a i n to the total F F R (also called total pitch range) a n d encompass the three registers of the voice. Variability is rather large, particularly in the Hollien, Dew, a n d Philips (1971) study, which reported results for 332 m e n and 202 w o m e n . Although a F F R of a b o u t 3 octaves may be taken as an estimate of the m e a n range, m a n y normal voices will fall short of this range. O n e of the few p u b l i s h e d studies on the d e v e l o p m e n t of the F F R in c h i l d r e n is that of Van Oordt and Drost (1963). T h e y s t u d i e d 45 c h i l d r e n in the age range 0 - 5 years and 81 c h i l d r e n aged 6 - 1 6 years. T h e F F R varied from about 1 octave to a b o u t 3V2 octaves. T h e majority of the c h i l d r e n had a F F R of at least 2 octaves, a n d about a quarter of the c h i l d r e n in the older group had a range w i d e r than 3
mum
cO kv
i i
i
i
~
i
i
i
i
i
Ptacek et al. (1966) Ptacek et al. (1966) Hollien et al. (1971) Colton & Hollien (1972) Coleman et a]. (1977) Ramig & Ringel (1983)
Pederson et al. (1986)
,
i
i
J_]
18
131 T
16
E 14 E 12
~ 65 .J
1:2
:E
EVA
. . . . . .
218
24
I
I
I
I
I
32 Maximum
I
I
36
'
I
,
,~'i ~
E c ~"
40
(Tones)
FIGURE 1. Vocal fundamenta] frequency ranges of men shown in a contour graph. The data for an individual subject would appear as a point on the graph with the abscissa value of the point representing the maximum frequency (in Hz or tones re 16 Hz) and the ordinate value of the point representing the minimum frequency. Three levels of shading are shown corresponding to the density of the data for 332 men: diagonal lines--lightest density; cross-hatched diagonals--moderate density; blackened region--heaviest density. Each region can be regarded as a probability region. From "The Registers and Ranges of the Voice" by H. Hollien in Approaches to Vocal Rehabilitation edited by M. Cooper and M. H. Cooper, 1977, Springfield, IL: Charles C. Thomas. Copyright 1977 by Charles C. Thomas. Adapted by permission. octaves. Van Oordt a n d Drost c o n c l u d e d that "although the P F R [physiological f r e q u e n c y range] does increase with increase in age, the increase is very l i m i t e d " (pp. 293-294). T h e stability of the total p h o n a t i o n a l f r e q u e n c y range in normal adult subjects was studied b y Gelfer (1986). She reported a m e a n variation of + / - 2 semitones w i t h i n a day and a somewhat greater variation over 4--6 weeks. Generally, the intxasubject variation in the total fundam e n t a l f r e q u e n c y range can b e expected to be about two to four semitones.
TABLE 4. FFR (pitch range) in semitones in several studies. Ramig and Ringel classified their subjects into good condition and poor condition groups based on resting heart rate, resting systolic and diastolic blood pressure, percentage of fat, and forced vital capacity-.
Source
373
Subjects
M
SD
Young men Geriatric men Young women Geriatric women Young men Young women Male singers Male nonsingers Young men Young women Young men (good cond.) Young men (poor cond.) Mid-age men (good cond.) Mid-age men (poor cond.) Geriatric men (good cond.) Geriatric men (poor cond.) Boys 8.7-12.9 years Boys 13-15.9 years Boys 16--19.5 years
34.5 26.5 32.8 25.1 37.9 37.0 34.9 33.3 37.1 37.4 32.2 26.6 28.3 26.8 31.4 24.3 34.4 37.5 41.4
5.2 6.5 4.4 7.9 5.0 5.3 8.8 7.1 8.7 3.6 4.4 7.1 -
Downloaded From: http://jshd.pubs.asha.org/ on 01/20/2014 Terms of Use: http://asha.org/terms
Range 23--47 11-35 20-40 9-41 13-55 23-50 28.9---43.8 30.6--42.2 -
374 Journal of Speech and Hearing Disorders Maximum
_v4~, 22
v
,
i
fo
i
52 367-387
(Hz)
, ..o
"1
t
~ 1
20
~N o
O
18 E
E
16
rt-
.-
~
z r-
z].~
t
30
J
I
l
~ i
34
I
J
I
38
i
i
i
J
i~
42
Maximum fo (Tones) FIGURE2. Vocal fundamental frequency ranges of women shown in a contour graph. The data for an individual subject would appear as a point on the graph with the abscissa value of the point representing the maximum frequency (in Hz or tones re I6 Hz) and the ordinate value of the point representing the minimum frequency. Three levels of shading are shown corresponding to the density of the data for 202 women: diagonal lines-lightest density; cross-hatched diagonals--moderate density; blackened region--heaviest density. Each region can be regarded as a probability region. From "The Registers and Ranges of the Voice" by H. Hollien in Approaches to Vocal Rehabilitation edited by M. Cooper and M. H. Cooper, 1977, Springfield, IL: Charles C. Thomas. Copyright 1977 by Charles C. Thomas. Adapted by permission. The FFR is considerably larger than the pitch ranges reported for conversation or reading (Graddol, 1986; Johns-Lewis, 1986; Mclntosh, 1939; Mysak, 1959; Philhour, 1948). Depending upon the estimate selected for comparison, the typical range used during oral reading or conversation can be from 1 to 2V2 octaves smaller than FFR.
M a x i m u m Expiratory Pressure (PEmax)
PEmax (also called maximum intraoral air pressure) is the greatest value of air pressure that can be developed in the oral cavity after a maximal inhalation of air. The pressure recording can be made with a balloon or openended tube placed within the oral cavity. An oral seal can be made with the lips or the tongue. A pressure transducer connected to the sensing element transduces the air pressure to a voltage. Alternatively, PEm~x can be measured with a nonelectric device such as a simple u-tube manometer filled with water or mercury. Pressure is then recorded by noting the displacement of a column of liquid. In the International System of Units, the unit of pressure measurement is the pascal, Pa (1 Pa = 1 N/m2). Because much of the data on air pressures in speech is reported in units other than paseals, the values given in this review are expressed in both centimeters H20 and pascals. (Conversion factors are given in the Appendix.) Published data on PEma~ are summarized in Table 5. The values vary considerably across studies. For example, the means for nongeriatrie men range from 12.7 kPa in the Wilson, Cooke, Edwards, and Spiro (1984) study to 20 kPa or higher in the studies by Black and Hyatt (1969) and Ringqvist (1966). Large differences across studies
November 1987
also are observed in the data for women. Effects of age and sex are readily apparent despite the variability in reported means. It appears that PEm~ increases from childhood to adulthood and then declines into the geriatric years. This life-span pattern is consistent with that for other measures ofpulmonic function (Britt et al., 1981; Doekery et al., 1985). Wilson et al. (1984) developed prediction equations from which PEm~ in centimeters H20 could be calculated from data on age in years, height in centimeters, and weight in kilograms. The primary predictor variables were age for men, height for women, and age for boys and girls aged 7-17 years. Men: PE .... = 180 - (0.91 x Age). Women: PEm~ = 3.5 + (0.55 x Height). Boys: PEmax = 35 + (5.5 x Age). Girls: PEm~ = 24 + (4.8 x Age). The subject task from which PEmax is measured can present health risks. Some of the risks noted in the literature are pneumothorax and interstitial emphysema (Rahn, Otis, Chadwick, & Fenn, 1946) and spontaneous nose bleeding and conjunctival hemorrhages (Ringqvist, 1966). The risk increases with task repetition, which poses a risk/benefit problem for the examiner. It appears from the results of Ringqvist et al. that measurements of PEm~ improve over trials, with some subjects producing their best efforts after 20 or so attempts. Thus, repeated trials may be needed to obtain a valid measure of maximal performance. On the other hand, the examiner cannot ignore the increased risk to subjects as the task is repeated. Wilson et al. (1984), although acknowledging that their normative data for PEm~ fell appreciably below the values of Ringqvist (1966), nevertheless concluded that "the measurement of maximal respiratory pressure allows a simple, reproducible, and rapid assessment of respiratory muscle function which is extremely useful in following the progression of respiratory weakness in patients with neuromuscular disease" (p. 538). For PE . . . . as with MPD, the clinician must decide if a truly maximal measurement justifies increased examination time and increased discomfort and risk to the subject. PEm~x greatly exceeds the subglottal pressure head for speech, which is typically between 1.3 and 2.2 kPa (6--10 cm H20) for conversational effort levels (Warren, 1982). Thus, young men are capable of PEm~x values about 10 times larger than those used for normal speaking. However, it is interesting that the low end of the PEmax range for geriatric men and women in the study of Ptacek, Sander, Mahoney, and Jackson (1966) barely exceeds the subglottal pressure head of normal conversational speech.
M a x i m u m Vocal Intensity or S o u n d Pressure Level (SPL) Maximum vocal intensity or SPL is a measure of a speaker's greatest magnitude of vowel output, typically determined for a sustained phonation of vowel/a/. Recent
Downloaded From: http://jshd.pubs.asha.org/ on 01/20/2014 Terms of Use: http://asha.org/terms
KENT ET AL.: Maximum Performance Tests
375
TABLE 5. Values of PEmax in cm HeO and kPa for four subject groups: men, women, boys, and girls.
Subject group
Age range (years)
Men n = 60
20-54
n = 31
18--39
n = 27
68-89
n = 2,614
-
n = 100
18--83
n = 48
19--65
M
SD
Source
cm HzO kPa cm H20 kPa cm H~O kPa cm H20 kPa cm H20 kPa cm H~O kPa
233 20.0 167 14.3 124 10.6 177 15.2 237 20.3 148 12.7
42 3.6 37 3.2 43 3.7 46 3.9 34 2.9
cm H20 kPa cm H20 kPa cm HeO kPa cm H20 kPa cm H20 kPa
152 13.0 121 10.4 88 7.5 165 14.1 93 8.0
27 2.3 24 2.0 37 3.1 30 2.6 17 1.5
cm H20 kPa cm H20 kPa cm H20 kPa cm H~0 kPa cm H20 kPa cm H.20 kPa
96 23 8.2 2.0 Range: 70-201 Range: 6-17.2 96 23 8.2 2.0 99 23 8.5 2.0 123 27 10.5 2.3 161 37 13.8 3.2
Cerretelli, Brandi, & Brambilla, 1959 Inkley, Odenburg, & Vignos, 1974 Wilson et al., 1984
cm H20 kPa cm H20 kPa cm H20 kPa cm H20 kPa cm H20 kPa
88 7.5 80 6.9 74 6.3 108 9.2 126 10.8
Cerretelli et al., 1959
Black & Hyatt, 1969 Ptacek et a!., 1966 Ptacek et al., 1966 Rahn et al., 1946, summary of six reports Ringqvist, 1966 Wilson et al., 1984
Women n = 60
20-54
n = 31
18--38
n = 36
66-93
n = 100
18--83
n = 87
18--65
Black & Hyatt, 1969 Ptacek et al., 1966 Ptacek et al., 1966 Ringqvist, 1966 Wilson et al., 1984
Boys n = 20
12 only
n = 66
6--14
n = 137
7-17
n = 11
7.4-8.6
n = 26
9.0-10.8
n = 23
il.0-13.0
Gaultier & Zinman, 1983 Gaultier & Zinman, 1983 Gaultier & Zinman, 1983
Girls n = 20
12 only
n = 98
7-17
n = i5
7.1--8.9
n = 17
9.0-10.8
n = 27
11.7-13.3
n o r m a t i v e data are c o m p i l e d in T a b l e 6. An o ld er literature is r e v i e w e d in the articles cited. F o r y o u n g adults, m a x i m u m vocal o u t p u t ranges from about 100 to 126 dB SPL. T h e m e a s u r e can b e affected by several variables, i n c l u d i n g m o u t h - t o - m i c r o p h o n e distance, subject motivation, practice, and the vocal f u n d a m e n t a l f r e q u e n c y at w h i c h the o u t p u t l e v e l is m e a s u r e d . M a x i m u m vocal SPL is greater for m o d a l than falsetto register (Colton, 1973), and the o p t i m al vocal f r e q u e n c y range for m e a s u r e m e n t of m a x i m u m vocal i n t e n s it y appears to be b e t w e e n 60% and 80% of a speaker's total f r e q u e n c y range (Coleman, Mabis, & Hi n s o n , 1977).
16 1.4 21 1.8 25 2.1 39 3.3 32 2.7
Wilson et al., 1984 Gaultier & Zinman, 1983 Gaultier & Zinman, 1983 Gaultier & Zinman, 1983
T h e data of Ptaeek et al. (1966) indicate that geriatric subjects have a m a x i m u m vocal SPL ab o u t 5 dB less than that of y o u n g adults. A similar difference b e t w e e n aged and y o u n g w o m e n was r e p o r t e d by Morris and B r ow n (1986). In addition, Morris and B r o w n ' s results s h o w e d that y o u n g w o m e n had a l o w e r v a l u e of m i n i m u m vocal SPL than geriatric w o m e n . T h e r e f o r e , the vocal range of aged speakers m ay b e r e d u c e d relative to that of y o u n g adults in two ways, a l o w e r m a x i m u m intensity and a h i g h e r m i n i m u m intensity. T h e m i n i m u m vocal output at w h i ch phonation can be sustained has b e e n d e t e r m i n e d in a small n u m b e r of stud-
Downloaded From: http://jshd.pubs.asha.org/ on 01/20/2014 Terms of Use: http://asha.org/terms
376 Journal of Speech and Hearing Disorders
52
367-387
November 1987
TABLE6. Normative data on maximum sound pressure levels (dB re 20 ~Pa) for vowel production. The ages of the children studied by Susser and Bless ranged from 5 years, 4 months to 11 years, 2 months. Tabled values are not corrected for differences in mike-mouth distance.
Source
Subjects
Measure
M
SD
Range
Canter (1965)
Men aged 35-75 years
SPL of syllable no measured 20.39£ cm from lips with sound level meter on C-scale
100,4a
-
-
Ptacek et al. (1966)
Young men Geriatric men Young women Geriatric women
SPL of vowel/a! with 30.48-cm mike-nmuth distance
105.8 100.5 106.2 98.6
5.1 5.9 3.0 4.5
92-116 88-110 99-112 90-104
Coleman et al. (1977)
Young men Young women
SPL of vowel/a/ with a i5.24-cm mike-mouth distance
126 122
Colton (1973)
Young male nonsingers Young male singers
SPL of vowel/a/ with a 22.86-em mike-mouth distance
101 102
Susser & Bless (1983)
Boys Girls
SPL of vowel/a/ with a 15-cm mike-mouth distance
87 84
i
m
m
m
m
aMedian. ies. Data on this measure were reported by Coleman et al. (1977), Colton (1973), and Stone, Bell, and Clack (1978). Coleman et al. commented that "the subglottal pressure necessary to overcome initial vocal fold resistance will result in a SPL of 45--50 dB minimum" (p. 203). In fact, the minima for many speakers may be appreciably above 45-50 dB. For example, Colton (1973) reported minimum vocal outputs of at least 66 dB SPL. Similarly, Canter (1965) obtained a median value of 59 dB for the minimum SPL of 17 men whose ages ranged from 35 to 75 years. Recalling the comments made earlier on the minimum phonation airflow, one can conclude tentatively that the minimum aerodynamic and acoustic output levels required for phonat_ion are in the ranges of 30--65 ec/s and 45-66 dB, respectively. These values are the normative floor for measurements of total airflow range and total SPL range for phonation. However, these estimates of minimum performance should be viewed with the same caution as the estimates of maximum performance. Both estimates may be liable to effects of subject instruction, practice, and other factors. The minimum vocal output has been of particular interest in the literature for two major reasons. One is simply that it defines the lower limit of a speaker's intensity range and is therefore required as part of a range estimation. The other reason is that the measurement of the minimum value of vocal intensity or SPL presents a smaller discomfort and risk to a person who has a laryngeal pathology. In a study of 10 adults (7 women, 3 men), Stone et al. (1978) measured the minimum vocal SPL at a lip-to-microphone distance of 4.6 cm for productions of
v o w e l / i / a t various fundamental frequencies. The mean minimum value ranged from about 73 to 78 dB, increasing with fundamental frequency at a rate of 2 dB/octave. Stone et al. observed large intrasubject and intersubject differences and therefore recommended caution in the interpretation of mean data for this measure. They also suggested that further research be done on the procedural sources of test-retest differences before this index can be judged clinically useful. To the knowledge of the present writers, this research has not been forthcoming. Obviously, ordinary speaking SPLs are well within a normal subject's maximum capability. Shouting may approach the maximum value, but most speaking is accomplished with much smaller levels of output. Colton's (1973) data indicate that at the 50% level of a speaker's fundamental frequency range, the average "comfortable" phonation was about 84 dB SPL, compared to a minimum of 70 dB SPL and a maximum ofl01 dB SPL. There is evidence that singing also has a maximum SPL less than that of a subject's physiological maximum SPL (Coleman & Mort, 1978). The phonetogram is a combined representation of the fundamental frequency and intensity ranges of a voice (Damste, 1970). Recommendations for standardization of the phonetogram recently were made by the Union of European Phoniatricians (Sehutte & Seidner, 1983). Among the recommendations was the use of (a) a 30-cm distance between the microphone and the speaker's mouth, (b) the A-weighting network with slow meter damping to make intensity measurements with a sound level meter, and (c) a standardized report form for the phonetogram. Additional
Downloaded From: http://jshd.pubs.asha.org/ on 01/20/2014 Terms of Use: http://asha.org/terms
KENT ET AL,: Maximum Performance Tests suggestions to improve the clinical utility of phonetograms were offered by Gramming, Gauffln, and Sundberg (1985) and Thiirmer (1986). Area measurements made from phonetograms were used by Komiyama, Watanabe, and Ryu (1984) to derive two "volume" indices, a comparative vocal volume and an effective vocal volume. Komiyama et al. reported on developmental patterns for these indices. Increases in comparative vocal volume occurred especially between 10 and 14 years of age, and increases in effective vocal volume were especially marked between 8 arid 9 years and between 15 and 16 years. Pedersen, Moller, Krabbe, and Bennett (1986) noted a 47% increase in phonetogram area between children aged 8.7-12.9 years and children aged 13-15.9 years. A further increase of 21% was seen between the latter group and children aged 16-19.5 years. Refinements in phonetograms and further definition of normative performance across the life span should help to establish an international clinical tool for voice analysis.
Maximum Closing Force Maximum closing force is the largest occluding or pushing force that can be developed by an articulator such as the jaw, lip, or tongue. Force is a vector quantity that is proportional to the time-rate at which the linear momentum of a body is changing. Generally, force transducers use a spring or other resilient material to convert force to linear displacement. Force applied to the transducer produces stress in the sensing element, which results in strain that can be detected with a strain-gage displacement transducer. The construction of force transducers was described by Barlow and Abbs (1983). Bench calibration of a force transducer typically is accomplished with known masses applied to the transducer. The force exerted by the masses is the product of mass and acceleration due to gravity, F = mg. The unit of force in the International System is the newton (N), which is the force required to accelerate a 1-kg mass at 1 m/s 2, or m 1N = 1 k g ~ . The force unit in the cgs system is the dyne (dyn), which is the force required to accelerate a 1-g mass at an acceleration of 1 cm/s 2. T h e conversion factors between newtons and dynes are given in the Appendix. Normative data on maximum forces for the tongue and lips are given in Table 7. Calculations on the mean data show that for male and female subjects combined, the maximum closing force of the upper lip is about 20% of that for the anterior tongue, whereas the maximum closing force of the lower lip is about 60% of that for the anterior tongue, Intersubject variability is large for each of the force measures. In some of the studies, the range of maximum forces is roughly equal to the mean maximum force (i.e., the range divided by the mean is close to unity). The forces actually developed during speech are difficult to measure, but estimates based on mathematical simulations and biomechanical properties of the perioral tissue indicate that these forces are less than 2 N (Muller,
377
Milenkovic, & MacLeod, 1984). Comparison of this estimate with the maximum force measures in Table 6 leads to the conclusion that only a fraction of the available force is developed during the production of speech (el. Nelson, Perkell, & Westbury, 1984). Maximum force measurements may be more relevant to the clinical assessment of dysphagia than to the clinical assessment of speech (Reddy, Costarella, & Grotz, 1985). Measurements of the relevant forces are di~eult to make, but there is ample precedent for at least one measure of force in the orofaeial complex. The measure of lip strength has been of particular interest in orthodontia upon the assumption that a high tone in the lips may result in substantial outer forces that act on the front teeth (Ingervall & Janson, 1981; Posen, 1972, 1976). The lip strength measurements were made with a pommeter, which is essentially a mouthpiece connected to a dynamometer. This instrument measures the pull force in grams when the mouthpiece is drawn from the lips. Representative data are included in Table 7. The measure ofarticulatory or closing force is similar to force measures used in studies of general muscular function. Maximum force is frequently employed as a measure of strength, although some authors prefer to express strength as the quotient of maximum force (N) and body weight (kg), strength = MF(N)/BW(kg). A comparable strength measure for speech is not readily available because subjects' body weights are rarely reported in the speech studies. Another measure for which few data on speech muscles are available is that of endurance, or the maintenance of force over time. Possible measures of endurance are the following (from Milner-Brown, Mellenthin, & Miller, 1986): Force - time integral, F I T = f F d t = the area under the force-time plot of MF(N)/BW(kg); Fatigue index, FI = [MF(I) - MF(60)]/MF(I) = the difference between the initial maximum force and the force after 6Os of contraction, divided by the initial maximum force. Few, if any, data have been published on these or similar measures of endurance or fatigue although it could be important clinically to make these determinations, especially for clients with neurologic disorders.
Maximum Repetition Rate (MRR) or Diadochokinetic Rate MRR is the maximum rate of repetition of an utterance, usually either a single syllable or a syllable sequence. Measurement of MRR is accomplished in either of two ways. One is to count the number of syllables produced in a given interval or time unit. The second, called time-bycount measurement (Fletcher, 1972), determines the time
Downloaded From: http://jshd.pubs.asha.org/ on 01/20/2014 Terms of Use: http://asha.org/terms
378 Journal of Speech and Hearing Disorders
52 367-387
N o v e m b e r 1987
TABLE 7. Normative data on maximum forces for tongue protrusion (anterior, left lateral, and right lateral), bilabial closure (pulling force), and upper and lower lips (vertical force). All values in newtons (N). Ages of children (in years) are shown in parentheses under subject description.
Force measure Tongue-anterior Posen (1972)
Dworkin, Aronson, & Mulder (1980) Dworkin & Culatta (1985) Tongue-left lateral Dworkin et al. (1980) Dworkin & Culatta (1985) Tongue-right lateral Dworkin et al. (1980) Dworkin & Culatta (1985) Bilabial closure Posen (1972)
Ingervall & Janson (1981) Upper lip Barlow & Rath (1985) Lower lip Barlow & Rath (1985)
Subjects
M
Range
Girls (8) Boys (8)
15.66 14.97
7.16-20.27 9.54-24.09
Girls (10) Boys (10)
17.22 18.04
10.14-22.36 9.54-23.55
Girls (12) Boys (12)
22,25 21.68
13.83-28.03 13.6 -29.82
Girls (16) Boys (16)
22.73 22.70
16.1 -28.03 17,29-27.13
Girls (18) Boys (18) Women Men
23.82 24.93 19,26 20.46
15.5 -29.82 20.27-29.82 11.57-27.58 12.77-32.92
Girls (M of 7.7 years) Boys (M of 8.1 years)
19.69 20.12
-
Women Men Girls (M of 7.7 years) Boys (M of 8.1 years)
14.23 15,70 16.06 18.09
8.3"2--23.71 9.79-29.36 -
Women Men Girls (M of 7,7 years) Boys (M of 8.1 years)
14,55 17.04 15.38 17.60
8.59-28.74 9.48-31.72 -
Girls (8) Boys (8)
1.54 1.58
1.07- 2,15 1.07- 2.27
Girls (10) Boys (10)
2.04 2,1
1.43- 2.98 i.43- 2.62
Girls (12) Boys (12)
2,31 2.53
1.79- 3.10 1.91- 3.40
Girls (16) Boys (16)
3.11 3.47
1.91- 4.77 1.91- 5.25
Girls (18) Boys (18) Girls and boys (7-13)
3.0 4,16 2.47
2.15- 4.29 3.10- 5.96 0.17- 5.49
Women Men
3.35 4.44
1.15- 5.07 1.85- 6.87
Women Men
8.98 14.13
3.44-17.61 7.2 -22.06
required for the production of a specified n u m b e r of syllables. The advantage of the second method is that fewer operations are required of the examiner, who needs only to listen to the syllable count and turn off the stop watch or other timing device w h e n the requisite n u m b e r of syllables is produced. Tiffany (1980) identified the primary appeal of MRR or diadochokinetic rate: " T h e very simplicity of the MRR task r e c o m m e n d s it as a measure of articulation which is
free from some of the imponderable phonological complications" (p. 895). However, Tiffany also pointed to a primary weakness of MRR measures: " I n a s m u c h as little is known of the significance of the speech diadochokinetie rate scores, or how they vary with some of the details of syllable structure, the results of such measures appear to lack a substantial theoretical base" (p. 895). The syllables most c o m m o n l y selected for measurement of MRR are the monosyllables [pAl, [tA], [kA] (or the
Downloaded From: http://jshd.pubs.asha.org/ on 01/20/2014 Terms of Use: http://asha.org/terms
KENT ET AL.: Maximum Performance Tests voiced cognate stops in the same syllable structure) and polysyllabic sequences such as [pntok~], buttercup, or pattycake. The ability to select or alternate place of production is a feature that adds to the clinical utility of MRR. Of course, the clinician also can vary voicing or manner of articulation if desired. Nonetheless, the monosyllabic triad [ph], [th], [kA] has become a clinical standard, and it is for these syllables that the largest amount of normative data has been reported. MRR varies with the age of the speaker and, to a lesser degree, with the sex of the speaker. In some studies, an age-by-sex interaction was observed in MRR values. Phonetic composition also determines MRR. Variations in syllable structure, place of articulation, and manner of articulation are relevant phonetic variables. Normative data on MRR are displayed in Figures 3, 4, and 5. The data are plotted to show the results for children relative to the range of mean values reported for adults. The children's data are diagonally oriented on the graph, whereas the adults' data are enclosed in a band that runs horizontally. The intersection of the diagonal and horizontal bands can be taken as an estimate of the age at which the MRR for children approximates that for adults. Obviously, the data do not converge on a particular age at which children's performance reaches adult values. To the contrary, the data of Canning and Rose (1974) indicate that adult MRR values are reached by 9-10-year-olds, whereas Fletcher's (1972) data do not show a convergence on published adult MRR values even at 15 years. At some ages, the mean data from the studies differ by as much as 2 syllables/second (syl/s). For the studies on adults, the range of means is about 1 syl/s, which is approximately the magnitude of the standard deviations obtained in most studies of MRR (Tables 8, 9, 10, and 11). Compared to other measures of maximum performance, MRR appears to be relatively stable. However, this measure is not without practical and interpretive difficulties. Fletcher's (1972) time-by-count method may simplify the examiner's task, but care should be taken that the number of syllables does not exceed the subject's capability on a single breath, as can be the case with subjects who have a severe motor involvement. Any disruption of the syllable cadence for inspiration invalidates the MRR as an estimate of articulatory ability. Another issue in the interpretation of MRR results is the variability in the normative data, particularly for children (Figures 3, 4, & 5). Fletcher's data represent the low end of MRR values for children, whereas Canning and Rose's (1974) data represent the high end, The age at which children match adult MRR values is very difficult to fix with confidence. As Figures 3-5 show, the published data do not converge on a definite age. Fletcher's data can be taken as conservative measures of normative performance, which may be an argument for their clinical utility. (Fletcher's time-bycount data are converted to count-by-time data in Table 12.) Finally, whenever the resources are available, the examiner should use oscilloscopic, oscillographic, or spectrographic displays to certify the MRR responses. The same displays can be used to make qualitative or
379
_
7
--A--~ D U L
6
o
_~
s__~
° °
>-
•
K
-~15
o °0
i
i
i
i
i
i
i
t
7 9 11 13 AGE(YEARS)
i
t
15
FIGURE3. Graph of maximum repetition rate for the syllable/pA/ for different age groups of speakers. The means reported in six studies of adults are enclosed in broken horizontal lines at the top of the figure. The means reported in four studies of children are enclosed in solid lines to depict the developmental course and variability among means at a given age. (See Tables 8, 9, and 10 for studies on adults.) Studies on children are illustrated by Blomquist (1950)--open diamonds, Canning and Rose (1974)filled circles, Fletcher (1972)--filled diamonds, and Irwin and Becklund (1953)--open circles. quantitative statements on the syllable-to-syllable regularity of the subject's responses. With the increasing availability of real-time acoustic analyses, a more complete analysis of MRR responses becomes possible in a variety of settings. One of the few studies to consider quantitatively the factor of temporal irregularity in MRR was that of Portnoy and Aronson (1982). They recorded syllable repetitions from 90 speakers, 30 in each of three groups: normal speakers, spastic dysarthrics, and ataxic dysarthrics. Data were obtained on mean syllable duration (reciprocal of MRR in syl/s), standard deviation, and square root of the mean square successive difference (the latter being a measure of the variance between two successive syllable durations). Statistically significant differences were observed among the three groups for the square root of the mean square successive difference. This study gives an example of an additional dimension of information that can be obtained from the MRR task. Irregularities of temporal and intensity patterns in repeated syllable sequences were studied by Tatsurni, Sasanuma, Hirose, and Kiritani (1979), who made the following measures from maximum-rate repetitions of the syllable/pa/for normal speakers and speakers with cerebellar ataxia or Parkinson's disease: (a) mean syllable duration, (b) standard deviation of syllable duration, (c)
Downloaded From: http://jshd.pubs.asha.org/ on 01/20/2014 Terms of Use: http://asha.org/terms
380 Journal of Speech and Hearing Disorders
52 367--387 November 1987
F
_
--A----z~
7 0 Ld b'l
D U L T
0---
6
--S
Ld
S6
ZX
J
~ rr
5 E
0 d) v Dd
oo oO
5
S-A
>-
0
_J
Am/x z~0¢
¢9
4
E
4
3:T_LL
-
q 7
5
'5
~ 9
11
13
15
AGE(YEARS) FIGURE4. Graph of maximum repetition rate for the Syllable/tn/ for different age groups of speakers. The means reported in six studies of adults are enclosed in broken horizontal lines at the top of the figure. The means reported in four studies of children are enclosed in solid lines to depict the developmental course and variability among means at a given age. (See Tables 8, 9, and 10 for studies on adults.) Studies on children are illustrated by Blomquist (1950)--open diamonds, Canning and Rose (1974)filled circles, Fletcher (1972)--filled diamonds, and Irwin and Becklund (1953)--open circles. standard deviation of the relative values of the maximum vocal intensity, (d) perturbation of syllable duration, and (e) perturbation of maximum syllable intensity. The latter two measures of perturbation were selected to accentuate random variations and were calculated by the formulas: n-1 £ n=l n-1
1
S--a- n - 1 1 V--~ - n -
1
E
n=l
IS¢-
Sa,+,l;
2 1Vm~ -- Vm~,+, I / (Vmax + Vm~,+),
where S---dis the measure of rate perturbation, V--'~is the measure of intensity perturbation, n is the number of syllables, Sa, is the duration of syllable i, and Vm~ is the maximum intensity of syllable i. Tatsumi et al. reported that the ataxic and Parkinson's subjects were distinguished by these measures. The ataxic speakers tended to repeat syllables at a slow rate and with marked irregularity in both temporal and intensity pattern. The results for the Parkinson patients were more like those for the normal speakers. These variables can be investigated as a function of speech motor subsystem by appropriate phonetic variation of the sample (e.g., [hA] for the laryngeal subsystem, [bn] and [pal for the laryngeal and labial
~
I
7
J
I
9
l
I
11
I
I
13
l
I
15
AGE(YEARS) FIGURE5. Graph of maximum repetition rate for the syllable/kAl for different age groups of speakers. The means reported in six studies of adults are enclosed in broken horizontal lines at the top of the figure. The means reported in four studies of children are enclosed in solid lines to depict the developmental course and variability among means at a given age. (See Tables 8, 9, and 10 for studies on adults.) Studies on children are illustrated by Blomquist (1950)--open diamonds, Canning and Rose (1974)filled circles, Fletcher (1972)--filled diamonds, and Irwin and Becklund (1953)--open circles.
subsystems, and [dA] and [tA] for the laryngeal and lingual subsystems). MRR can be expressed as either syllables per second or phones per second. However, the significance of file latter can be questioned. Repetition of a simple CV syllable is basically a cyclic m o v e m e n t of the oral articulator. Consonants like [p t k] cannot be produced in isolation but are instead produced with a releasing vowel, usually [A]. The consonant-vowel assembly is the perceptual consequence of the cyclic articulatory movement, but the movement itself may not be fundamentally unlike the cyclic movements of other structures such as the limbs or digits. Indeed, it appears that MRR for speech is similar to the maximum rate of cyclic movements for finger wagging or forearm swinging (Fenn, 1938). The same maximum was observed for breathing frequency in man (Otis & Guyatt, 1968). For a variety of structures, then, the upper limit of cyclic movements is on the order of five to seven per second. If instrumentation is available for the recording of displacement and velocity during alternating movements, several possibilities of dynamic analysis exist. Data from both speech movements (Munhall & Ostry, in press; Ostry & Munhall, 1985) and limb movements (Cooke, 1980, 1982; Feldman, 1980) have shown that increases in the rate of repeated alternating gestures are accompanied
Downloaded From: http://jshd.pubs.asha.org/ on 01/20/2014 Terms of Use: http://asha.org/terms
KENT ET AL.: Maximum Performance Tests
381
TABLE 8. Normative adult data on MRR in syllables/second for [p^]. M = male; F = female; YA = young adult; A = adult with unreported or wide range of age; GA = geriatric adult.
TABLE 10. Normative adult data on MRR in syllables/second for [k^]. M = male; F = female; YA = young adult; A = adult with unreported or wide range of age; GA = geriatric adult.
Source Dworkin et al. (1980) Kreul (1972)
Lass & Sandusky (1971) Lundeen (1950) Ptacek et al. (1966)
Sigurd (1973) Tiffany (1980)
Subjects
M
SD
Range
Source
M, A F, A M, YA F, YA M, GA F, GA M, YA F, YA M & F, YA M, YA F, YA M, GA F, GA 8M & 1F, A 7M & 3F, A
6.5 6.1 6.0 5.9 6.0 6.7 6.3 6.2 7.0 7.0 6.9 5.4 5.0 6.9 7.1
0.66 0.35 0.82 0.93 0.53 0.61 1.0 0.6 1.2 1.2 0.7
4.5-7.5 4.6-8.6 5.2-7.4 5.0-7.8 5.4-9.4 5.8-7.8 2.8-8.2 1.3-7.0 -
Dworkin et al. (1980)
by increases in t h e ratio of m a x i m u m v e l o c i t y to m o v e m e n t a m p l i t u d e . O n e i n t e r p r e t a t i o n o£this relationship is that the k i n e m a t i c c h a n g e s that occur with i n c r e a s e d rate of m o v e m e n t s are b r o u g h t a b o u t by i n c r e a s e d stiffness. T h a t is, slow rates of r e p e t i t i o n are associated with d e c r e a s e d stiffness (reflected by a small ratio of m a x i m u m v e l o c i t y to m o v e m e n t amplitude), and fast rates of syllable r e p e t i t i o n are associated with i n c r e a s e d stiffness (and a larger ratio of m a x i m u m v e l o c i t y to m o v e m e n t amplitude). O n e p o t en t i a l t h e s e considerations may hold for the a s s e s s m e n t o f s p e e c h is a k in e m a ti c analysis, with v e l o c i t y and a m p l i t u d e as the primary variables, that can b e i n t e r p r e t e d w i t h r e s p e c t to the b i o m e c h a n i c a l characteristics of t h e articulator. A further p r o s p e c t for d y n a m i c analysis is a g e o m e t r i c type of analysis in w h i c h p h a s e p l a n e trajectories are g e n e r a t e d by c o n t i n u o u s l y plotting the relationship bet w e e n the position of an articulator and its velocity. E x a m p l e s of this kind of analysis are s h o w n in Kelso, Vatikiotis-Bateson, Saltzman, and Kay (1985). Although TABLE 9. Normative adult data on MRR in syllables/second for [th]. M = male; F = female; YA = young adult; A = adult with unreported or wide range of age; GA = geriatric adult.
Source Dworkin et al. (1980) Kreul (1972)
Lass & Sandusky (1971) Lundeen (1950) Ptacek et al. (1966)
Sigurd (1973) Tiffany (1980)
Subjects
M
SD
Range
M, A F, A M, YA F, YA M, GA F, GA M, YA F, YA M & F, YA M, YA F, YA M, GA F, GA 8M & 1F, A 7M & 3F, A
6.5 6.0 6.0 5.8 5.8 6.5 6.1 6.2 7.1 6.9 6.8 5.3 4.8 6.9 7.1
0.96 0.37 0.69 0.44 0.50 0.64 1.1 1.0 1.0 1.1 0.8
4.4-8.2 4.3-8.5 5.0-7.8 4.4-7.8 4.2-9.4 4.8--8.4 3.0--6.8 2.2M5.8 -
Kreul (1972)
Lass & Sandusky (1971) Lundeen (1950) Ptacek et al. (1966)
Sigurd (1973) Tiffany (1980)
Subjects
M
SD
Range
M, A F, A M, YA F, YA M, GA F, GA M, YA F, YA M & F, YA M, YA F, YA M, GA F, GA 8M & 1F, A 7M & 3F, A
6.1 5.7 5.4 5.2 5.8 5.9 5.8 5.6 6.2 6.2 6.2 4.9 4.4 6.4 6.2
(0.54) (0.60) (0.62) (0.83) 0.55 0.75 0.8 0.8 1.0 1.1 0.8
4.4-7.5 4.3-7.9 4.6-6.8 4.0-7.4 5.0-8.2 4.6-8.2 2.6-6.8 2.2-6.4 -
the analyses d e s c r i b e d by Kelso et al. are for reiterant s p e e c h b ased on the s y l l a b l e / b a / , the same p r i n c i p l e s of analysis w o u l d apply to syllable r ep et i t i o ns u s e d in diadochokinesis. I n d e e d , a similar graphical analysis, b ased on a plot of intensity (I) versus rate of c h a n g e in intensity (M/At), was u s e d by v o n C r a m o n and Z i e g l e r (in press) to study syllable r ep et i t i o n s in dysarthric speakers. El ab o r at i o n of t h e s e analyses is b e y o n d the scope of this p a p e r b u t is one subject of a p a p e r in preparation.
GENERAL
CONCLUSIONS
M a x i m u m p e r f o r m a n c e tests find some o f t he i r most f r e q u e n t clinical applications in s c r e e n i n g and in the a s s e s s m e n t of motor s p e e c h disorders. T h e y h a v e b e e n u s e d to identify d i m i n i s h e d strength, speed, and range. E v e n t h o u g h the r e q u i r e m e n t s of s p e e c h m a y b e well w i t h i n the maximal p e r f o r m a n c e s of normal speakers, it can be i m p o r t an t to d e t e r m i n e w h e n a d i s o r d e r e d talker TABLE 11. Normative data on MRR in syllables/second for [phtzkz]. M = male; F = female; YA = young adult; A = adult with unreported or wide range of age; GA = geriatric adult; B = boy; G = girl.
Source Lass & Sandusky (1971) Tiffany (1980) Ptacek et al. (1966)
Blomquist (1950)
Downloaded From: http://jshd.pubs.asha.org/ on 01/20/2014 Terms of Use: http://asha.org/terms
Subjects
M
SD
Range
M, YA F, YA 7M & 3F, A M, YA F, YA M, GA F, GA B-9 G-9 B-10 G-10 B-11 G-11
6.36 6.27 7.5 5.8 6.3 4.4 3.6 4.3 4.8 5.0 5.0 5.0 5.3
0.42 0.31 1.1 1.0 0.9 1.3 1.3 0.68 0.72 0.80 0.47 0.54 0.58
4.8-7.2 4.8-7.2 4.8-8.2 3.8-7.8 2.4-7.0 1.4-6.2
382 Journal of Speech and Hearing Disorders
52 367-387 November 1987
TABLE12. Normative data on MRR in syllables/second for various syllables. Data for children are Fletcher's (1972) time-by-count values converted to count-by-time values. MRR data for adults are shown for comparison.
Age (years)
pA
tA
kn
Syllable pattern fa
la
pAt0
pAkz
tAkz
pAt~kz
6 7 8 9 10 11 12 14 Adults
4.2 4.7 4.8 5.0 5.4 5.6 5.9 6.1 6.~7.0 a
4.1 4.1 4.6 4.9 5.3 5.6 5.7 6.1 6.~7.0"
3.6 3.8 4.2 4.4 4.6 5.0 5.1 5.4 5.~6.5 a
3.6 3.7 4.1 4.4 4.8 5.0 5.4 5.6 6.45
3.8 3.8 4.4 4.4 4.8 5.3 5.4 5.7 6.55
2.0 2.0 2.4 2.5 2.7 3.1 3.2 3.6 4.6°
1.9 1.9 2.1 2,3 2.3 2.6 2.6 2.9 -
1.9 1.9 2.1 2.3 2.3 2.6 2.7 2.9 -
1.0 1.0 1.2 1.3 1.4 1.5 1.6 1.8 2.5°
aApproximate range of means from Figures 3, 4, and 5. bFrom Sigurd (1973). CFromTiffany (1980). has a reduced reserve. A reduced reselve can impair a talker's flexibility and can also mean that speaking for such an individual is a taxing process. Despite the longevity of maximum performance measures in the literature and in clinical practice, this survey of their data base indicates serious questions regarding their validity and reliability. These measures can, and should, be improved with the application of quantitative instrumental procedures that enable knowledge of results, detailed analysis of response features, and introduction of a second-generation data base. Lack of standardized procedures is a serious obstacle to the general clinical application of maximum performance measures. Potentially, these measures could be standardized for international clinical use. Most of them do not require familiarity with any particular language. To take one example, maximum phonation duration requires only vowel phonation, usually the low-back vowel/a/, and thus should be limited very little by the phonetic system of any given language. Despite the apparent potential of tasks such as the maximum performance measures for universal clinical application, Hirano (1981, preface) remarked, "With regard to phonation, various methods have been proposed and used by many clinicians and researchers all over the world. Unfortunately, none of these methods appears to be standardized on an international basis." Universality of application--across languages, ages, and other variables--is a primary attraction of maximum performance measures. But this attraction may not be sumeient in itself. Maximum performance measures also must be conceptually related to more general speech performance, particularly the ability of a person to communicate successfully. This theoretical underpinning is still largely wanting. The following general conclusions are drawn from the foregoing review and discussion. 1. For most of the measures of maximum performance, both intrasubject and intersubject variability are large. A considerable range of values has been reported for normal speakers for nearly all maximum performance tasks, even when the studies converge on a measure of central tendency, such as the mean value of maximum repetition rate for adults. The variability issue enfolds several other
issues, including (a) the effect of practice, motivation, or instructions; (b) the effect of age, sex, and other physical variables; and (e) the validity of the tests (i.e., the extent to which these measures really succeed as estimates of maximum performance). The issue of variability should not be underestimated. For some measures at some ages (e.g., maximum phonation duration for young children), the range of normal values is nearly an order of magnitude. It is abundantly clear from the literature on measures of maximum performance that instructions to the subject can strongly affect the data. Unfortunately, despite the urgings of some writers, there is little assurance that standardized instructions are used from laboratory to laboratory or from clinic to clinic. 2. Generally, the demands of ordinary speech production fall well within the limits defined by the measures of maximum performance. In other words, speaking under ordinary circumstances does not tax the performance capabilities of the speech system. One exception to this generalization may be the rate of production expressed as either syllables/second or phones/second. As Tiffany (1980) observed, the rate of production in reading or conversation approximates that in the repetition of a simple syllable. One interpretation of this observation is that ordinary conversation or oral reading is carried out at nearly the maximum rate of temporal sequencing. Another line of evidence for this conclusion is the apparent fragility of temporal sequencing seen in the occurrence of sequencing errors such as spoonerisms (Fromkin, 1971; Shattuck-Hufnagel, 1979, 1983). That is, the temporal sequencing of speech may be performed at rates that allow for a small margin of error--a margin that is occasionally exceeded by many talkers. 3. Despite the longevity of maximum performance measures in clinical practice and the archival literature, the normative data are lacking in several respects, especially life-span considerations. Relatively few sources are available for data on children and geriatric subjects. Those data that are available indicate that age effects are pronounced. Hence, normative data for young adults should not be used routinely as the basis of comparison for children or geriatric subjects. However, caution also should be observed in attributing life-span effects to
Downloaded From: http://jshd.pubs.asha.org/ on 01/20/2014 Terms of Use: http://asha.org/terms
KENT ET AL.: Maximum
maturation or aging. The latter often are confounded with other factors, such as attitudinal factors, training, and incentive. For example, Elliott (1970, 1972) reported that measures of simple reaction time in children can be substantially improved with practice and incentive. To the degree that training and incentive are confounded with age of subjects, the isolation of genuine maturation or aging effects is a challenge to clinician and researcher. 4. Measures of maximum performance are not always interpretable in and of themselves. For example, maximum phonation duration depends on both phonation volume and mean airflow. A low value of maximum phonation duration can be attributable to an inadequate volume of air used during phonation, to excessive airflow during phonation, or to subject factors that hinder maximum performance (such as poor motivation). Given the variability of most measures of maximum performance, and the possibility of improved performance with repeated trials, values derived from three to five attempts should not be taken at face value. Particularly when performance is deficient compared to norms, data should be taken for repeated trials or other tasks should be used to complete the interpretative framework. 5. The tasks used to assess maximum performance can be used to provide additional information on phonatory and articulatory performance. Several examples have been given in this report. Most of these analyses require suitable instrumentation, but microcomputers or commercially available devices for the visual display of speech provide the basic capability. Maximum performance, then, is only one item of information that can be derived from the tasks designed to give its measurement. With the increasing availability of appropriate instrumentation, additional data should be recorded as a matter of course. The additional data not only add to the total information on performance but also help to qualify the responses as being suitable for analysis of any kind. 6. All of the maximum performance tests reviewed in this report can be considered to constitute a potential test battery for clinical speech assessment. These tests can be grouped roughly into three major categories of assessment: pulmonary (phonation volume, maximum phonation duration, maximum fricative duration, PEm~x), phonatory (phonation volume, maximum phonation duration, s/z ratio, maximum repetition rate for syllables containing voiceless/voiced contrasts), and articulatory (maximum fricative duration, maximum closing force, maximum repetition rate for syllables varying in place and manner features). The relationship among the tests within a category can vary with several factors, but especially type and severity of disorder. For example, a pulmonary disorder may not uniformly affect all of the measures listed for this category. However, when several tests within a category are used, the examiner should look for consistency of results. Finally, it should be noted that the present report focuses on measures that are most directly related to speech. A more complete examination of motor function might add such measures as Plmax (maximum inspiratory pressure), peak flows for inspiration and expiration, and minute volume (Dockery et al.,
Performance Tests
383
1985; Shapiro, Johnston, Dameron, & Patterson, 1964; Wilson et al., 1984). Additional tasks for assessment of the laryngea! and articulatory systems include tests of oral nonverbal gestures, standard articulation tests, evaluation of prosody, and performance load tests (Kent, in press; Kent & Kent, in press). It is not within the scope of this paper to consider the various clinical applications of measures of maximum performance. They are used in different ways by different clinicians and in different ways for different disorders. Some clinicians may doubt the value of these measures, particularly given problems of reliability and interpretation. It is a matter for each clinician to decide if these measures have a satisfactory benefit/time ratio. It is also a matter of individual decision as to how these measures can and should be used (e.g., as general screening procedures, as extra tests to confirm an assessment, or as special tests in an assessment battery). Some clinicians use maximum performance tests selectively either to confirm a diagnosis or to exclude an alternative diagnosis. These tests can be useful, too, to help determine the relative degree of involvement of the functional systems of speech (e.g., respiratory, laryngeal, velopharyngeal, articulatory). Finally, maximum performance measures can be useful indices of change. For example, exercises designed to strengthen the respiratory system can be evaluated with phonation volume, maximum phonation duration, maximum expiratory pressure, or maximum airflow. Whatever clinical use may be made of these tests, the examiner should be cognizant of their reliability and the adequacy of a normative data base. Finally, none of the tasks considered in this review represent speech in the conventional sense. Each task is either a nonspeech behavior presumed to correlate with speech behavior (e.g., maximum expiratory pressure) or a highly simplified or stylized speech activity (e.g., prolongation of a vowel or rapid repetition of an invariant syllable). There do not appear to be commonly accepted maximum performance measures based on behaviors typical of conversational speech. Most of the common measures of maximum performance occupy the middle ground between nonspeech functions and typical speechlike behaviors. It is perhaps for this reason that the relationship between maximum performance data and the assessment of overall speech adequacy for social communication remains an open question. If the maximum performance tasks of speech do not require speech in the usual sense of the word, then it might be asked if a maximum performance measure of speech could be designed. Such a measure would require that the subject use speech in some form--whether reading, conversation, or imitation--at some performance limits. For example, the subject might be asked to speak with phonational frequencies near the extremes of the ranges identified for vowel phonation (lowest and highest fundamental frequencies); or the subject might produce utterances at average intensity levels (for the vowel components) that approximate the extremes of the intensity range for vowel phonations. In another variation, speech could be tested at different rates of production up
Downloaded From: http://jshd.pubs.asha.org/ on 01/20/2014 Terms of Use: http://asha.org/terms
384 Journal of Speech and Hearing Disorders to a theoretical maximum determined by the subject's performance on diadochokinesis or maximum repetition rate. If measures of adequacy are obtained for speech production at the performance extremes, then the maxim u m performance conditions bear on some relevant measure of speech production (e.g., intelligibility, quality, or perceived difficulty). Various possibilities for quantification can be proposed. One such is the speaker's success in making voiced/voiceless contrasts at different average levels of phonational frequency. Another is the highest rate in syl/s at which a subject can produce speech while maintaining a predetermined intelligibility, such as 50% for a word list. The major conclusion that we draw from this survey of the normative data base on maximum performance measures of speech production is that the data base is generally inadequate for confident clinical application. Most purported measures of maximal performance probably fail to plumb a subject's real maximmn effort. Although careful instructions and repeated trials may yield an eventual result that is nearly a maximum effort, the time and expense involved in obtaining this "maximum" effort may not produce a favorable ratio of cost to benefit. Generally, the data for maximal efforts (and minimal efforts, too, it appears) are highly variable. The variability of the data within and across studies may be excessive for many of the clinical uses proposed for these measures. It is for this reason that we call for a second generation of speech production measures. We intend to describe some candidates for this new set of measures in a paper in preparation. T h e intent of the present paper is to docum e n t the failings of the current data base, to eatl for research to correct these failings, and to caution clinicians on the use of these measures. Properly used, the maxim u m performance measures may be useful and justifiable. We have tried to point out some directions for proper use, but the problems outweigh the suggested solutions in some, and perhaps many, of the areas of concern.
ACKNOWLEDGMENTS This work was supported in part by Public Health Service Research Grant No. NS22458. We thank Professors Gary Weismer and Diane Bless and the Journal reviewers for their comments on an earlier version of the manuscript.
REFERENCES ALTMAN,P. L., & DITTMER, D. S. (Eds.). (1971). Respiration and circulation. Bethesda, MD: Federation of American Societies for Experimental Biology. ARNOLD, K. S., & EMANUEL, F. W. (1979). Spectral noise levels and roughness severity ratings for vowels produced by male children. Journal of Speech and Hearing Research, 22, 613-626. BALDWIN, E. DEF., COURAND, A., & RICHARDS, D.W., Jl~. (1948). Pulmonary insufficiency. Medicine, 27, 243-276. BARLOW, S., & RATH, E. (1985). Maximum voluntary closing forces in the upper and lower lips of humans. Journal of Speech and Hearing Research, 28, 373-376.
52 367-387 November 1987 BARLOW, S. M., • ABBS, J. H. (1983), Force transducers for the evaluation of labial, lingual, and mandibular motor impairments. Journal of Speech and Hearing Research, 26, 616-621. BECKETT, R. a. (1971). The respirometer as a clinical tool in the speech clinic. Journal of Speech and Hearing Disorders, 36, 235-241. BECKETT, B. L., THOELKE,W., & COWAN,L. (1971). A normative study of airflow in children. British Journal of Disorders of Communication, 6, 13-16. BLACK, L. F., & HYATT, R. E. (1969). Maximal respiratory pressures: Normal values and relationship to age and sex. American Review of Respiratory Diseases, 99, 696-702. BLESS, D. M., & HmANO, M. (1982a, November). Estimation of glottal airflow and MFT as a clinical tool. Paper presented at the Annual Convention of the American Speech-LanguageHearing Association, Toronto. BLESS, D. M., & HIRANO,M. (1982b, November). Verbal instructions: A critical variable in obtaining optimal performance for maximum phonation time. Paper presented at the Annual Convention of the American Speech-Language-Hearing Association, Toronto. BLOMQUIST,B. (1950). Diadochokinetic movements of nine, ten, and eleven-year-old children. Journal of Speech and Hearing Disorders, 15, 159-164. BOONE, D. R. (1977). The voice and voice therapy. Englewood Cliffs, NJ: Prentice-Hall. BmTT, E. J., SHELHAMER,J., MENKES, H., COHEN, B., MEYER, M., & PERMUTT, S. (1981). Sex differences in the decline of pulmonary function with age. Chest, 80(Suppl.), 79S-80S. CANNING, B., {~: BOSE, M. (1974). Clinical measurements of the speech tongue and lip movements in British children with normal speech. British Journal of Disorders of Communication, 9, 45-50. CANTER, G. J. (1965). Speech characteristics of patients with Parkinson's disease: II. Physiological support for speech. Journal of Speech and Hearing Disorders, 30, 44-49. CAVAGNA, G.A., &: MARGAItIA, R. (1968). Airflow rates and efficiency changes during phonation. In A. Bouhuys (Ed.), Sound production in man. Annals of the New York Academy of Sciences, 155, 15"2-163. CERRETELLI, P, BRANDI, G., & BRAMBILLA,I. (1959). II massimo lavoro potenziale dell'apparatus respiratorio come phoro di funzionaleta nei ragazzi. Minerva Medica, 50, 2499-2501. CHILD,.D.R. (1979). Maximum phonation time: Optimum number of trials and normative performance of fourth grade children. Unpublished master's thesis, Utah State University, Logan. COLEMAN, R. F., MABIS, J. H., & HINSON, J. K. (1977). Fundamental frequency--Sound pressure level profiles of adidt male and female voices. Journal of Speech and Hearing Research, 20, 197-204. COLEMAN, R. F., & MOTT, J. B. (1978). Fundamental frequency and sound pressure level profiles of young female singers. Folia Phoniatrica, 30, 94-102. COLTON, R. H. (1973). Vocal intensity in the modal and falsetto registers. Folia Phoniatrica, 25, 62-70, COLTON, R. H., ~z HOLLIEN, H. (1972). Phonational range in the modal and falsetto registers. Journal of Speech and Hearing Research, 15, 708-713. COOKE, J. D. (1980). The organization of simple skilled movements. In G.E. Stelmach & J. Requin (Eds.), Tutorials in motor behavior. Amsterdam: North Holland. COOKE, J. D. (1982). Position-velocity-torque relations during human arm movements. Society for Neurosciences, 8, 731. CRAMON, D.V., i~7 ZIEGLER, W. (in press). Die spastisehe dysarthrophonie. In L. Springer & G. Kattenbeck (Eds.), Interdisciplinare Reihe zur Theorie und Praxis der Logopadie (Bd. 3). DAMSTE, H. (1970). The phonetogram. Practica oto-rhinoIaryngologiea, 32, 185--187. DAVIS, S. B. (1976). Computer evaluation of laryngeal pathology based on inverse filtering of speech. Unpublished doctoral dissertation, University of California, Santa Barbara. Also
Downloaded From: http://jshd.pubs.asha.org/ on 01/20/2014 Terms of Use: http://asha.org/terms
KENT ET AL.: Maximum Performance Tests SCRL Monograph 13, Santa Barbara, CA: Speech Communications Research Laboratory. DOCKERY,D. W., WARE, J. H., FEBRIS,B. G., JR., GLICKSBERG, M. E. F., SPIRO, A. I I I , & SPEIZER,F. E. (1985). Distribution of forced expiratory volume in one second and forced vital capacity in healthy, white, adult never-smokers in six U.S. cities. American Review of Respiratory Disease, 131,511-520. DWORKIN, J., ARONSON,A., & MULDER, D. (1980). Tongue force in normal and in dysarthric patients with amyotrophic lateral sclerosis. Journal of Speech and Hearing Research, 23, 828--837. DWORKIN, J. P., & CULATTA, R. A. (1985). Oral structural and neuromuscular characteristics in children with normal and disordered articulation. Journal of Speech and Hearing Disorders, 50, 150-156. ECKEL, F.C., & BOONE, D.R. (1981). The s/z ratio as an indicator of laryngeal pathology. Journal of Speech and Hearing Disorders, 46, 147-149. ELLIOTT, R. (1970). Simple reaction time: Effects associated with age, preparatory interval, incentive-shift, and mode of presentation. Journal of Experimental Child Psychology, 9, 86-107. ELLIOTT,R. (1972). Simple reaction time in children: Effects of incentive, incentive-shift and other training variables. Journal of Experimental Child Psychology, 13, 540-557. EMANUEL, F. W., LIVELY, M. A., & McCoY, J. F. (1973). Spectral noise levels and roughness ratings for vowels produced by males and females. Folia Phoniatrica, 25, 110-120. EMANUEL, F. W., & SANSONE, F. E. (1969). Some spectral features of "normal" and simulated "rough" vowels. Folia
Phoniatrica, 21,401-415. EMANUEL, F. W., & WHITEHEAD, R. L. (1979). Harmonic levels and vowel roughness. Journal of Speech and Hearing Research, 22, 829--840. FELDMAN, A. G. (1980). Superposition of motor programs-II. Rapid forearm flexion in man. Neurosciences, 5, 91-95. FENN, W. D. (1938). The mechanics of muscular contraction in man. Journal of Applied Physics, 9, 165-177. FINNECAN, D. E. (1984). Maximum phonation time for children with normal voices. Journal of Communicative Disorders, 17, 309-317. FINNEGAN,D. E. (1985), Maximum phonation time for children with normal voices. Folia Phoniatrica, 37, 209-215. FLETCHER, S. (1972). Time-by-count measurement of diadochokinetic syllable rate. Journal of Speech and Hearing Research, 15, 763-770. FROMKIN, V. A. (1971). The non-anomalous nature of anomalous utterances. Language, 47, 27-52. GAULTIER, C., & ZINMAN,R. (1983). Maximal static pressures in healthy children. Respiration Physiology, 51, 45--61. GELFERI M.P. (1986). The stability of total phonational frequency range, journal of the Acoustical Society of America, 79(Suppl. 1), $83. GERRATT, B. R. (1983). Formant frequency fluctuation as an index of motor steadiness in the vocal tract. Journal of Speech and Hearing Research, 26, 297-304. GLINDMEYER, H. W. (1981). Predictable confusion, journal of Occupational Medicine, 23, 845-849. GRADDOL, D. (1986). Discourse specific pitch behavior. In C. Johns-Lewis (Ed.), Intonation in discourse (pp. 221-237). Beckenham, Kent: Croon-Helm. GRAMMING,P., GAUFFIN, J., & SUNDBERG,J. (1985). An attempt to improve the clinical usefulness ofphonetograms. Quarterly Progress and Status Report, 2-3, 17-85. Stockholm: Royal Institute of Technology, Speech Transmission Laboratory. HANSON, W., & EMANUEL, F. W. (1979). Spectral noise and vocal roughness relationships in adults with laryngeal pathology. Journal of Communicative Disorders, 12, 113-124. HARDEN, J. R., & LOONEY, N. A. (1984). Duration of sustained phonation in kindergarten children. International Journal of Pediatric OtoIaryngology, 7, 11-19. HmANO, M. (1981). Clinical examination of the voice. New York: Springer-Verlag.
385
HIRANO, M., KOIKE, Y., & LEDEN, H. VON (1968). Maximum phonation time and air usage during phonation. Folia Phoniatrica, 20, 185-201. HOLLIEN, H. (1977). The registers and ranges of the voice. In M. Cooper & M. H. Cooper (Eds.), Approaches to vocal rehabilitation (pp. 76-121). Springfield, IL: Charles C. Thomas. HOLLIEN, H., DEW, D., • PHILIPS, P. (1971). Phonational frequency ranges of adults. Journal of Speech and Hearing Research, 14, 755-760. HOLLIEN, H., MICHEL, J., & DOHERTY, E. (1973). A method for analyzing vocal jitter in sustained phonation. Journal of Phonetics, 1, 85-91. HORII, Y. (1979). Fundamental frequency perturbation observed in sustained phonation. Journal of Speech and Hearing Research, 22, 5-19. HomI, Y. (1985). Jitter and shimmer in sustained vocal fry phonation. Folia Phoniatrica, 37, 81-86. INGERVALL, B., & JANSON, T. (1981). The value of clinical lip strength measurements. American Journal of Orthodontia, 80, 496-507. iNGLIS, J. M. (1977). Obtaining normative data on vocal performance in a group of adult speakers. Unpublished master's thesis, Utah State University, Logan. INKLEY, S. R., ODENBURG, F. C., & VICNOS, P. J. (1974). Pulmonary function in Duchenne muscular dystrophy related to stage of disease. American Journal of Medicine, 56, 297--306. IRWIN, J.V., & BECKLUND, D. (1953). Norms and maximum repetitive rates for certain sounds established with the sylrater. Journal of Speech and Hearing Research, 18, 149-160. ISSHIKI, N., OKAMURA, H., & MORLMOTO, M. (1967). Maximum phonation time and air flow rate during phonation: Simple clinical tests for vocal function. Annals of Otology, Rhinology, and Laryngology, 76, 988-1007. IWATA, S., LEDEN, H. YON, & WILLIAMS, D. (1972). Air flow measurement during phonation. Journal of Communication Disorders, 5, 67-79. JOHNS-LEWIS, C. M. (1986). Prosodic differentiation of discourse modes. In C. M. Johns-Lewis (Ed.), Intonation in discourse (pp. 199-219). Beckenham, Kent: Croon-Helm. JOHNSON, T. S. (1984). Voice disorders: The measurement of clinical progress. In J. M. Costello (Ed.), Speech disorders in adults: Recent advances (pp. 127-152). San Diego, CA: College-Hill Press. KELMAN, A. W., GORDON, M. T., MORTON, F. M., & SIMPSON, I. C. (1981). Comparison of methods for assessing vocal function. Folia Phoniatrica, 33, 51-65. KELMAN, A.W., GORDON, M. T., SIMPSON, I. C., • MORTON, F. M. (1975). Assessment of vocal function by air-flow measurements. Folia Phoniatrica, 27, 250-262. KELSO, J. A. S., VATIKIOTIS-BATESON,E., SALTZMAN,E. L., & KAY, B. (1985). A qualitative dynamic analysis of reiterant speech production: Phase portraits, kinematics, and dynamic modeling. Journal of the Acoustical Society of America, 77, 266-280. KENT, R. D. (in press). Assessment of prosody in children. In D. E. Yoder & R. D. Kent (Eds.), Decision making in speechlanguage pathology. Toronto: B. C. Decker. KENT, R. D., & KENT, J. F, (in press). Assessment of motor speech disorders. In D. E. Yoder & R. D. Kent (Eds.), Decision making in speech-language pathology. Toronto: B. C. Decker. KLINGHOLZ,F., & MARTIN, F. (1985). Quantitative spectral evaluation of shimmer and jitter. Journal of Speech and Hearing Research, 28, 169-174. KOIKE, Y. (1973). Application of some acoustic measures for the evaluation of laryngeal dysfunction. Studia Phonologica, 7, 17-23. KOIKE, Y., & HIRANO, M. (1968). Significance of vocal velocity index. Folia Phoniatrica, 20, 285-296. KOJIMA, H., GOULD, W. J., LAMBIASE,A., & ISSHIKI, N. (1980). Computer analysis of hoarseness. Acta Otolaryngologiea, 89, 547-554. KOMIYAMA,S., WATANABE,H., & RYU, S. (1984). Phonographic
Downloaded From: http://jshd.pubs.asha.org/ on 01/20/2014 Terms of Use: http://asha.org/terms
386
Journal of Speech and Hearing Disorders
relationship between pitch and intensity of the human voice,
Folia Phoniatrica, 36, 1-7. KREUL, E. J. (1972). Neuromuscular control examination (NMC) for Parkinsonism: Vocal prolongations and diadoehokinetic and reading rates. Journal of Speech and Hearing Research, I5, 72-83. KUNZE, L. (1962). An investigation of the changes in subglottal
air pressure and rate of air flow accompanying changes in fundamental frequency, intensity, vowels, and voice registers in adult male speakers. Unpublished doctoral dissertation, University of Iowa, Iowa City. LASS, N., & SANDUSKY,J. (1971). A study of the relationship of diadochokinetic rate, speaking rate and reading rate. Today's Speech, 19, 49-54. LEBEN, H. VON (1968). Objective measures of laryngeal function and phonetics. In A. Bouhuys (Ed.), Sound production in man. Annals of the New York Academy of Sciences, 155, 56-66. LEWIS, K., CASTEEL, R., & MCMAHON, J. (1982). Duration of sustained/a/related to fire number of trials. Folia Phoniatrica, 34, 41-48. LUDLOW, C. L., & HART, M. O. (Eds.). (1981). Proceedings of the
Conference on the Assessment of Vocal Pathology. ASHA Reports, 11. Rockville, MD: American Speech-LanguageHearing Association. LUNDEEN, C. W. (1950). The relationship of diadochokinesis to various speech sounds. Journal of Speech and Hearing Disorders, 15, 54-59. MCINTOSH, C. W., JR. (1939). A study of the relationship be-
tween pitch level and pitch variability in the voices of superior speakers. Unpublished doctoral dissertation. University of Iowa, Iowa City. MILNER-BROWN, H.S., MELLENTHIN, M., ~: MILLER, R.G. (1986). Quantifying human muscle strength, endurance and fatigue. Archives of Physical Medicine and Rehabilitation, 67, 530-535. MORGAN, M.J., & GILBERT, H.R. (1984). Relation between voice profile ratings and aerodynamic and acoustic parameters. Journal of Communication Disorders, 17, 245-260. MORRIS, R. J., & BROWN, W. S., JR. (1986). Age-related differences in speech intensity among females. Journal of the Acoustical Society of America, 79(Suppl. 1), 539. MUELLER, P. B. (1971). Parkinson's disease: Motor speech behavior in a selected group of patients. Folia Phoniatrica, 23, 333--346. MUELLER, P. B. (1982). Voice characteristics of octogenerian and nonagenerian persons. Ear, Nose and Throat Journal, 61, 33-37. MULLER, E. M., MILENKOVlC, P. H., & MACLEOD, G. E. (1984). Perioral tissue mechanics during speech production. In C. DeLisi & J. Eisenfeld (Eds.), Proceedings of the Second IMAC
International Symposium on Biomedical Systems Modeling. Amsterdam, Netherlands: North-Holland. MUNHALL, K. G., & OSTRY, D. J. (in press). Ultrasonic measurement of laryngeal kinematics. In I. R. Titze & R. C. Scherer (Eds.), Vocal fold physiology: Biomechanics, acoustics, and phonatory control. Denver: Denver Center for the Performing Arts. MURaY, T., & SCHMITKE, L.K. (1975). Air flow onset and variability. Folia Phoniatrica, 27, 401-409. MYSAK, E. D. (1959). Pitch and duration characteristicS of older males. Journal of Speech and Hearing Research, 2, 46-54. NEIMAN, G.S., & EDESON, B. (1981). Procedural aspects of eliciting maximum phonation time. Folia Phoniatrica, 33, 285-293. NELSON, W. L., PERKELL, J. S., & WESTBUnY, J. R. (1984). Mandible movements during increasingly rapid articulations of single syllables: Preliminary observations. Journal of the Acoustical Society of America, 75, 945-951. OSTRY, D. J., & MUNHALL, K. G. (1985). Control of rate and duration of speech movements. Journal of the Acoustical Society of America, 77, 640-648. OTIS, A. B., & GUYATT, A. R. (1968). The maximal frequency of breathing of man at various tidal volumes. Respiratory Physi-
52
367--387
N o v e m b e r 1987
ology, 5, 118-129. PEDERSON, M. F., MOLLER, S., KRABBE, S., • BENNETT, P. (1986). Fundamental voice frequency measured by electroglottography during continuous speech. A new exact secondary sex characteristic in boys in puberty. International Journal of Pediatric Otorhinolaryngology, II, 21-27. PHILHOUR, C.W., JR. (1948). An experimental study of the relationship between perception of vocal pitch in connected speech and certain measures of vocal frequency. Unpublished doctoral dissertation, University of Iowa, Iowa City. PORTNOY, R., & ARONSON, A. (1982). Diadochokinetic syllable rate and regularity in normal and in spastic and ataxic dysarthric subjects. Journal of Speech and Hearing Disorders, 47, 324-328. POSEN, A. L. (1972). The influence of maximum periora] and tongue force on the incisor teeth. Angle Orthodontist, 42, 285-309. POSEN, A. L. (1976). The application of quantitative perioral assessment to orthodontic case analysis and treatment planning. Angle Orthodontist, 46, 118-143. PTACEK, P. H., ~: SANDER, E. K. (i963). Maximum duration of phonation. Journal of Speech and Hearing Disorders, 28, 171-182. PTACEK, P. H., SANDER, E. H., MAHONEY, W. H., ~ JACKSON, C. C. (1966). Phonatory and related changes with advanced age. Journal of Speech and Hearing Research, 9, 353-360. RAHN, H., OTIS, A. B., CHADWICK,L. E., & FENN, W. O. (1946). The pressure-volume diagram of the thorax and lung. American Journal of Physiology, 146, 161-179. RAM!G, L. A., ~7 RINGEL, R. L. (1983). Effects of physiological aging on selected acoustic characteristics of voice. Journal of Speech and Hearing Research, 26, 22-30. REDDY, N. P., COSTARELLA, B. R., ~: GROTZ, R. C. (1985, October). Biomechanical measurements of the dysphagia patient. Paper presented at the Ninth Annual Conference of the American Society" of Biomechanics, Ann Arbor, MI. REICH, A. R., MASON, J. A., & POLEN, S. B. (1986). Task administration variables affecting phonation-time measures in thirdgrade girls with normal voice quality. Language, Speech, and Hearing Services in Schools, 17, 26"2-269. RINGQVIST, T. (1966). The ventillatory capacity in healthy subjects: An analysis of causal factors with special reference to the respiratory forces. Scandinavian Journal of Clinical and Laboratory Investigation, 18(Suppl. 88), 8-170. RONTAL, E., RONTAL, M., & ROLNICK, M. I. (1975). Objective evaluation of vocal pathology using voice spectrography. Annals of Otology, Rhinology, and Laryngology, 84, 1-10. SANT, L., & LOGEMANN, J. (1970). An investigation of the
variations in airflow and subglottal pressure with changes in pitch and intensity of phonation. Paper presented at the Annual Convention of the American Speech and Hearing Association, New York. SAWASHIMA, M. (1966). Measurements of the phonation time. Japanese Journal of Logopedies and Phoniatrics, 7, 23-29. SCHUTTE, H. K., & SEIDNER,W. (1983). Recommendation by the Union of European Phoniatricians (UEP): Standardizing voice area measurement/phonetography. Folia Phoniatrica, 35, 286-288. SHAPIRO, W., JOHNSTON, C.E., DAMERON, R.A., JR., & PATTERSON, J. L., JR. (1964). Maximum ventilatory performance and its limiting factors. Journal of Applied Physiology, 19, 199--203. SHATTUCK-HUFNAGEL, S. (1979). Speech errors as evidence for a serial order mechanism in sentence production. In W. E. Cooper & E. C. T. Walker (Eds.), Sentence processing. Hillsdale, NJ: Lawrence Erlbaum Associates. SHATTUCK-HUFNAGEL, S. (1983). Sublexical units and suprasegmental structure in speech production. In P.F. MacNeilage (Ed.), The production of speech (pp. 109-136). New York: Springer-Verlag. SHIPP, T., & MCGLONE, R. (1971). Laryngeal dynamics associated with voice frequency change. Journal of Speech and Hearing Research, 14, 761-768.
Downloaded From: http://jshd.pubs.asha.org/ on 01/20/2014 Terms of Use: http://asha.org/terms
KENT F,T AL.: Maximum Performance Tests
SIGURD, B. (1973). Maximum rate and minimal duration of repeated syllables. Language and Speech, 16, 373-395. SMITHEaAN, J. R., & H~ON, T. J. (1981). A clinical method of estimating laryngeal airway resistance during vowel production. Journal of Speech and Hearing Disorders, 46, 138--146. SONNINEN, A., HURME, P., TOIVONEN,R., & VILKMAN,E. (1985). Computer voice fields of connected speech. Papers in Speech Research, 93-111. Jyvaskyla, Finland: University of Jyvaskyla, Department of Communication. SORENSON, D., & HORII, Y. (1984). Frequency and amplitude perturbation in the voices of female speakers. Journal of Communication Disorders, 17, 65-83. STONE, R. E., JR. (1983). Issues in clinical assessment of laryngeal function: Contraindications for subscribing to maximum phonation time and optimum fundamental frequency. In D. M. Bless & J. H. Abbs (Eds.), Vocal fold physiology: Contemporary research and clinical issues (pp. 410-424). San Diego: College-Hill. STONE, R. E., JR., BELL, C. J., & CLACK,T. D. (1978). Minimum intensity of voice at selected levels within pitch range. Folia Phoniatrica, 30, 113-118. SUSSER, R., & BLESS, D. M. (1983). Vocal intensity levels of normal and voice disordered children. Proceedings of the XIX
Congress of the International Association of Logopedics and Phoniatrics. TAIT, N. A., MICHEL, J. F., & CARPENTER, M. A. (1980). Maximum duration of s u s t a i n e d / s / a n d / z / i n children. Journal of Speech and Hearing Disorders, 45, 239-246. TATSUMI,I. F., SASANUMA,S., HIROSE, H., & KIRITANI,S. (1979). Acoustic properties of ataxic and parkinsonian speech in syllable repetition tasks. Annual Bulletin of the Royal Institute of Logopedics and Phoniatrics (Tokyo), 13, 99-104. TAYLOR, T. J. (1980). Airflow parameters in college-age individuals. Unpublished master's thesis, Utah State University, Logan. THORMER, S. (1986). I1 fonetogramme. Acta Phoniatrica Latina, 8, 31-36. TIFFANY, W. (1980); The effects of syllable structure on diadochokinetic and reading rates. Journal of Speech and Hearing Disorders, 23, 894-908. VAN DEN BERG, J. W. (1956). Direct and indirect determination
of the mean subglottic pressure. Folia Phoniatrica, 8, 1-24. VAN OORDT, H. W. A., & DROST, H. A. (1963). Development of the frequency range of the voice in children. Folia Phoniatrica, 15, 289-298. VOGELSANGER,T. G. (1954). Experimentalle prtifung der stimmleistung beim singen. Folia Phoniatrica, 6, 193-227. WARREN, D. W. (1982). Aerodynamics of speech. In N. J. Lass, L.V. McReynolds, J.L. Nort]aern, & D.E. Yoder (Eds.),
Speech, language and hearing. Vol. I. Pathologies of speech and language (pp. 219-245). Philadelphia: W. B. Saunders. WILLIAMS, K. (1977). Performances of elementary school children on respirometric and phonatory measures. Unpublished master's thesis, Utah State University, Logan. WILSON, S. H., COOKE, N. T., EDWARDS,R. H. T., & SPIRO, S. G. (1984). Predicted normal values for maximal respiratory pressures in caucasian adults and children. Thorax, 39, 535-538. WORKINGER,M. S. (1986). Acoustic analysis of the dysarthria in children with athetoid and spastic cerebral palsy. Unpublished doctoral dissertation, University of Wisconsin, Madison. YANAGIHARA,N. (1967). Significance of harmonic changes and noise components in hoarseness. Journal of Speech and Hearing Research, 10, 531-541. YANAGIHAtla,N., & KOIKE,Y. (1967). The regulation of sustained phonation. Folia Phoniatrica, 19, 1-18. YANAGIHARA, N., & LEDEN, H. VON (1967). Respiration and phonation. Folia Phoniatrica, 19, 153-166. YOUNG, M., & BLESS, D. M. (1983). Relation of physical condition to age-related voice changes. Proceedings of the XIX
Congress of the International Association of Logopedics and Phoniatrics. YUMOTO, E., GOULD, W. J., & BAER, T. (1982). Harmonics-tonoise ratio as an index of the degree of hoarseness. Journal of the Acoustical Society of America, 71, 1544-1550. Received June 18, 1986 Accepted February 27, 1987 Requests for reprints should be sent to Ray D. Kent, Ph.D., Department of Communicative Disorders, University of Wisconsin-Madison, 1975 Willow Drive, Madison, WI 53706.
APPENDIX CONVERSION FACTORS AND ABBREVIATIONS Force 1N = 1 0 5 d y n = 8 3 . 8 5 g 1 dyn = 10 -s N 1 N = 0.2248 lb 1 lb = 4.4482 N Pressure 1 atm = 101.325 kPa = 760 mm Hg = 38.8 ft HeO 1 atm = 14.7 lb/in.2 = 1.01 x 10⁶ dyn/cm2 1 mm Hg = 133.32 Pa = 1 torr
387
1 bar = 100 kPa 1 kPa = 4.6 in. H~O = 11.67 cm H20 = 7.5 mm Hg Abbreviations arm = atmosphere dyn = dyne N = newton Pa = pascal g = gram
Downloaded From: http://jshd.pubs.asha.org/ on 01/20/2014 Terms of Use: http://asha.org/terms