KARACOR et al : STREAM TEMPERATURE OF DEGRIMENDERE RIVER USING ANN
363
Journal of Scientific & Industrial Research Vol. 66, May 2007, pp. 363-366
Maximum stream temperature estimation of Degirmendere River using artificial neural network Adil Gürsel Karaçor1*, Nüket Sivri2 and Osman Nuri Uçan3 1
2
TUAF Academy, Department of Computer Engineering, 34149, Istanbul, Turkey Department of Environmental Engineering, 3Department of Electrical & Electronics Engineering, Faculty of Engineering, Istanbul University, 34320, Istanbul, Turkey Received 09 May 2006; accepted 18 December 2006
Stream temperature determines the rate of the decomposition of organic matter and the saturation concentration of dissolved oxygen. Combined with industrial waste, stream temperature becomes a crucial parameter. Therefore, estimation of maximum stream temperature is very important, especially during summertime when the high temperatures may become dangerous for the habitat of rivers. A three-layered feed forward artificial neural network was developed to predict the maximum stream temperature of Degirmendere River for the five days ahead. Satisfactory results were achieved as the average prediction error turned out to be less than 1°C. Keywords: Artificial neural network, Black sea, Degirmendere river, Stream temperature
Introduction Perturbations of stream temperatures can drastically affect the habitat of a stream such as fish1. Water temperature determines the rate of decomposition of organic matter and saturation concentration of dissolved oxygen2. Recent studies at Degirmendere River measured physico-chemical parameters such as oil, grease, chemical oxygen demand and showed that values measured in river stations did not exhibit any temporal variations with exception of the temperature3,4. Increase in industrial waste cause decrease in dissolved oxygen levels5. Sudden increases in stream temperature can result in extremely low dissolved oxygen levels. Bacterial concentrations are dependent on specific conditions for growth, and these conditions change quickly. Although winter rains may wash more faecal matter from urban areas into a stream, cool water temperatures may cause a major die off. Exposure to sunlight (with its ultraviolet disinfection properties) may have the same effect, even in the warmer water of summertime6. Until recent years, the Eastern Black Sea ecosystem due to anthropogenic wastes has been affected in very negative ways7. The effects of misuse of herbicides or pesticides are seen in the sea ecosystem as well8. Degirmendere River is of special importance *Author for correspondence E-mail:
[email protected]
for the region considering its flow-speed, habitat and location. This study presents use of artificial neural network (ANN) based model to analyse and predict the maximum stream water temperature in Degirmendere River. Methodology Study Area
Degirmendere River9, located on the Northeast of Turkey (41º 00’ 03” N, 31º 45’ 50” E), flows through Zigana Mountain to Black Sea, which supplies drinking water for Trabzon (largest province in the region), springs from South of the province and flows to Black Sea. Water temperature measurements were recorded daily (Jan. 1996-Dec. 2004) at 10 river stations. Artificial Neural Network
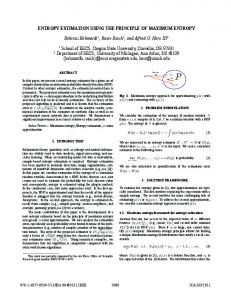
With sufficient number of hidden layers and neurons, ANNs can model any given input-output relationship. A classical multi-layered feed forward ANN has been used in this work (Fig. 1), with 6 inputs and 2 outputs. It has 3 hidden layers with 13, 8, and 5 nodes respectively. All inputs contain only past stream water temperature data, with the exception of input that indicates time of the year. This feature represents a distinction from other studies, which generally employ additional information such as air temperature. Though
364
J SCI IND RES VOL 66 MAY 2007
study concerned on maximum stream temperature for the next 5 days, a second output for minimum stream temperature for the next 5 days has also been conducted in order to achieve a better learning performance. Inputs
The 6 inputs used in the neural network are listed and explained as follows: Time of Year
A calendar year is divided into 24 equal periods and given a number between 1 and 24; hence each number referred to a fortnight period. This is done to account for seasonal fluctuations in stream temperature. Fig. 1— General structure of a multi-layer neural network
Current, Previous and Past Temperatures
Current stream water temperature in given in degrees Celsius. Previous stream temperature value is of the day before. Past stream temperature value recorded 8 days before.
MSE versus Epoch 0.05
MSE
0.045 0.04
Recent High and Low
Training MSE
0.035 0.03 0.025 0.02 0.015 0.01 0.005 0 1
150
299
448
597
746
895
1044 1193 1342 1491
Epoch
Fig. 2 — Mean squared error as the training evolves
Recent high is the highest stream temperature value recorded during the last 8 days. Recent low is the lowest stream temperature value recorded during the last 8 days. The inputs have been treated in two different groups prior to training: i) A standard normalization has been applied for the first inputs; and ii) A different normalization technique used for the remaining four inputs on the other hand. The normalizations have been
Table 1 — Statistical comparison of actual output and network output over test data Regression Statistics Multiple R 0.9686 R Square 0.9382 Adjusted R Square 0.9380 Standard Error 1.2301 Observations 330.00 ANOVA Regression Residual Total
df 1 328 329
SS MS F 7528.97 7528.97 4975.91 496.29 1.51 8025.26
Significance F 2.6731E-200
Intercept X Variable 1 Intercept X Variable 1
Coeffs -0.11 1.01 -0.11 1.01
Std Err 0.19 0.01 0.19 0.01
Lower 95% -0.50 0.98 -0.50 0.98
t Stat -0.59 70.54 -0.59 70.54
P-value 0.55 0.00 0.55 0.00
Upper 95% 0.27 1.03 0.27 1.03
Lower 95.0% -0.50 0.98 -0.50 0.98
Upper 95.0% 0.27 1.03 0.27 1.03
365
KARACOR et al : STREAM TEMPERATURE OF DEGRIMENDERE RIVER USING ANN
Table 2 — Sample input-output and error data of the neural network Normalized Outputs Temp. 8.7 15.5 14 6.6 17 12.6 5 7 8 9 8 19 5 17 6 11 8 9 13 12
Time 5 19 21 23 14 10 4 1 7 22 1 13 2 13 2 9 23 5 9 10
C1 1.0000 1.0000 0.9857 1.3030 1.0000 0.9524 1.0000 1.1429 0.8250 1.0000 1.0000 0.8947 1.0000 0.9412 0.9167 1.0000 1.0000 0.9444 0.9615 1.0833
C8 0.6897 1.0323 0.7857 1.5152 0.9412 0.9127 1.2000 1.1429 1.1250 0.9444 1.1250 0.8947 1.6000 0.8824 1.0000 0.9091 1.0000 0.8889 0.7692 1.0833
H81.0000 1.0968 1.0000 1.5152 1.1176 1.0000 1.2000 1.2857 1.0875 1.0000 1.0000 1.0000 1.4000 1.0000 1.3333 1.0909 1.1250 1.0000 1.0000 1.1667
L80.7471 0.9677 0.8571 1.0000 0.9412 0.8333 0.9000 1.0000 0.8250 0.7778 0.9375 0.8421 1.0000 0.8235 0.9167 0.8182 0.9375 0.8889 0.8462 1.0000
H5+ 1.0345 1.0968 0.9571 1.3636 1.0588 1.0714 1.6000 1.2857 1.1250 1.0000 0.8750 0.8947 1.6000 1.0000 1.3333 1.1818 1.0000 0.9667 1.0769 1.1667
L5+ 0.9195 0.8387 0.7857 0.7576 0.9412 0.9524 0.9600 0.8571 1.0000 0.8889 0.7500 0.8421 1.0000 0.9412 0.8333 1.0909 0.9375 0.9111 0.9231 1.0000
carried out in order to achieve a better learning and generalization. Major (75%) data was used for training neural network and remaining (25%) for testing.
H5+ Out 1.1129 1.0422 0.9949 1.3099 1.0579 1.0790 1.2288 1.1567 1.1666 1.0323 1.1267 1.0275 1.2561 1.0365 1.2045 1.1054 1.0845 1.1198 1.0750 1.1114
Temperature Outputs L5+ Out 0.8875 0.9309 0.8816 0.9655 0.9397 0.9122 0.9338 0.9479 0.9244 0.8702 0.9404 0.9298 0.9936 0.9164 0.9373 0.9079 0.8911 0.9192 0.9095 0.9498
Actual 9 17 13.4 9 18 13.5 8 9 9 9 7 17 8 17 8 13 8 8.7 14 14
N.Net 9.6825 16.1535 13.9293 8.6456 17.9850 13.5956 6.1438 8.0969 9.3328 9.2911 9.0136 19.5226 6.2807 17.6205 7.2268 12.1590 8.6760 10.0778 13.9750 13.3365
Abs Err. 0.6825 0.8465 0.5293 0.3544 0.0150 0.0956 1.8562 0.9031 0.3328 0.2911 2.0136 2.5226 1.7193 0.6205 0.7732 0.8410 0.6760 1.3778 0.0250 0.6635
% Err. 7.5830 4.9797 3.9499 3.9373 0.0835 0.7081 23.2028 10.0340 3.6981 3.2346 28.7661 14.8389 21.4909 3.6502 9.6647 6.4695 8.4498 15.8369 0.1783 4.7390
have been attained using only past stream temperature data and no other extra data, such as air temperatures. This makes predictions possible with simple measurements. Introduction of additional inputs can be
Results The network has been trained until results stopped improving for the test set, and weights have then been saved. During training process, how the mean squared training error changed is illustrated in Fig. 2. A detailed statistical analysis was made on the test data, in order to compare the network’s produced outputs with the actual temperature values (Table 1). Sample inputoutput data and the relevant error rates of ANN are given in Table 2. A graphical comparison has been made between the actual 5-day high temperature values and ANN outputs by plotting the corresponding values in a single chart (Fig. 3). Average absolute prediction error (mean value of absolute difference between the actual 5-day high temperature and its network estimate) turned out to be 0.93 °C. This value has been measured over the test set of course. Regression line fit graph is also shown (Fig. 4). Conclusions This is very useful information as the fluctuations in stream water temperature have a direct impact on the river life, especially on fish. Although high stream temperatures can be of major concern during the summer, ANN has proven to predict high temperature values throughout the year. These results
Fig. 3— Graphical comparison of actual output and network output
Fig. 4— Regression line over test set
366
J SCI IND RES VOL 66 MAY 2007
considered for further research to see if they can improve predictions. On the other hand, similar systems can be developed for different rivers in order that high stream temperatures are predicted beforehand.
5
6
References 1
2 3
4
Boyee K D, A guide to stream habitat analysis using the instream incremental methodology, In-stream Flow Information Pap 12 (U S Fish and Wildlife Service EWS/OBS-82/26, USA) 1982, pp248. Nemerow N L, Stream, Lake, Estuary, and Ocean Pollution (Van Nostrand, Reinhold Company, Inc., New York) 1985. Boran M & Karaçam H, The seasonal variation in pollutants load on Deirmendere and Karadere Rivers, J Fisheries & Aquat Sci, 3-4 (1996) 395-402. Bakan G & Büyükgüngör H, The Black Sea, Marine Pollut Bull, 41 (2000) 24-43.
7
8 9
Rounds S A, Development of neural network model for dissolved oxygen in the Tualantin River, Oregon, Proc 2nd Fed Interagency Hydrologic Modeling Conf, Las Vegas, Nevada, 2002. Yükselen M A, Kerç A & Saatçi A M, (), Effect of Solar Intensity on Bacterial Die-off, Proc 2nd Int Conf Mediterranean Coastal Environ, MEDCOAST 95, Spain, 1995, 1579-1585. Sivri N, Seyhan K & Mazlum E, The Effect of Pollution and Human Impact on the Biodiversity in the Eastern Black Sea Marine Ecosystem, edited by C H R Heip et al (Netherlands Institute of Ecology-Centre for Estuarine and Marine Ecology: Yerseke, The Netherlands) 2003, pp 85. Sivri N, Effects of Solakl1 River on Pelagic Ecosystem, Ph D Thesis, KTU, 1999. Sivri N, Kose E & Feyzioglu A M, Modelling the effects of industrial discharged waters to Degirmendere River (South Eastern Black Sea), J Sci Ind Res, 65 (2006) 632-638.