MC/DC based estimation and detection of residual faults in PLC logic networks Peter G Bishop
Centre for Software Reliability, London, UK
[email protected] Abstract—A logic coverage measure related to MC/DC testing is used to estimate residual faults. The residual fault prediction method is evaluated on an industrial PLC logic example. A randomized form of MC/DC testing is used to maximize coverage growth and fault detection efficiency.
I. INTRODUCTION Coverage measurement has been used to estimate residual faults in program code [1,2]. The basic idea is that the relationship between code covered and faults found is nearly linear, so it is possible to estimate the number of residual faults from the proportion of uncovered code. In this paper we apply the same concept to PLC logic networks rather than conventional program code—combined with a random test strategy designed to maximize coverage growth. We based our study on a PLC logic network taken from an industrial example that had 36 binary inputs and 10 binary outputs. There were also 6 known faults in the initial logic implementation. II. LOGIC COVERAGE MEASURES Clearly to apply the approach to a logic network we needed an equivalent measure of logic coverage. We considered input value coverage, where all possible combinations of input values are covered, and output value coverage where all possible combinations of output values are covered. However the main measure chosen for this study was input-output pair coverage where input values are selected such that change of a given binary input i can “toggle” the state of a binary output j. There is a strong relationship between input-output pair coverage and the Modified Condition/Decision Coverage (MC/DC) test method used in conventional programs [3]. MC/DC tests are designed so that a change in every Boolean condition “toggles” the Boolean value of the overall IF condition. With 36 inputs and 10 outputs and a maximum of 4 inputoutput combinations, the maximum number of combinations is 1440. In practice the number of actual combinations could much less due to constraints between inputs and outputs imposed by the logic network. In this particular example, the constraints reduced the number of I-O pairs to 236. III. MC/DC RANDOM TEST STRATEGY Conventional random testing uses a uniform random input distribution with a probability pi = 0.5 that an input is set Copyright 2003 Chillarege Press
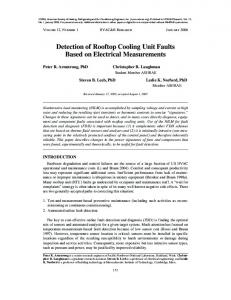
TRUE for all inputs i. We propose an alternative strategy where we seek to achieve a uniform output probability—where the input probabilities pi are chosen so that pj = 0.5. for all outputs j. The rationale for uniform output probability testing is that it will maximize the output coverage growth measure, and also increase I-O pair coverage growth as there is a 50% that each output can be “toggled” by a change in an input. In order to achieve uniform output coverage, it was necessary to devise a procedure for back-propagating assigned output probabilities to the inputs. The rules for back propagation through logic are quite simple: AND: pin = pout1/n pin = 1 – (1 – pout )1/n OR: NOT: pin = (1 – pout ) where: n is the number of inputs to the logic gate, px is the probability of TRUE value on link x, This is illustrated in the figure below for a simple singleoutput network, where a pj value of 0.5 is back propagated to the inputs to derive input probabilities pi. Pi 0.49
A AND
0.49 0.49
0.5 0.24
B C
0.49
D
0.29
E
OR AND 0.29
0.24
OR
Pj
0.71 AND
0.42
0.5
0.71
NOT
Figure 1. Back propagation of probability values In practice, back propagation is constrained by network junctions and feedback loops. For example in the figure above, the feedback loop forces one input to the OR gate to be 0.5. When one input probability is constrained to p*in, it can be shown that he probability for the remaining inputs pin is: pin = 1 – ((1 – pout )/(1 – p*in)) 1/n-1 Hence for p*in=0.5, pout=0.71 and n=2, we obtain 0.42 for the other input. When back-propagation was applied to the actual network of 36 inputs and 10 outputs, the interconnection constraints meant that the “ideal value” of pj = 0.5 could not be achieved Fast Abstract ISSRE 2003
(as negative values for pin are derived during back propagation). Compromise values for the output probabilities (typically of the order of 0.3) were chosen instead to obtain valid input probabilities. The distribution of input probabilities to achieve near uniform output probabilities is shown in the figure below. It is clear that the input probabilities can be quite extreme (close to zero or 1). 1 0.9 0.8 0.7 0.6 P(i) 0.5 0.4 0.3 0.2 0.1 0 1
tests than other methods. Actual fault detection performance is shown in Table 1. TABLE 1 FAULT DETECTION PERFORMANCE Number Faults detected of tests MCDC Random Systematic test input tests 10 4 0 ? 100 5 0 ? 486 6 0 4 1000 6 0 3000 6 1 9514 6 4 10000 6 4 100000 6 6 1000000 6 6
36
Input i
Figure 2. Distribution of input probabilities We can view this input distribution as the probabilistic equivalent of an MC/DC test pattern as it maximizes the chance of specifying inputs patterns where an output will change if a single input bit is changed.
As expected, the MC/DC test appears to out-perform the other test strategies, finding the first 4 faults in 10 random tests and all 6 in 486 tests, while the systematic tests had only detected 4 faults at this stage, and random input testing had found none. 100% I-O pair coverage is achieved with 3000 tests, giving high confidence that there are no residual faults. V. CONCLUSIONS
IV. Test EFFECTIVENESS I-O pair coverage was compared against faults found using three different test strategies: MC/DC random testing, uniform random input testing (pin = 0.5) and a set of 486 systematic tests developed for the original industrial logic implementation (see the figure below).
1. 2.
I-O pair coverage was strongly correlated with the faults found in the logic network. MC/DC random testing was more effective than random input testing and an existing systematic test set—probably because coverage growth was faster. ACKNOWLEDGMENT
6
This work was funded by the UK (Nuclear) Industrial Management Committee (IMC) Nuclear Safety Research Programme under British Energy Generation UK contract 40029264 with contributions from British Nuclear Fuels plc, British Energy Ltd and British Energy Group UK Ltd. The paper reporting the research was produced under the EPSRC research interdisciplinary programme on dependability (DIRC).
5 4
Faults 3 detected 2
MCDC Random Uniform Random Systematic tests
1
REFERENCES
0 0
0.2
0.4 0.6 I-O Pair coverage
0.8
1
Figure 3. Faults detected vs. I-O pair coverage However the actual number of tests needed to achieve a given coverage varied dramatically (around 1000 random input tests were equivalent to one MC/DC test in terms of I-O pair coverage achieved). As MC/DC testing results in fast coverage growth and coverage is strongly correlated with faults found, we would expect MC/DC testing to find the faults with less
Copyright 2003 Chillarege Press
[1] P.G. Bishop, “Estimating Residual Faults from Code Coverage”, SAFECOMP 02, Catania, Italy, 10-13 Sep 2002, pp. 163-174 [2] Y.K. Malaiya, J. Denton and M.N. Li., “Estimating the number of defects: a simple and intuitive approach”, Proceedings ISSRE 98, Paderborn, Germany, November 4-7, 1998, pp. 307-315 [3] RTCA DO-178B (and EUROCAE ED-12), “Software considerations in airborne systems and equipment certification”, 1993
Fast Abstract ISSRE 2003