nominal oil concentrations from 0% to 5%. The test results show that frictional pressure drop of an R-410A/oil mixture increases with the mass flux, the presence ...
©2008, American Society of Heating, Refrigerating and Air-Conditioning Engineers, Inc. (www.ashrae.org). Published in HVAC&R Research, Vol. 14, No. 5 (September 2008). For personal use only. Additional reproduction, distribution, or transmission in either print or digital form is not permitted without ASHRAE's prior written permission.
VOLUME 14, NUMBER 5
HVAC&R RESEARCH
SEPTEMBER 2008
Measurement and Correlation of Frictional Pressure Drop of R-410A/Oil Mixture Flow Boiling in a 7 mm Straight Smooth Tube Haitao Hu Zhence Wang
Guoliang Ding, PhD Wenjian Wei Kaijian Wang, PhD
Received January 31, 2007; accepted April 14, 2008
Two-phase frictional pressure drop characteristics of an R-410A/oil mixture flow boiling inside a straight, smooth tube with an outside diameter of 7.0 mm were investigated experimentally. Experimental parameters include an evaporation temperature of 5°C, mass fluxes from 200 to 400 kg/(m2·s), heat fluxes from 7.56 to 15.12 kW/m2, inlet vapor qualities from 0.2 to 0.7, and nominal oil concentrations from 0% to 5%. The test results show that frictional pressure drop of an R-410A/oil mixture increases with the mass flux, the presence of oil enhances two-phase frictional pressure drop, and the effect of oil on frictional pressure drop is found to be more evident at higher vapor qualities where the local oil concentrations are higher. A new correlation to predict the local frictional pressure drop of an R-410A/oil mixture flow boiling inside a straight, smooth tube is developed based on the local properties of the refrigerant/oil mixture, and it agrees with 92% of the experimental data within a deviation of ±15%.
INTRODUCTION The near-azeotropic refrigerant mixture of R-410A, a mixture of 50% wt. R-32 and 50% wt. R-125, has been considered one of the primary replacements for R-22 in air-conditioning system applications. Under real working conditions, boiling of a refrigerant and oil mixture occurs in the evaporators of compression air-conditioning systems. The presence of oil has a significant impact on refrigerant evaporation pressure drop characteristics because oil changes the refrigerant thermal and transport properties, such as saturated temperature, density, viscosity, thermal conductivity, etc. Consequently, pressure drop behaviors of an R-410A/oil mixture flow boiling inside tubes must be known in order to investigate the overall performance of the heat exchangers of R-410A air-conditioning systems. Two-phase pressure drop performance of an oil-free R-410A flow boiling inside horizontal straight tubes was reported by Park and Hrnjak (2007), Jassim and Newell (2006), Kim and Shin (2005), Yun et al. (2006), Wellsandt and Vamling (2005), Sami and Comeau (2002), Kim et al. (2002), Goto et al. (2001), Wang et al. (1998), Ebisu and Torikoshi (1998), and others. Shen and Groll (2005) critically reviewed the influence of lubricants on the pressure drop of refrigerants. Although there are many studies on flow boiling pressure drop characteristics of refrigerant/oil mixtures—Wei et al. (2007) and Tichy et al. (1986) for an R-22/oil mixture, Barbosa et al. (2004) for an R-12/oil mixture, Eckels et al. (1994, 1998a, 1998b) and Nidegger et al. (1997) for an R-134a/oil mixture, Zurcher et al. (1997) for an R-134a/oil mixture, Zurcher et al. (1998a, 1998b) for an R-407C/oil mixture, Schlager et al. (1989a, 1989b, 1990) for an R-22/oil mixture, and Alofs Haitao Hu and Wenjian Wei are doctoral candidates, Zhence Wang is a master’s candidate, and Guoliang Ding is a professor in the Institute of Refrigeration and Cryogenics, Shanghai Jiao Tong University, Shanghai, China. Kaijian Wang is a senior engineer at the Fujitsu General Institute of Air-Conditioning Technology Ltd., Kawasaki, Japan.
763
764
HVAC&R RESEARCH
and Hasan (1990) for an R-502/oil mixture—few papers report on similar characteristics of an R-410A/oil mixture. Available experimental data of flow boiling pressure drop characteristics of refrigerant/oil mixtures show that the presence of oil always enhances two-phase frictional pressure drop. Different refrigerant/oil mixtures have varying frictional pressure drop characteristics, and the pressure drop correlation, developed based on one refrigerant/oil mixture, needs to be verified before it is used to predict pressure drop characteristics of other refrigerant/oil mixtures. Therefore, the tests of flow boiling pressure drop characteristics using an R-410A/oil mixture as the working fluid are necessary. The purpose of this study is to experimentally obtain the frictional pressure drop characteristics for an R-410A/oil mixture flow boiling inside a straight, smooth tube; to verify the state-of-the-art pressure drop correlations of the refrigerant/oil with the experimental data; and finally to present a better correlation for predictions of frictional pressure drop of an R-410A/oil mixture flow boiling in smooth tubes.
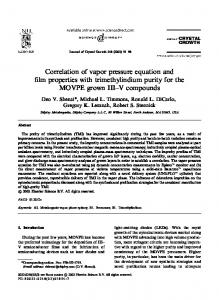
EXPERIMENT APPARATUS The experimental rig used for the R-410A/oil mixture, schematically shown in Figure 1, consists of three loops: a refrigerant main loop, a refrigerant bypass loop, and a lubricant oil
Figure 1. Schematic of experimental rig: (1) outdoor unit, (2) compressor, (3) condenser, (4) electronic expansion, (5) oil separator, (6) oil tank, (7) capillary, (8) indoor unit, (9) post heater, (10) refrigerant mass flowmeter, (11) check valve, (12) oil mass flowmeter, (13) oil pump, (14) regulating valve, (15) oil tank, (16) oil separator, (17) mixing chamber, (18) sampling cylinder, (19) preheater, (20) tube sight glass, (21) test section, (22) post-heater, (23) and sight glass.
VOLUME 14, NUMBER 5, SEPTEMBER 2008
765
loop. In the refrigerant main loop, a portion of subcooled liquid refrigerant from the condenser passes through a refrigerant mass flowmeter and an electronic expansion valve (EEV) and leaves partially evaporated. Then it flows through a preheater to achieve the set quality at the inlet of the test section. The refrigerant enters the test section at a known mass flux and vapor quality and is evaporated by an electric heating tape wrapped around the outside of the test tube. The two-phase mixture leaves the test section and enters a post heater (electric heater) where it is fully evaporated and superheated. The superheated vapor flows through three oil separators in parallel, joins with the refrigerant vapor from the bypass loop, and enters the suction inlet of a variable-frequency compressor. The refrigerant bypass loop is used to vary both refrigerant flow rate (to the main loop) and evaporation pressure. In this loop, the remaining portion of liquid refrigerant from the condenser enters an EEV and leaves partially evaporated. It flows through an indoor evaporation unit and a post heater (electric heater) where it is finally fully evaporated and superheated. It joins the refrigerant vapor from the main loop and enters the compressor, as described above. The lubricant oil loop is designed to investigate the influence of lubricant oil on the two-phase heat transfer performance of the refrigerant. The lubricant oil is removed at the separator, collected in an oil tank, and injected into the refrigerant main loop by a high-pressure oil pump. Lubricant flow rate is controlled by regulating the opening of a valve in the bypass oil circuit and is measured by a high-precision Coriolis-effect flowmeter. Refrigerant liquid and oil are mixed together in a mixing chamber located between the refrigerant mass flowmeter and the EEV. Electric heating tape is wrapped around the outside of the test tube, and the heat addition to the test section is varied by adjusting the input power to the electric heating tape. The test section is insulated at the outside of the electric heating tape with glass wool and double layers of rubber foam to reduce heat loss to the surroundings. Heat losses from the preheater and test section are estimated to be less than 3.3%. Wei et al. (2007) wrote a detailed introduction to the experimental rig when he used it for the tests of R-22 and R-22/oil mixture. In order to investigate the evaporation pressure drop performance of oil-free refrigerants, three high-efficiency oil separators were installed in a series at the compressor exit to remove the lubricant oil carryover in the discharged vapor from the compressor. The effectiveness of the oil separators is determined by a boiling-off-and-weighing method based on ANSI/ASHRAE Standard 41.1, Standard Method for Measurement of Proportion of Lubricant of Liquid Refrigerant (ASHRAE 2006). Three samples of the refrigerant/oil mixture at the condenser outlet are taken for maximum oil discharge from the compressor at the 50 Hz frequency. The average sampled oil concentration of only 0.02% shows that the three oil separators work well. The test section used in this study is a smooth tube with outside and inside diameters of 7.00 and 6.34 mm, respectively, and the roughness of the test tube is 0.4 µm. The total length of the test tube is 2000±2.0 mm, while the effective heating length is 1800±2.0 mm. Tube wall thickness is 0.33±0.03 mm. The test fluids are R-410A and ester oil RB68EP. The ester oil is widely used in R-410A air conditioners for its good miscibility with R-410A, and ester oil RB68EP is one of the most common ester oils for R-410A air conditioners. Therefore, ester oil RB68EP was chosen as the lubricating oil to be investigated in this study. The lubricating oil is ester oil of commercial ISO Grade 68 with a density of 0.964 g/cm3 at 15°C and kinematic viscosities of 66.79 and 8.23 mm2/s at 40°C and 100°C, respectively, as reported by the manufacturer. The oil is completely miscible with R-410A over the entire oil mass fraction range from 0% to 100% for the temperature range of the present tests and at all points in the test loop. Miscibility of the refrigerant and oil is checked with the correlation presented in Appendix A. Test conditions of the test tube are tabulated in Table 1. All signals of temperature, pressure, pressure difference, and mass flow rate are collected by an Agilent 34970A data acquisition system and transmitted to a computer after the system reaches stable conditions.
766
HVAC&R RESEARCH
Table 1. Test Conditions of the Test Tube Mass Flux, Heat Flux, kg/m 2·s kW/m2
Inlet Quality
Evaporating Outlet Pressure, Temperature, kPa °C
200±10
7.56
0.2~0.7
5±0.2
934±5
300±10
11.32
0.2~±0.7
5±0.2
934±5
400±10
15.12
0.2~0.7
5±0.2
934±5
Oil Concentration, wt. %
Data Points
0, 1, 2, 3, 4, 5
108
DATA REDUCTION AND UNCERTAINTY Frictional Pressure Drop The total pressure drop ΔP t ot al of the two-phase flow inside the horizontal tube is composed of the frictional pressure drop ΔP f ri ct and the acceleration pressure drop ΔP m om , expressed as follows: ΔP t ot al = ΔP frict + ΔP mom
(1)
In Equation 1, ΔP m om is estimated from Equation 2. The acceleration pressure drop was always less than 5% of the total pressure drop at the test conditions during the experiments. ⎧ G 2 x2 G 2 ( 1 – x ) 2 ⎫ ΔP m om = Δ ⎨ ----------- + -------------------------- ⎬ ( 1 – ε )ρL ⎭ ⎩ ερV
(2)
In Equation 2, ε is a void fraction of the refrigerant/oil mixture and can be estimated from Steiner’s (1993) version of Rouhani and Axelsson’s (1970) drift flux model for horizontal tubes: x r, o x r, o 1 – x r, o⎞ 1.18 ( 1 – x r, o ) [ gσ r, o ( ρ r, o, L – ρ r, V ) ] 0.25 ε = ---------- ( 1 + 0.12 ( 1 – x r, o ) ) ⎛ --------- + ------------------ + -------------------------------------------------------------------------------------------------⎝ρ ρ r, V ρ r, o, L ⎠ G ρ0.5 r, V
–1
(3)
r, o r, o, L
where x r, o ρ r, V ρ r, o, L σ r, o
= = = =
local vapor quality of the refrigerant/oil mixture vapor-phase density of pure R-410A, kg/m3 liquid-phase density of R-410A/oil mixture, kg/m3 surface tension of R-410A/oil mixture, N/m
Therefore, ΔP f ri ct is obtained from the measured total pressure drop ΔP t ot al and Equation 1.
Local Vapor Quality For oil-free refrigerants, vapor quality x r is defined as the mass of refrigerant vapor divided by the total mass of refrigerant vapor and refrigerant liquid: m r, V x r = ---------------------------m r, V + m r, L
(4)
VOLUME 14, NUMBER 5, SEPTEMBER 2008
767
For refrigerant/oil mixtures, the local vapor quality, x r, o , is defined by Thome (1995) as the total mass of vapor (all refrigerants in the present case) divided by the total mass of fluid (refrigerant plus oil): m r, V x r, o = ----------------------------------------m r, V + m r, L + m o
(5)
where xr x r, o m r, V m r, L mo
= = = = =
vapor quality of the refrigerant local vapor quality of the refrigerant/oil mixture mass flow rate of the refrigerant vapor phase, kg/h mass flow rate of the refrigerant liquid phase, kg/h mass flow rate of oil, kg/h
The local vapor quality is based on total weight of the refrigerant/oil mixture and is calculated using the enthalpy of the refrigerant/oil mixture. The enthalpy of the refrigerant/oil mixture is obtained by summing the enthalpies of each component: mo ⎞ - ⋅h ( m o + m r ) ⋅ h r, o = m o ⋅ h o + ( m o + m r ) ⋅ x r, o ⋅ h r, V + ( m o + m r ) ⋅ ⎛ 1 – x r, o – -----------------⎝ m + m ⎠ r, L o
(6)
r
The inlet and outlet vapor qualities of the test section are obtained similarly to Equation 6 as follows: ( m o + m r ) ⋅ h r, o, i n – m o ⋅ h o, i n – m r ⋅ h r, L , i n ( x r, o ) in = ---------------------------------------------------------------------------------------------------------( m o + m r ) ⋅ ( h r, V, i n – h r, L, in )
(7)
( m o + m r ) ⋅ h r, o, out – m o ⋅ h o, out – m r ⋅ h r, L, out ( x r, o ) out = -----------------------------------------------------------------------------------------------------------------( m o + m r ) ⋅ ( h r, V, out – h r, L, out )
(8)
The specific enthalpies of the refrigerant/oil mixture at the test section inlet and outlet, h r, o, in and h r, o, out , respectively, are calculated by the heat balance equations: h r, o, in = h r, o, 1 + Q pre ⁄ ( m o + m r )
(9)
h r, o , out = h r, o, 1 + ( Q pre + Q te st ) ⁄ ( m o + m r )
(10)
mr mo h r, o, 1 = ------------------------ ⋅ h r, 1 + ------------------------ ⋅ h o, 1 ( mo + m r ) ( mo + m r )
(11)
where h r, o , 1 Q pre Q t est
= specific enthalpy of the refrigerant/oil mixture at the inlet of the electronic expansion valve, which is obtained by summing mass-weighted enthalpies of the refrigerant and oil, kJ/kg = heat addition of preheater, W = heat addition of the test section, W
768
HVAC&R RESEARCH
Oil Concentration Nominal oil concentration and local oil concentration are defined by Equations 12 and 13, respectively: ω no = m o ⁄ ( m o + m r )
(12)
mo ω no ω local = ----------------------- = ----------------m o + m r, L 1 – x r, o
(13)
where ω no ω local x r, o
= nominal oil concentration, defined as oil mass fraction in subcooled liquid before evaporation begins = local oil concentration, defined as oil mass fraction in liquid phase of refrigerant/oil mixture = local vapor quality of refrigerant/oil mixture
Nominal oil concentration is the same as the circulating oil concentration and remains constant throughout the test section. Mass flow rates of refrigerant and oil are measured by Coriolis flowmeters. The accuracy of nominal oil concentration is evaluated by sampling liquid of the refrigerant/oil mixture at the outlet of the mixing chamber in front of the EEV. Sampled oil concentration and nominal oil concentration calculated in Equation 12 are compared at a refrigerant mass flow rate of 400 kg/(m2·s). In this experiment, the maximum error between the two oil concentrations is 8.4%, and the average error is 4.2%.
Uncertainties The uncertainties of instruments used in measuring pressure drop are listed in Table 2. The uncertainties of parameters are estimated based on the analysis of error propagation reported by Moffat (1998). The largest uncertainty of pressure drop occurs at low mass flux due to the absolute small values of pressure drop in these cases.
EXPERIMENTAL RESULTS AND DISCUSSIONS Two-phase pressure drops were measured by the differential pressure transducer, and frictional pressure drops were obtained by taking out the acceleration components from the differential pressure drop measurements. In order to quantify and analyze the oil effect on local two-phase frictional performance, an enhancement factor for pressure drop PF is defined as the ratio of the two-phase pressure drop of the refrigerant/oil mixture to that of pure refrigerant, as presented as Equation 14: PF = ΔP tp, r, o ⁄ ΔP t p, r
(14)
Figure 2 depicts all the frictional pressure drop data plotted by nominal oil concentration ω no . It shows that frictional pressure drop always increases with the increase of mass flux, vapor quality, and nominal oil concentration. The effect of vapor quality on pressure drop is very significant. The effect of oil on two-phase pressure drop is found to be more evident at higher vapor qualities where the local oil concentrations are higher. It is conjectured that higher local oil concentrations lead to higher local liquid viscosities, which causes higher pressure drops, so the effect of oil on the frictional pressure drop becomes larger at high vapor qualities. Figure 3 shows the enhancement factor changing with local vapor quality at different nominal oil concentrations. It shows that the enhancement factor is always larger than unity and increases with nominal oil concentration at a given vapor quality. The enhancement factors are
VOLUME 14, NUMBER 5, SEPTEMBER 2008
769
Table 2. Uncertainties of Instruments and Pressure Drop Parameter
Major Source of Uncertainty
Instrument
Range
Maximum of Uncertainty
Refrigerant mass flow rate
Instrumentation calibration
Coriolis-effect flowmeter
0~200 kg/h
±0.12% FS
Oil mass flow rate
Instrumentation calibration
Coriolis-effect flowmeter
0~20 kg/h
±0.12% FS
Heat addition
Instrumentation calibration, heat loss
Power meter
0~5 kW
±3.4%
Temperature
Instrumentation calibration
Type T thermocouple
–20°C~100°C
±0.1°C
Vapor quality
Properties of refrigerant/oil mixture, mass flow rate, heat addition
Calculated
0~1
±4.53%
Mass flux
Mass flow rate, diameter measurement
Calculated
200~400 kg/(m2·s)
±1.4%
Heat flux
Power, diameter, and length measurements
Calculated
7.56~15.12 kW/m 2
±1.8%
Nominal oil concentration
Mass flow rate of refrigerant and oil
Calculated
0%~5%
±0.24%
Pressure
Instrumentation calibration
Absolute pressure transducer
0~2 MPa
±0.12% FS
Pressure drop
Instrumentation calibration
Differential pressure transducer
0~100 kPa
±0.2% FS
Figure 2. Frictional pressure drop for an R-410A/oil mixture at mass fluxes of 200, 300, and 400 kg/(m2·s).
770
HVAC&R RESEARCH
Figure 3. Enhancement factor of the pressure drop for an R-410A/oil mixture at mass fluxes of 200, 300, and 400 kg/(m2·s).
bigger at low and high vapor qualities ( x r, o < 0.5 and x r, o > 0.6) than that at intermediate vapor qualities (0.5 < x r, o < 0.6). It is conjectured that oil promotes the transition of flow pattern to annular flow at low vapor quality and delays the transition of flow pattern from annular to dryout flow at high vapor quality, so the presence of oil evidently enhances the pressure drop, while at intermediate vapor qualities where the flow pattern is annular flow for R-410A and R-410A/oil mixtures, the influence of oil on flow pattern is weak, so the enhancement factor is less at middle vapor qualities than that at low and high vapor qualities. Figure 3 also shows that the enhancement factor decreases with the increase of mass flux. It is conjectured that large mass flux promotes annular flow; in this case, the effect of lubricant would be weaker and, therefore, the increase of mass flux conceals the enhanced influence of oil on pressure drop.
CORRELATIONS OF FRICTIONAL PRESSURE DROP Predictability Verification of Existing Pressure Drop Correlations of Refrigerant/Oil Mixtures to Experimental Data of R-410A/Oil The available pressure drop correlations for refrigerant/oil mixture flows boiling inside horizontal smooth tubes are tabulated in Appendix B (Table B1). All of these correlations can predict the experimental data satisfactorily on their own, but the predictabilities of these correlations to the experimental data of the R-410A/oil mixture are uncertain and should be investigated. These correlations of pressure drop for refrigerant/oil mixtures can be classified into three categories. The first category uses enhancement factors (PF) to correct the frictional two-phase pressure drop of pure refrigerant. Pressure drop correlations of Tichy et al. (1986), Schlager et al. (1990), and Eckels et al. (1994, 1998a) belong to the first kind of correlations. These correlations are
VOLUME 14, NUMBER 5, SEPTEMBER 2008
771
developed based on the results of pure refrigerant directly, and only nominal oil concentration and mass flux are considered in the enhancement factors. Figures 4a, 4b, and 4c show comparisons of the predicted PF of these correlations with the experiment PF of the R-410A/oil mixture. Figures 5a, 5b, and 5c show the comparisons of the predicted frictional pressure drops of these correlations with the experimental data of the frictional pressure drop of the R-410A/oil mixture. The predicted frictional pressure drop of the R-410A/oil mixture is calculated by Equation 15: ΔP r, o, f ri ct = PF ⋅ ( ΔP r, frict )Ebisu
(15)
In Equation 15, ( ΔP r, f ri ct ) Ebi su is the predicted frictional pressure drop of Ebisu and Torikoshi’s (1998) correlation for oil-free R-410A flows in straight smooth tubes. Figures 4 and 5 show that the deviations of PF in the Tichy et al. (1986), Schlager et al. (1990), and Eckels et al. (1994, 1998a) correlations are within –20%~+20%, 0%~+40%, and 0%~+70%, respectively; while the deviations of frictional pressure drop of these correlations are –55%~+30%, –45%~+40%, and –40%~+60%, respectively. None of these kinds of PF correlations can predict the experiment PF and frictional pressure drop of the R-410A/oil mixture satisfactorily, and the predicted PF of these correlations are not the same even for the same refrigerant with different types of oil. The enhancement factor model is not recommended to correlate the experimental data of the refrigerant/oil mixture in the present study. The first reason is that the enhancement factor model cannot reflect the influence of oil on the frictional pressure drop by mechanism. The second reason is that the enhancement factor correlation cannot ensure the accuracy of the frictional pressure drop of the refrigerant/oil mixture. The poor predictability of these correlations to the frictional pressure drop of the R-410A/oil mixture is due to the superimposed error of the PF correlation and the frictional pressure drop correlation of pure R-410A. The second category of correlations is developed in terms of a two-phase multiplier to correct the single-phase pressure drop of the pure refrigerant. Correlations of Barbosa et al. (2004) and Alofs and Hasan (1990) belong to the second kind of correlation. The two-phase multiplier for pressure drop is defined as the ratio of the pressure drop of a two-phase refrigerant/oil mixture to that of a single-phase oil-free refrigerant, presented as Equation 16. Barbosa et al.’s (2004) and Alofs and Hasan’s (1990) correlations are developed based on the vapor frictional pressure drop of pure refrigerant. Nominal oil concentration is introduced into the two-phase multiplier model to address the influence of oil: ΦL =
r, o, frict⎞ ⎛ dP r, L⎞ ⎛ dP ------------------------ ⁄ -------------- or Φ V = ⎝ ⎠ ⎝ dz ⎠ dz
r, o, f ric t⎞ ⎛ dP r, V⎞ ⎛ dP ------------------------ ⁄ -------------⎝ ⎠ ⎝ dz ⎠ dz
(16)
Figure 6 depicts comparisons of the predicted values of these correlations with the experimental data. It shows that the deviations of Barbosa et al.’s (2004) and Alofs and Hasan’s (1990) correlations are within +30%~+90% and –80%~0%, respectively. Neither of these correlations can predict the experimental data of an R-410A/oil mixture satisfactorily. The poor predictability of these correlations is due to the superimposed error of the two-phase pressure drop multiplier correlation and the vapor frictional pressure drop correlation of pure R-410A, and the databank for Barbosa et al.’s (2004) correlation is for small tubes, so it should be modified if it is applied to tubes with larger inside diameters. Different from the first and second correlation categories, the third category is developed based on refrigerant/oil mixture properties. Correlations of Wei et al. (2007) and Zurcher et al. (1998b) belong to the third category and are shown in Equations 17 and 18, respectively. These two correlations owe the influence of oil presence on frictional pressure drop to the changes of viscosity and oil concentration:
772
HVAC&R RESEARCH
Figure 4. Predicted PF of PF correlations vs. experimental PF of an R-410A/oil mixture: (a) Schlager et al. (1990), (b) Eckels et al. (1994), and (c) Tichy et al. (1986).
n
4 n l ocal ⋅ [ x ( 1 – x ) ] x ( 1 – x ) ] 1- + x n3 + a ⋅ ω Φ r2, o, LO = a 1 + a 2 ⋅ 1.0 + a 3 ⋅ [---------------------------4 -----------------------------------------------n5 n2 G G
Φ r2, o, LO = Φ r2, LO [ μ o ⁄ μ r ]
ω lo cal ( a1 ω n o + a 2 )
(17)
(18)
Figure 7 depicts the comparison of the predicted values of these correlations with the experimental data of an R-410A/oil mixture. Figure 7 shows that Wei et al.’s (2007) correlation poorly predicts the experimental data of an R-410A/oil mixture; the deviation of this correlation may be larger than 100% under some experimental conditions. The poor predictability of Wei et al.’s (2007) correlation is a result of their use of a two-phase multiplier model, which cannot match
VOLUME 14, NUMBER 5, SEPTEMBER 2008
773
Figure 5. Predicted frictional pressure drop of PF correlations vs. experimental data of an R-410A/oil mixture: (a) Schlager et al. (1990), (b) Eckels et al. (1994), and (c) Tichy et al. (1986). the requirement of the definition of a two-phase multiplier, i.e., Φ r, o, LO > 0 when 0 < x < 1 and Φ r, o, LO = 1 when x = 0, so Wei et al.’s (2007) correlation may deviate greatly from the experimental data of other refrigerant/oil mixtures, although it can predict their experimental data for the R-22/oil mixture satisfactorily. Figure 7 also shows that the deviation of Zurcher et al.’s (1998b) correlation is within –40%~0%, and it provides better predictions for the experimental data of the R-410A/oil mixture than the first and second kinds of correlation. However, two factors need to be improved. First, it is not enough to credit the influence of oil presence on frictional pressure drop only to viscosity change, because other properties, such as density and surface tension, etc., also effect frictional pressure drop. Second, the databank for Zurcher et al.’s (1998b) model applies to large tubes with an inside diameter of 10.92 mm. Zurcher et al.’s pressure drop model should be modified for small tubes.
774
HVAC&R RESEARCH
Figure 6. Predicted ∆Pr,o,frict of Alofs and Hasan’s (1990) correlation and Borbosa et al.’s (2004) correlation vs. an experimental ∆Pr,o,frict of an R-410A/oil mixture.
Figure 7. Predicted ∆Pr,o,frict of Wei et al.’s (2007) correlation and Zurchur et al.’s (1998b) correlation vs. an experimental ∆Pr,o,frict of an R-410A/oil mixture.
VOLUME 14, NUMBER 5, SEPTEMBER 2008
775
From the evaluation of the prediction ability of state-of-the-art pressure drop correlations of refrigerant/oil mixtures, it can be deduced that none can predict the experimental data of R-410A/oil satisfactorily. It can be also deduced that the third kind of correlation considering refrigerant/oil mixture properties may provide better predictions to the experimental data than the first and second kinds of correlation. Therefore, a new correlation based on properties of refrigerant/oil mixtures as the third kind of correlation is proposed in this study. In order to address the influence of oil presence on frictional pressure drop, the refrigerant/oil mixture properties, including not only viscosity but also the density and surface tension, etc., are used to replace the pure refrigerant properties when developing the new correlation.
Development of a New Pressure Drop Correlation for R-410A/Oil Mixtures The frictional pressure drop of an R-410A/oil mixture is correlated with a frictional two-phase multiplier, Φ V , and frictional pressure drop of vapor component, ΔP V , as follows: ΔP r, o, f ri ct = Φ V2 ΔP V
(19)
In Equation 19, ΔP V is the frictional pressure drop when the vapor component is flowing alone inside the test tube, which is estimated from the following equation: ΔP V = 2LfG 2 x 2r, o ⁄ (ρ r, V d )
(20)
where f is the frictional coefficient of the straight smooth tube; Equation 21 is recommended by Jung and Radermacher (1989) and Chen et al. (2005). f = 0.046 ⁄ Re V0.20
(21)
The frictional two-phase multiplier, Φ V , is the function of the Martinelli parameter, X t t : Φ V = f ( X t t)
(22)
For a refrigerant/oil mixture, the Martinelli parameter, X t t , can be calculated by the following: X t t = ( ( 1 – x r, o ) ⁄ x r, o ) 0.9 ( ρ r, V ⁄ ρ r, o, L ) 0.5 ( μ r, o, L ⁄ μ r, V ) 0.1
(23)
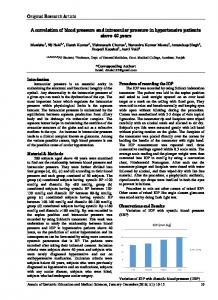
In Equation 23, ρ r, V and μ r, V are vapor-phase density and dynamic viscosity of pure R-410A, respectively; ρ r, o, L and μ r, o, L are liquid-phase density and dynamic viscosity of an R-410A/oil mixture, respectively. The semi-empirical models of oil and refrigerant/oil mixture properties are given in Appendix A. Properties of pure refrigerant are calculated with NIST REFPROP version 6.01 (NIST 1998). The obtained values of Φ V for the R-410A/oil mixture plotted against X t t are shown in Figure 8. From Figure 8, it is found that the measured values of Φ V for R-410A/oil mixtures indicate the same tendency for X t t at all the experimental conditions. The tendency can be expressed as Equation 24, which is similar to the pressure drop correlations of Goto et al. (2001) for oil-free R-410A and Sami and Comeau (2002) for refrigerant mixtures. Φ V = 1 + a ( X t t) n
(24)
776
HVAC&R RESEARCH
Figure 8. ΦV vs. Martinelli parameter for an R-410A/oil mixture.
The resulting coefficients for R-410A/oil mixtures were determined by regression from the equation of the curve presented in Figure 8: Φ V = 1 + 3.52X tt0.46
(25)
The predicted correlation of frictional pressure drop for R-410A/oil mixtures is ΔP r, o, f ri ct = 2fG 2 x 2r, o L ( 1 + 3.52X tt0.46 ) 2 ⁄ ( ρ r, V d ) .
(26)
Therefore, the frictional pressure drops of R-410A/oil mixtures, ΔP r, o, f ri ct , can be calculated by Equations 21, 23, and 26. The contrast of predicted frictional pressure drop with experimental data is shown in Figure 9. As seen in Figure 9, the new correlation agrees with 92% of the experimental data within a deviation of ±15%; the average deviation and maximum deviation are 6.6% and 29.4%, respectively.
CONCLUSIONS Local frictional pressure drops were measured for pure R-410A and an R-410A/oil mixture in a smooth tube. The test results show that the frictional pressure drop of the R-410A/oil mixture increased with the mass flux, the presence of oil enhanced the two-phase frictional pressure drop, and the effect of oil on the frictional pressure drop was found to be more evident at higher vapor qualities where the local oil concentrations were higher. The predictabilities of the state-of-the-art pressure drop correlations of refrigerant/oil with the experimental data of the R-410A/oil mixture were investigated; the results show that none of the correlations can satisfactorily predict the experimental data of the R-410A/oil mixture, and those correlations that consider the effect of oil on mixture properties provide better predictions to the experimental data than other correlations.
VOLUME 14, NUMBER 5, SEPTEMBER 2008
777
Figure 9. Comparison of predicted frictional pressure drop of the new correlation with experimental data of an R-410A/oil mixture.
A new correlation of frictional pressure drop was developed for an R-410A/oil mixture flow boiling inside a smooth tube, based on local properties of the refrigerant/oil mixture, and it agrees with 92% of the experimental data within a deviation of ±15%; the average and maximum deviations are 6.6% and 29.4%, respectively.
ACKNOWLEDGMENTS The authors gratefully acknowledge the supply of the lubricant oil and the oil property data from Nippon Oil Corporation and the supply of R-410A from Honeywell Corporation for this study.
NOMENCLATURE a d f G h L m n P PF
= = = = = = = = = =
coefficient in Equation 24 diameter, m frictional coefficient mass flux, kg/(m 2·s) specific enthalpy, kJ/kg length of test tube, m mass flow rate, kg/h coefficient in Equation 24 pressure, Pa enhancement factor for pressure drop dP r, o , f ric t ⁄ dz = frictional pressure gradient of refrigerant/oil mixture, Pa/m dP r, L ⁄ dz = liquid-phase pressure gradient of refrigerant, Pa/m
dP r, V ⁄ dz
= vapor-phase pressure gradient of refrigerant, Pa/m
ΔP
= pressure drop, Pa
ΔP t ot al
= total pressure drop, Pa
ΔP f ri ct
= two-phase frictional pressure drop, Pa
ΔP m om
= two-phase acceleration pressure drop, Pa
Q
= heat addition, kW
Re
= Reynolds number
T
= temperature, °C
x
= vapor quality based on the mass of refrigerant/oil mixture
Xt t
= Martinelli parameter
778
HVAC&R RESEARCH
Greek Symbols ε ω ρ
= void fraction = oil mass fraction = density, kg/m3
Φ μ σ
= frictional two-phase multiplier = dynamic viscosity, Ns/m2 = surface tension, N/m
= = = = = = =
out
= outlet
pre
= preheater
sat
= saturated
r
= refrigerant
tp
= two-phase
V
= vapor
Subscript eva Ebisu in local L no o
evaporating Ebisu and Torikoshi correlation inlet local liquid nominal oil
REFERENCES Alofs, D.J., and M.M. Hasan. 1990. Influence of oil on pressure drop in refrigerant compressor suction lines. ASHARE Transactions 96(1):249–55. ASHRAE. 2006. ANSI/ASHRAE Standard 41.4-1996 (RA 2006), Standard Method for Measurement of Proportion of Lubricant of Liquid Refrigerant. Atlanta: American Society of Heating, Refrigerating and Air-Conditioning Engineers, Inc. Barbosa, J.R., V.T. Lacersa, and A.T. Prata. 2004. Prediction of pressure drop in refrigerant-lubricant oil flows with high contents of oil and refrigerant outgassing in small diameter tubes. International Journal of Refrigeration 27(2):129–39. Chen, I.Y., C.L. Won, and C.C. Wang. 2005. Influence of oil on R410A two-phase frictional pressure drop in a small U-type wavy tube. International Communications in Heat and Mass Transfer 32(6):797–808. Ebisu, T., and K. Torikoshi. 1998. Heat transfer characteristics and correlations for R410A flowing inside a horizontal smooth tube. ASHRAE Transactions 104 (2):556–61. Eckels, S.J., T.M. Doerr, and M.B. Pate. 1998a. Heat transfer coefficients and pressure drops for R-134a and an ester lubricant mixture in a smooth tube and a micro-fin tube. ASHRAE Transactions 104(1A):366–75. Eckels, S.J., T.M. Doerr, and M.B. Pate. 1998b. A comparison of the heat transfer and pressure drop performance of R134a-lubricant mixtures in different diameter smooth tubes and micro-fin tubes. ASHRAE Transactions 104(1A):376–86. Eckels, S.J., T.M. Doerr, and M.B. Pate. 1994. In-tube heat transfer and pressure drop of R-134a and ester lubricant mixtures in a smooth tube and a micro-fin tube: Part I—Evaporation. ASHRAE Transactions 100(2):265–82. Goto, M., N. Inoue, and N. Ishiwatari. 2001. Condensation and evaporation heat transfer of R410A inside internally grooved horizontal tubes. International Journal of Refrigeration 24(7):628–38. Jassim, E.W., and T.A. Newell. 2006. Prediction of two-phase pressure drop and void fraction in microchannels using probabilistic flow regime mapping. International Journal of Heat and Mass Transfer 49(15-16):2446–457. Jung, D.S., and R. Radermacher. 1989. Prediction of pressure drop during horizontal annular flow boiling of pure and mixed refrigerants. International Journal of Heat and Mass Transfer 32:2435–446. Kim, M.H., and J.S. Shin. 2005. Evaporating heat transfer of R22 and R410A in horizontal smooth and microfin tubes. International Journal of Refrigerant 28(6):940–48. Kim, Y., K. Seo, and J.T. Chung. 2002. Evaporation heat transfer characteristics of R-410A in 7 and 9.52 mm smooth/micro-fin tubes. International Journal of Refrigerant 25(6):716-730.
VOLUME 14, NUMBER 5, SEPTEMBER 2008
779
Lottin, O., P. Guillemet, and J.M. Lebreton. 2003. Effect of synthetic oil in a compression refrigeration system using R410A, Part I: modelling of the whole system and analysis of its response to an increase in the amount of circulating oil. International Journal of Refrigeration 26(7):772–82. Moffat, R.J. 1998. Describing the uncertainties in experimental results. Experiment Thermal Fluid and Science 1(1):3–17. Nidegger, E., J.R. Thome, and D. Favrat. 1997. Flow boiling and pressure drop measurements for R-134a/oil mixtures, Part 1: Evaporation in a microfin tube. HVAC&R Research 3(1):38–53. NIST. 1998. REFPROP, NIST Standard Reference Database 23, Version 6.01. National Institute of Standards and Technology, Gaithersburg, MD. Park, C.Y., and P.S. Hrnjak. 2007. CO2 and R410A flow boiling heat transfer, pressure drop, and flow pattern at low temperatures in a horizontal smooth tube. International Journal of Refrigeration 30(1):166–78. Rouhani, Z., and E. Axelsson. 1970. Calculation of void volume fraction in the subcooled and quality boiling regions. International Journal of Heat and Mass Transfer 13(2):383–93. Sami, S.M., and J.D. Comeau. 2002. Influence of thermophysical properties on two-phase flow convective boiling of refrigerant mixtures. Applied Thermal Engineering 22(14):1535–548. Schlager, L.M., M.B. Pate, and A.E. Bergles. 1989a. A comparison of 150 and 300 SUS oil effects on refrigerant evaporation and condensation in a smooth tube and a micro-fin tube. ASHRAE Transactions 95(1):387–97. Schlager, L.M., M.B. Pate, and A.E. Bergles. 1989b. Heat transfer and pressure drop performance of smooth and internally finned tubes with oil and refrigerant 22 mixtures. ASHRAE Transactions 95(2):160–69. Schlager, L.M., M.B. Pate, and A.E. Bergles. 1990. Performance predictions of refrigerant-oil mixtures in smooth and internally finned tubes—Part II: Design equations. ASHRAE Transactions 96(1):170–82. Shen, B., and E.A. Groll. 2005. A critical review of the influence of lubricants on the heat transfer and pressure drop of refrigerants, Part I: Lubricant influence on pool and flow boiling. HVAC&R Research 11(3):341–59. Steiner, D. VDI-Waermeatlas (VDI Heat Atlas), Verein Deutscher Ingenieure, VDI-Gesellschaft Verfahrenstechnik und Chemieingenieurwesen (GCV), Duesseldorf, 1993, Chapter Hbb. Thome, J.R. 1995. Comprehensive Thermodynamic approach to modeling refrigerant-lubricating oil mixtures. HVAC&R Research 1(2):110–26. Tichy, J.A., J. Duque-Rivera, N.A. Macken, and W.M.B. Duval. 1986. An experimental investigation of pressure drop in forced-convection condensation and evaporation of oil-refrigerant mixtures. ASHRAE Transactions 92:461–72. Wang, C.C., J.G. Yu, S.P. Lin, and D.C. Lu. 1998. An experimental study of convective boiling of refrigerants of R-22 and R-410A. ASHRAE Transactions 19(2):1144–150. Wellsandt, S., and L. Vamling. 2005. Evaporation of R407C and R410A in a horizontal herringbone microfin tube: Heat transfer and pressure drop. International Journal of Refrigeration 28(6):901–11. Wei, W.J., G.L. Ding, H.T. Hu, and K.J. Wang. 2007. Measurement and correlation of two-phase frictional performance of refrigerant-oil mixture inside small tubes. HVAC&R Research 13(2):397–411. Youbi-Idrissi M., J. Bonjour, C. Marvillet, and F. Meunier. 2003. Impact of refrigerant-oil solubility on an evaporator performances working with R-407C. International Journal of Refrigeration 26(3):284–92. Yun, R., J.H. Heo, and Y. Kim. 2006. Evaporative heat transfer and pressure drop of R410A in microchannels. International Journal of Refrigeration 29(1):92–100. Zurcher, O., J.R. Thome, and D. Favrat. 1997. Flow boiling and pressure drop measurements for R-134a/oil mixtures, Part 2: Evaporation in a plain tube. HVAC&R Research 3(1):54–64. Zurcher, O., J.R. Thome, and D. Favrat. 1998a. In-tube flow boiling of R-407C and R-407C/oil mixtures, Part I: Microfin tube. HVAC&R Research 4(4):347–72. Zurcher, O., J.R. Thome, and D. Favrat. 1998b. In-tube flow boiling of R-407C and R-407C/oil mixtures, Part II: Plain tube results and predictions. HVAC&R Research 4(4):373–99.
780
HVAC&R RESEARCH
APPENDIX A—CORRELATIONS TO CALCULATE THERMODYNAMIC PROPERTIES OF A R-410A/RB68EP MIXTURE Table A1. Pure Oil Properties of RB68EP 0.388 + 0.00045 ( 1.8T + 32 ) Cp o = 4.186 -------------------------------------------------------------------- (T, unit: °C) s
Specific Heat, kJ/kg·K Thome (1995) Specific Enthalpy, kJ/kg Lottin et al. (2003)
ho =
(A1)
T 0.4024T + 0.000405T 2 ∫0 Cp o ( T ) dT = 4.186 ------------------------------------------------------- (T, unit: °C) (A2)
s
Thermal Conductivity, W/m2·K Lottin et al. (2003)
λ o, L = 0.1172 ( 1 – 0.0054T ) ⁄ s (T, unit: °C)
(A3)
Density, g/cm3
ρ o = 0.97386 – 6.91473 × 10 – 4 × T (T, unit: °C)
(A4)
Viscosity, mm 2/s
μ o = 1062.075e ( –T ⁄ 32.29 ) + 4.90664 (T, unit: °C)
(A5)
Surface Tension, mN/m
σ o = 29.0 – 0.40T (T, unit: °C)
(A6)
Table A2. Refrigerant/Oil Mixture Properties 2 3 T = – 31.67759 + 1.11798ω local + 0.3107ω local – 0.02045ω local
Miscibility (LLE)
(A7)
5 + 4.4055 × 10 – 4 ω4l ocal – 3.38073 × 10 – 6 ω local
(T, unit: °C) P ( ωl oc al , T ) = ( 1 – ω local )P r, sat ( T ) + ω local ( 1 – ω l ocal )F ( ωl oc al , T )P r, sat ( T ) Solubility (LVE)
F ( ωlocal , T ) = 0.98 + 12.78T + 0.63T 2 + 6.2 ( 1 – ω local )
(A8)
+ 78.37 ( 1 – ω local )T + 0.17 ( 1 – ω local )T 2
(T, unit: °C) Density, g/cm Lottin et al. (2003) Thermal Conductivity, W/m·K Lottin et al. (2003)
ω local 1 – ω l ocal⎞ – 1 ρ r, o, L = ⎛⎝ -------------- + ------------------------⎠ ρ ρ o
(A9)
r, L
λ r, o, L = λ r, L ( 1 – ω l oc al ) + λ o ω l ocal – 0.72ω local ( 1 – ω local ) ( λ o – λ r, L )
(A10)
Specific Enthalpy, kJ/kg Youbi-Idrissi et al. (2003)
h r, o = ωl oc al h o + xh r, V + ( 1 – x – ω no )h r, L
(A11)
Surface Tension, mN/m
0.51 σ r, o, L = σ r + ( σ o – σ r )ωlocal
(A12)
μ r, o, L = e Viscosity, mm 2/s
( f1 + f2 T + f 3 T 2 )
(T, unit: °C)
2 3 f 1 = – 3.48041 + 0.105079ωl oc al – 0.001198ωlocal + 1.16666 × 10 – 5 ωlocal 2 f 2 = – 0.0615841 + 0.00194417ωlocal – 2.02434 × 10 –5 ωlocal
f3 = 1.65821 × 10 – 4 – 6.09776 × 10 – 6 ωlocal × 6.83248 × 10 – 8 ωl2oc al
R-502/150SUS
Alofs and Hasan (1990)
R-22/NM56
R-407C/ POE VG68
Wei et al. (2007)
Zurcher et al. (1998b)
Barbosa et al. R-12/SUNISO (2004) 1GS mineral oil
R-12/300SUS
R-134a/ 150-SUS
R-134a/ 369-SUS
Tichy et al. (1986)
Eckels et al. (1994,1998a)
PF = 1.03 ⋅ exp(5.59ω no ) or PF = 1.02 + 6.68 ⋅ ω no
R-22/300-SUS
R-134a/ 169-SUS
PF = 1.01 ⋅ exp(4.69ω no ) or PF = 1.01 + 5.43 ⋅ ω no
R-22/150-SUS
Schlager et al. (1990)
PF = exp ( 24.41ω no – 14.46ω no G ⁄ 250 + 92.97 ( ω no G ⁄
– 87.90 ( G ⁄
250 ) 2 )
fv
10
V
V
Φ r2, o, LO
n4
2 ) ( Φ Lo ref – oi l = ( Φ Lo )re f [ μ o ⁄ μ r ]
ω loca l ( 3.583ω no + 0.0616 )
n n ω local ⋅ [ x ( 1 – x ) ] [x(1 – x )] 1 = a 1 + a 2 ⋅ 1.0 + a 3 ⋅ ----------------------------- + x 3 ⋅ ----------------------------------------------n n2 G 5 G a 1 = – 46.203, a 2 = 35.533, a 3 = 539.456, a 4 = – 16373.321 n 1 = 0.086 , n 2 = 1.08, n 3 = 0.51, n 4 = 0, n 5 = 0.71
Re V x Φ V2 = 1.24 ----------- ( 1 – ω local ) + 1.95exp ⎛ 6.94 × 10 – 3 ---------⎞ X tt + X t2t ⎝ 1–x Re L⎠
2
dP V ⁄ dz = 2f V G 2 x 2 ⁄ ( ρ r, V d ) 1 - = – 0.8 + 2log ( 2Re f ) -------
Φ V2 = ( 1 + X tt2 ⁄ n ) n n = 1.83 + 3.652tanh ( 1.186 × 10 –5 G V )
ΔP TPE is the pressure drop computed using the Dukler II correlation in Tichy (1986)
2 PF = 1 + 41.3 ⋅ ω no + 479 ⋅ ω no
ΔP f ri ct = ΔP TPE ⋅ PF
2 G ⁄ 250 + 5.61ω ( G ⁄ 250 ) 2 + 478.5 ( ω G ⁄ 250 ) 2 ) PF = exp ( 7.26ω no – 701.4ω no no no
2 ⋅ G ⁄ 250 ) + 504.8 ( ω ⋅ G ⁄ 250 ) 2 PF = 1.00 + 11.33ω no + 9.99ω no ⋅ G ⁄ 250 – 768 ( ω no no
250 ) 2
PF = 1.00 + 26.94ω no – 17.23ω no ⋅ G ⁄ 250 + 81.67 ( ω no ⋅ G ⁄ 250 ) 2
2 G ⁄ 250 – 460.40 ( G ⁄ 250 ) 2 ) PF = exp ( 37.54ω no – 20.86ω no G ⁄ 250 + 296.20 ω no
2 PF = 1.00 + 43.68ω no + 24.01ω no ⋅ G ⁄ 250 + 143.60 ( ω no ⋅ G ⁄ 250 ) 2 – 341.80ω no
Model
Fluid
Author
Based on two-phase multiplier; considering oil properties.
Based on two-phase multiplier; considering oil properties.
Based on two-phase multiplier; for small inside diameter tubes.
Based on two-phase multiplier; without considering oil properties.
Based on enhancement factor; without considering oil properties.
Based on enhancement factor; without considering oil properties.
Based on enhancement factor; without considering oil properties.
Description
Table B1. Pressure Drop Correlations of Refrigerant-Oil Mixture flow Boiling Inside Smooth Tubes
APPENDIX B— PRESSURE DROP CORRELATIONS OF A REFRIGERANT/OIL MIXTURE FLOW BOILING SMOOTH TUBES
VOLUME 14, NUMBER 5, SEPTEMBER 2008 781