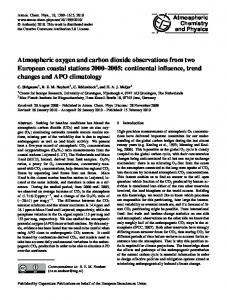
Jul 26, 2002 - Membrane inlet mass spectrometry, Oxygen uptake rate, Respiratory quotient. Abstract. A method for the measurement of oxygen uptake and ...
Cytotechnology 37: 153–162, 2001. 2002 Kluwer Academic Publishers. Printed in the Netherlands.
153
Measurement of oxygen uptake and carbon dioxide production rates of mammalian cells using membrane mass spectrometry 1 2, Ahmet Oezemre and Elmar Heinzle * 1
Chemical Engineering Department, Swiss Federal Institute of Technology, CH-8092 Zurich, Switzerland; Biochemical Engineering, Saarland University, P.O. Box 151150, D-66041 Saarbruecken, Germany; * Author for correspondence (e-mail: e.heinzle@ mx.uni-saarland.de; phone: 149 -681 -302 -2905; fax: 149 681 -302 -4572) 2
Received 5 July 2000; accepted in revised form 18 July 2001
Key words: Carbon dioxide production rate, Hydridoma, Mammalian cell cultivation, Mass spectrometry, Membrane inlet mass spectrometry, Oxygen uptake rate, Respiratory quotient
Abstract A method for the measurement of oxygen uptake and carbon dioxide production rates in mammalian cell cultures using membrane mass spectrometry is described. The small stirred reactor with a volume of 15 ml and integrated pH-control permits the economical application of isotopically labelled substrates and 13 C-labelled bicarbonate buffer. Repetitive experiments showed the reproducibility of the method. In one case bicarbonate-free HEPES buffer was used and carbon dioxide production was measured using the intensity of the peak at m / z 5 44 ( 12 CO 2 ). 12 In all other cases H 13 CO 2 CO 2 was measured. The minimum cell density required 3 -buffer was applied and also 4 21 was only 2 3 10 cells ml . In the hybridoma T-flask cultivation studied here the measured specific oxygen uptake and carbon dioxide production rates were reasonably constant during the exponential growth phase and decreased significantly afterwards. Estimated respiratory quotients were always between 0.90 and 0.92 except in HEPES-buffer, where a value of 0.67 was found. In the latter case specific oxygen uptake rate was higher than in bicarbonate buffered culture, however, carbon dioxide production rate was lower, and viable cell density was lowest. The addition of phenazine methosulfate, an artificial electron acceptor, increased both rates resulting in highest viable cell density but also highest lactate production rate. Glucose and glutamine pulse-feeding increased final cell density. The method described is directly applicable for samples from batch, fed-batch and continuous cultivations.
Nomenclature C Concentration (mol l 21 or M) CPR CO 2 production rate (mol l 21 min 21 ) H Henry coefficient (mol l 21 bar 21 ) KD Dissociation constant for CO 2 (mol l 21 ) OUR Oxygen uptake rate (mol l 21 min 21 ) P Pressure (bar) q CO2 Specific CO 2 production rate (mol cell 21 d 21 ) q O2 Specific oxygen uptake rate (mol cell 21 d 21 ) RQ Respiratory quotient (mol mol 21 ) VC Viable cell number (cells ml 21 ) X Cell number (cells l 21 ) x Molar fraction in the gas phase (-) ICPC - XPS 62398 (CYTO) - product element 380231 - Fri Jul 26 14:23:38 2002
154 Subscripts OL indicates dissolved oxygen Ct indicates total carbonate CL indicates dissolved carbon dioxide
Introduction Monitoring of respiratory activity of mammalian cell cultures provides relevant information about their metabolic state. A series of methods for oxygen uptake rate (OUR) measurement are described in the literature. Philips and McCarthy reported OUR of HeLa cells as early as 1956. Dynamic changes and associate dissolved oxygen measurement were used by Fleischaker and Sinskey (1981). The presently probably most popular method uses quasi-steady-state liquid phase balancing (e.g. Ramirez and Mutharasan (1990), Eyer et al. (1995)). This method is mainly useful for small scale laboratory reactors where oxygen transfer via surface aeration is well defined. Gas phase balancing, the standard method in microbial cultivations, suffers from error amplification because of small differences between inlet and outlet oxygen gas concentrations. One way to overcome these difficulties is the supply of inert gas into the headspace (Eyer et al. 1995) and subsequent mass spectrometric analysis. Carbon dioxide production rate (CPR) is much more difficult to measure mainly because of the large amount of bicarbonate accumulated and because of the influence of pH. Bonarius et al. (1995) have elaborated a method to determine also CPR by detailed gas and liquid phase balancing of the reactor and the medium storage tank. Membrane mass spectrometry (MMS) has been shown useful for measurement of dynamic changes of dissolved gases in anaerobic digestion (Dornseiffer et al. 1995; Meyer and Heinzle 1998). Hybridoma cells are widely used in industry for antibody production. Mammalian cell culture is also important for the production of pharmaceutical proteins, and measurement of OUR and CPR will improve understanding dynamic phenomena in such cultures and will supply data for on-line control (e.g. Ramirez and Mutharasan (1990), Eyer et al. (1995)). The aim of the present paper is to present procedures to obtain OUR, CPR and respiratory quotients (RQ) by using MMS in hybridoma cultures performed under batch or fed batch (pulsed feeding) conditions. A specially designed small reactor with a working volume of 15 ml allows two general ways of CPR
estimation. The first one applies a H 13 CO 2 3 - buffer and feed of naturally labelled substrates. The second one, which was not used in this study uses natural 13 HCO 2 C-labelled substrates. The meth3 - buffer and od presented is directly applicable for samples from batch, fed batch and perfusion cultures.
Materials and methods Cell line and medium composition A murine hybridoma cell line HFN 7.1 (ATCC CRL 1606) that produces an IgG 2A antibody directed against human ferritin was grown in a serum-free low protein medium and was used for both experimental methodologies. A mixture of Dulbecco’s, Ham’s F12 and Iscove’s powered medium (DHI, 1:1:2) (Gibco, Grand Island, NY, USA) was used as the basal medium and was supplemented with 5 mg ml 21 transferrin (Boehringer Mannheim, Mannheim, Germany), and 0.35% (w / v) Synperionic F68 (Serva, Heidelberg, Germany). The medium contained glucose, 5 mM glutamine, and 1% (w / v) Primatone. Batch and fed-batch growth experiments The composition of the medium was modified to study individual effects of compounds. Isotopically labelled substances were purchased from Cambridge Isotope Laboratories (Cambridge, MA, USA). NaHCO 3 free medium was prepared with an addition of 10% (v / v) 1 M sterile HEPES buffer [(4-2-Hydroxyethyl)-1-piperazine, Boehringer, Mannheim, Germany]. NaH 13 CO 3 buffered medium contained 32 mM NaH 13 CO 3 . In glucose controlled experiments pulses of sterile glucose solution with a volume of 2 ml were added daily providing a glucose concentration increase of 5.6 mM. Initial glucose concentration of 6.7 mM was used together with 32 mM of NaH 13 CO 3 buffer. Glutamine controlled growth started with standard medium which contained 32 mM of NaH 13 CO 3 buffer. After reaching complete consumption of initial glutamine, glutamine
155 pulses were made with sterile glutamine solution with a volume of 1 ml to provide a concentration increase of 1 mM glutamine in the culture broth. For cultivation with PMS initial medium contained 32 mM of NaH 13 CO 3 buffer and 2 3 10 26 M phenazine methosulfate (PMS) (Fluka, Buchs, Switzerland). Batch runs, excluding those buffered with HEPES, were carried out in a CO 2 incubator (2% v / v CO 2 ) at 37 8C. The HEPES buffered culture was carried out in a CO 2 free incubator at 37 8C. The cells were cultivated in 225 cm 2 jumbo T-flasks (Costar Ltd, MA, USA) in 250 ml medium with an inoculum concentration of 1.2 3 10 5 cells ml 21 . Analytical methods Total and viable cell numbers were determined in a hemocytometer. For viable cells trypan blue staining was used. Glucose and lactic acid concentrations were determined enzymatically using a YSI Model 2000 analyser (Yellow Springs Instruments, MA, USA). Glutamine and other amino acids were determined by ¨ HPLC (Buntemeyer 1988). Membrane mass spectrometer reactor The reactor system described by Dornseiffer et al. (1995), Meyer and Heinzle (1998) was used for batch cultivation (Figure 1). The stirred reactor of 15 ml volume was made of plexiglas. The removal of gas bubbles was enhanced by a conical top section and by the possibility of evacuation of the whole chamber. The bottom was made of stainless steel allowing temperature control at 37 8C (6 0.5 8C) with circulating thermostated water. The reactor was also equipped with a thermocouple, a pH probe (Ingold, Switzerland), and a mass spectrometer membrane probe made of stainless steel and connected to a quadrupole mass spectrometer (QMG 420, Balzers, FL). A PC was connected via a serial interface and also used for pH control. pH control was achieved with the help of a piston pump (Dosimat 665, Metrohm, Switzerland) by feeding 1 N NaOH. Measurement of respiratory activities For measuring respiratory activities, a cultivation broth sample (V 5 20 ml) was taken from a jumbo T-flask daily and centrifuged for 5 min at 200 rpm to remove the cells from the supernatant. The cells were put back into the T-flask, while the reactor was filled
Figure 1. Stirred reactor for gas-phase free dynamic respiration experiments.
with the cell-free supernatant. The supernatant was sparged with helium (He) to strip the dissolved CO 2 . After reaching a constant low value of dissolved CO 2 under constant pH and temperature (e.g. pH 5 7.2, T 5 37 8C), helium sparging was stopped. Then the reactor was sparged with air. After reaching a dissolved oxygen concentration value (DO) corresponding to 50% air saturation, sparging with air was stopped and the remaining gas bubbles were removed by shortly applying vacuum before starting the experiment. Cells were taken from a T-flask and centrifuged 5 min at 200 rpm mixed with PBS salt solution (Life Technologies, MA, USA) and centrifuged again. Cells were suspended in 2 ml of air saturated supernatant from the first centrifugation. The cell suspension was injected into the reactor to start the experiment. The changes of the dissolved gases with time were measured by MMS while the reactor was closed to the environment. The experiments were performed without addition of antibiotics. The stirring rate was found to be optimal at 150 rpm, which is mild enough not to harm the cells.
156 Estimation of dissolved oxygen and carbon dioxide concentrations Equilibrium concentrations in the gas and the liquid phases are related by Henry’s law C i 5H i Px i
(1) th
where C i is the concentration of the i component (CO 2 and O 2 ) in water, which is assumed to be in equilibrium with the gas phase. H i is the Henry constant (mol l 21 bar 21 ). P is the total pressure of gas and x i is the mole fraction of the i th component in the gas phase. Henry coefficients were calculated following the procedure of Schumpe et al. (1982). The values found were: H CO2 5 2.24 3 10 23 mol l 21 bar 21 and H O2 5 1.87 3 10 23 mol l 21 bar 21 . Calibration for oxygen and carbon dioxide was performed by saturating the medium with a calibration gas (10% carbon dioxide, 64.8% nitrogen, 25.2% oxygen) and keeping pH at a constant level by acid / alkali addition. The sensitivity for 13 CO 2 was assumed identical to that of 12 CO 2 . Data were smoothed by cubic splines of MATLAB which were then differentiated to calculate accumulation rates.
Material balances Because of the absence of a gas phase in the reactor, the depletion rate of oxygen equals the consumption rate dC OL ]]52OUR52q O2 X dt
(2)
C OL denotes the liquid phase oxygen concentration 21 21 [mol l ], OUR is the oxygen uptake rate [mol l 21 min ], q O2 is the specific oxygen uptake rate [mol 21 21 21 cell d ]. X is the cell density (cells ml ). The mass balances for total CO 2 is dC Ct ]]5CPR5q CO2 X dt
(3)
where C Ct is the total concentration of CO 2 [mol l 21 ], CPR is the carbon dioxide production rate [mol l 21 min 21 ] and q CO2 is the specific CO 2 production rate (mol cell 21 mm). The dissolved carbon dioxide can 22 dissociate into HCO 2 3 and CO 3 . The total CO 2 concentration is C Ct 5C CL 1C HCO 23 1C CO 22 3
(4)
At pH 5 7 - 8, can be neglected. The concentration of
the free CO 2 , C CL , is measured by MS. The dissociation constant for CO 2 is, C H 1 C HCO 32 K D 5]]] C CL
(5)
Substituting Equation 5 into the Equation 4 and differentiation at constant pH, where dC H1 5 0, gives K D 1C H 1 dC Ct 5]]]dC CL CH 1
(6)
and with Equation 3 one gets
S
D
dC CL K D ]] ]]11 5CPR dt CH 1
(7)
OUR and CPR were estimated from the smoothed data using Equations 2 and 7. The respiratory quotient, RQ, is calculated as CPR q CO2 RQ5]]5]] OUR q O2
(8)
Results and discussions Measurement sensitivity was checked by measuring OUR and CPR without cells in HEPES buffered, NaHCO 3 -free medium. A typical OUR background 212 212 21 value was OUR 5 0.2 3 10 (6 5 3 10 ) mol l 21 212 min . Background CPR was 10 3 10 (6 80 3 212 21 21 10 ) mol l min . In both cases, but particularly in the case of carbon dioxide the standard deviation was very high relative to the mean background signal but very low compared to signals measured in respiration experiments. For the estimation of the minimum cell number needed to determine OUR and CPR with an error of , 1% we used double standard deviations 212 of OUR and CPR, respectively (10 3 10 and 212 21 21 160 3 10 mol l min ). The estimated minimal rates were then: OUR . 1 3 10 29 mol l 21 min 21 and CPR . 16 3 10 29 mol l 21 min 21 . Assuming specific rates q O2 and q CO2 to be of the same order of magnitude, the estimation of CPR was clearly limiting. Taking a value q CO2 5 1.2 3 10 212 mol cell 21 d 21 , the minimum required cell density was calculated to 4 21 be 2 3 10 cells ml . Figure 2 depicts the changes of O 2 and CO 2 during a respiration experiment. Before starting the experiment, cells were washed with PBS salt solution to eliminate the dissolved CO 2 , but after the washing period, the small amount of CO 2 which accumulated in the cells created a small increase at the beginning of
157 the experiment. The effects of dissolved oxygen (DO) on mammalian cell metabolism has been investigated by many authors (Ozturk and Palsson 1990; Miller et al. 1987). Generally DO ranges between 30%–65% air saturation are accepted to be optimal for cell growth. In this study, DO was set to 50% air saturation at the beginning of the experiment. Data for OUR and CPR evaluation were taken after initial transients (8 to 10 min) until reading 30% of oxygen saturation (30 min). Therefore, to keep the O 2 concentration at optimal levels (e.g. 30%–50%), the interval between 10–30 min was taken into account in this particular experiment to estimate CPR, OUR and RQ (Figure 2). Finally values of CPR and OUR were estimated as the average values of that time interval, CPR 5 2.03 3
10 26 mol l 21 min 21 , OUR 5 2.8 3 10 26 mol l 21 min 21 respectively. The calculated average RQ was 0.72 (6 0.06) and the cell concentration was 2 3 10 6 cells ml 21 in this experiment. An important question is, how repeatable such dynamic measurements are. We have therefore performed experiments where the same cell suspension was exposed to two consecutive dynamic measurements. After depletion of oxygen in the first respiration experiment at 90 min, the culture was re-aerated, and a second experiment was started. The results are depicted in Figure 3 and the estimated average values between 10 and 30 min clearly showed a good agreement between both runs. The differences were well within the estimated standard deviation values: q O2 5
Figure 2. Dynamic experiment with changes of dissolved gas concentrations, C l (upper part) and estimated OUR and CPR (lower part). The period taken for OUR and CPR estimation is indicated by the double arrow. Mean OUR 5 2.8 3 10 26 mol l 21 min 21 (6 0.1 3 10 26 ), mean CPR 5 2.03 3 10 26 mol l 21 min 21 (6 0.2 3 10 26 ), pH 5 7.2 (60.01), cell concentration 2 3 10 6 cells ml 21 . Temperature was 37 8C (60.58). h-dissolved CO 2 , ^-dissolved oxygen.
158 20.5 3 10 212 (61.1 3 10 212 ) mol cell 21 d 21 ; 19.8 3 10 212 (60.6 3 10 212 ) mol cell 21 d 21 ; q CO2 5 14.7 3 10 212 (62.1 3 10 212 ) mol cell 21 d 21 ; 14.1 3 10 212 (61.4 3 10 212 ) mol cell 21 d 21 and RQ 5 0.713 (60.065); 0.713 (60.046). These results also demonstrate that the cells keep their activity during the experimental procedure even for prolonged periods. Dynamic OUR and CPR determinations of batch samples from T-flask cultivation The metabolic activity was followed by monitoring
specific oxygen uptake rate (q O2 ), specific carbon dioxide production rate (q CO2 ), and respiratory quotient (RQ). As pointed out earlier, NaHCO 3 is used to buffer industrial mammalian cell cultures. However, the existence of NaHCO 3 in the system complicates the monitoring of CO 2 produced by the cells. In one experiment cells were grown in NaHCO 3 free HEPES buffered medium. Alternatively cells were grown in medium containing NaH 13 CO 3 as buffer. In this way 13 CO 2 of the buffer did not interfere with metabolically produced 12 CO 2 . Glucose and glutamine controlled batches were also conducted using the same buffer. The artificial electron acceptor PMS was used to study its effect on cell metabolism. Cells were taken daily from T-flasks and were placed in the reactor connected with the membrane mass spectrometer. OUR, CPR and RQ were estimated from the consumption or production of dissolved gases O 2 and CO 2 . Since the cell concentration varied from sample to sample, specific rates q O2 and q CO2 were calculated per unit viabie cell. The characteristics of different batches were compared with NaH 13 CO 3 buffered batch results, which were used as a reference. NaH 13 CO3 buffered batch Cells were grown in NaH 13 CO 3 buffered medium. In Figure 4, the maximum cell density reached was 1.3 3 10 6 cells ml 21 . During the growth phase (day 2 to 5) the mean values for specific rates were: q O2 5 212 212 21 21 17.7 3 10 (6 1.5 3 10 ) mol cell d and 212 212 q CO2 5 16.4 3 10 (6 1.0 3 10 ) mol cell 21 21 d . The related specific RQ was found as RQ 5 0.91 (6 0.03). Final concentrations of glucose and lactate were 13 mM and 24 mM, respectively (data not shown). HEPES buffered batch
Figure 3. Repetitive respiration experiments. Measurements were carried out as described in Figure 2. Only data between 10 and 30 min are depicted. After finishing the first respiration experiment (thick line) at 90 min, the reactor was aerated again and a second experiment started (thin line). Mean values between 10 and 30 min were: q O2 5 20.5 3 10 212 (61.1 3 10 212 ) mol cell 21 d 21 , 19.8 3 10 212 (60.6 3 10 212 ) mol cell 21 d 21 ; q CO2 5 14.7 3 10 212 (62.1 3 10 212 ) mol cell 21 d 21 , 14.1 3 10 212 (61.4 3 10 212 ) mol cell 21 d 21 and RQ 5 0.713 (60.065), 0.713 (60.046).
Cells were cultivated with the addition of (10%) HEPES in NaHCO 3 2free medium. Cells need CO 2 at the beginning of cultivation for DNA synthesis, therefore the lack of CO 2 lowered the metabolism at the beginning of the cultivation. Cultivation was started with a cell density of 1.2 3 10 5 cells ml 21 . After reaching the end of exponential growth phase, cell density increased up to 8.8 3 10 5 cells ml 21 (Figure 5). q O2 and q CO2 were nearly constant until the end of the growth phase (4 th day of batch cultivation). After the end of exponential phase of growth, a sudden
159
Figure 4. NaH 13 CO 3 buffered batch culture growth curve. Viable cells, VC, and RQ (upper part), q O2 and q CO2 (lower part). Mean 212 values for days 2 to 5 of cultivation were: q O2 5 17.7 3 10 (6 212 21 21 212 1.5 3 10 ) mol cell d , q CO2 5 16.4 3 10 (6 1.0 3 10 212 ) mol cell 21 d 21 , RQ 5 0.91 (6 0.03).
decrease of the respiration rate was observed. Average values of q O2 and q CO2 for the exponential phase of batch growth (days 1 to 4) were q O2 5 22.5 3 212 212 21 21 10 (6 2.2 3 10 ) mol cell d , q CO2 5 211 212 21 21 15.1 3 10 (6 1.1 3 10 ) mol cell d , respectively. The specific RQ was 0.67 (6 0.03). The 13 decrease compared to NaH CO 3 batch can be explained by the absence of NaHCO 3 in the medium. Cell growth efficiency may be dependent on the pyruvate carboxylase reaction which relies on the availability of CO 2 . The final concentrations of glucose and lactate were 13 mM and 16 mM respectively (data not shown).
Glucose pulsed fed-batch-cultivation Initial glucose concentration was only 6.7 mM. Daily glucose pulses with 2 ml concentrated sterile glucose solution (0.3 M) were made resulting in a concentration increase of 5.6 mM. Cells were used for
Figure 5. HEPES buffered batch culture growth curve.Viable cells, VC, and RQ (upper part), q O2 and q CO2 (lower part). Mean values for the days 1 to 4 of cultivation were: q O2 5 22.5 3 10 212 (6 2.2 3 10 212 ) mol cell 21 d 21 , q CO2 5 15.1 3 10 211 (6 1.1 3 10 212 ) mol cell 21 d 21 , RQ 5 0.67 (6 0.03).
dynamic measurement of OUR and CPR 24 hours after each pulse, when almost all glucose was consumed by the cells. The concentration of viable cells is shown in Figure 6. The maximum cell density was 1.8 3 10 6 cells ml 21 which corresponds to about 35% increase in population compared to NaH 13 CO 3 -buffered batch culture. Mean specific rates were: q O2 5 17.5 3 10 212 (6 1.2 3 10 212 ) mol cell 21 d 21 , q CO2 212 212 21 21 5 16.0 3 10 (6 1.1 3 10 ) mol cell d , and RQ was 0.92 (6 0.04).
Glutamine controlled batch Glutamine is metabolised as an energy source in the cultured mammalian cells to produce ATP by the TCA cycle (Reitzer et al. 1979; Schumpe et al. 1982). Lactate is mainly derived from glucose and only partly from glutamine (Reitzer et al. 1979; Zielke et al. 1984). At high concentration of glutamine the formation of ammonia is increased. 2 ml of a concentrated, sterile glutamine solution was fed daily after
160
Figure 6. Glucose pulsed batch culture growth curve. Viable cells, VC, and RQ (upper part), q O2 and q CO2 (middle part). Glucose and L-lactate concentrations (lower part). Mean values for the first 5 days of cultivation were q O2 5 17.5 3 10 212 (6 1.2 3 10 212 ) mol cell 21 d 21 , q CO2 5 16.0 3 10 212 (6 1.1 3 10 212 ) mol cell 21 d 21 , RQ 5 0.92 (6 0.04). Pulses were applied at points of sharp concentration increases of glucose. Samples for OUR and CPR measurements were taken before supplying a pulse.
glutamine was consumed (on the 5 th day of batch culture). The concentration of viable cells is shown in Figure 7 with a maximum cell density of 1.65 3 10 6 cells ml 21 . Mean values for day 2 to 6 of batch cultivation were: q O2 5 18.7 3 10 212 (60.5 3 10 212 ) mol cell 21 d 21 , q CO2 5 17.1 3 10 212 (6 0.7 3 212 21 21 10 ) mol cell d , and RQ 5 0.91 (6 0.03). Batch culture with PMS Phenazine methosulfate (PMS) is an artificial electron
Figure 7. Glutamine pulsed batch culture growth. Pulses were applied on days 5, 6 and 7 as indicated by the arrows. At each glutamine pulse the glutamine concentration in the reactor increased by 1 mM. Viable cells, VC, and RQ (upper part), q O2 and q CO2 (middle part), glucose and L-lactate concentrations (lower part). Mean values for day 2 to 6 of batch cultivation are: q O2 5 18.7 3 10 212 (60.5 3 10 212 ) mol cell 21 d 21 , q CO2 5 17.1 3 10 212 (6 0.7 3 10 212 ) mol cell 21 d 21 . RQ 5 0.91, (6 0.03).
acceptor, which has the ability of affecting chemical re-oxidation of NADPH, produced in the pentose phosphate cycle, in lipogenes and possibly in the pathway of glutamate metabolism. 1 ml of a 2 3 10 26 M solution of PMS was added to a conventional batch 6 culture. The maximum cell density was 2 3 10 cells 21 ml which means an about 35% increase of population compared to conventional batch cultivation (Figure 8). During the first four days of cultivation mean values were: q O2 5 26.4 3 10 212 (63.4 3 10 212 ) mol
161 cell 21 d 21 , q CO2 5 23.6 3 10 212 (6 3.1 3 10 212 ) mol cell 21 d 21 and RQ 5 0.90 (6 0.05). There was an increase observed in q O2 and q CO2 from day 3 to day 4. Glucose was almost totally consumed until the end of the batch culture. On the other hand, lactate production was higher than in conventional batch cultivation indicating that lactate was not inhibitory in this experiment. This situation can occur due to stimulation of the pentose-phosphate pathway (Hothersall et al. 1979).
Figure 8. Batch culture with addition of PMS.Viable cells,VC, and RQ (upper part), q O2 and q CO2 (middle part), glucose and L-lactate concentrations (lower part). Mean values for the first 4 days of batch cultivation were: q O2 5 26.4 3 10 212 (63.4 3 10 212 ) mol cell 21 d 21 , q CO2 5 23.6 3 10 212 (6 3.1 3 10 212 ) mol cell 21 d 21 . RQ 5 0.90 (6 0.05).
Concluding discussion A new dynamic method was used to study the effects of environmental factors on mammalian cell activity. The dynamics of dissolved oxygen and carbon dioxide were monitored using a membrane inlet mass spectrometer. The estimation of carbon dioxide production took into account its dissociation to bicarbonate. The system used here allows the estimation of total carbonate by careful control of pH and measurement of carbon dioxide. It is however limited to pH values of 8 and below because of the low free CO 2 concentration at higher pH values. Careful harvesting and washing of cells keeps them active even for repetitive dynamic experiments. In a NaH 13 CO 3 -buffer system, 12 CO 2 produced by the metabolism was monitored without having any disturbance from the bicarbonate buffer. The highest q O2 and q CO2 values were observed in batch cultivation with PMS. On the other hand, lactate production rate was also very high in this experiment. Cells grown in HEPES buffered medium showed a drastically reduced RQ value and low lactate production compared to the bicarbonate buffered culture. In glucose pulsed batch culture RQ was slightly increased, compared with the reference batch culture. In glutamine pulsed culture lactate formation was higher. PMS culture showed highest final cell density and highest specific respiration rates during the exponential phase. The resulting specific rates are quite comparable with those obtained during batch cultivation in a stirred tank reactor but with a different nutrient medium (Eyer and Heinzle 1995). q O2 values measured here are generally higher by about 70%. This can be explained by a higher fraction of oxidative metabolism using glutamine as carbon source. Mean RQ values in the growth phase were very constant between 0.90–0.94 except for the HEPES buffered batch, where the value was only 0.67. The relatively low production of CO 2 in the HEPES buffered batch might be caused by the low metabolic activities caused by initial lack of CO 2 . The small volume of the reactor together with low cell density requirement (. 2 3 10 4 cells ml 21 ) is useful to measure the respiration rates and the respiratory quotient of all kinds of samples from T-flasks as well as from larger scale cultivations. Furthermore, it can be used for the dynamic metabolic flux monitoring together with isotopically enriched carbon sources (Heinzle et al. 1998). Normally the measured CO 2 represents the total CO 2 production, hence it is not possible to distinguish which part of the CO 2 comes from which carbon source (e.g. glutamine or
162 glucose metabolism). For that reason, experiments can be carried out using isotopic substrates (e.g. L-[U13 C]-glutamine and / or U- 13 C-glucose) in order to get more direct information about metabolic fluxes. Consequently, this would provide more valuable on-line information for control and optimisation of by-products and antibody production.
Acknowledgements We thank Christoph Wittmann for reading the manuscript and preparing some of the figures. We thank Susan Lochow for typing the manuscript.
References Bonarius H.P.J., de Gooijer C.D., Tramper H. and Schmid G. 1995. Determination of the respiration quotient in mammalian cell culture in biocarbonate buffered media. Biotechnol. Bioeng. 45: 524–535. ¨ Buntemeyer H. 1988. Entwicklung eines Perfusionssystemes zur Kontinuierlichen Kultivierung Tierischer Zellen in Suspension, ¨ Hannover. Dissertation Universitat Dornseiffer P., Meyer B. and Heinzle E. 1995. Modeling of anaerobic formate kinetics in mixed biofilm culture using dynamic membrane mass spectrometric measurement, Biotechnol. Bioeng. 45: 219–228. Eyer K. and Heinzle E. 1995. On-line estimation of viable cells in a hybridoma culture at various DO levels using ATP balancing and redox potential measurement. Biotechnol. Bioeng. 49: 277–283. Eyer K., Oeggerli A. and Heinzle E. 1995. On-line gas analysis in animal cell cultivation: II. Methods of oxygen uptake rate estimation and its application to controlled feeding of glutamine. Biotechnol. Bioeng. 45: 54–62. Fleischaker R.J. and Sinskey A.J. 1981. Oxygen demand and
supply in cell culture. Eur. J. Appl. Microbiol. Biotechnol. 12: 193–197. Heinzle E., Meyer B., Oezemre A. and Dunn I.J. 1998. A Microreactor with On-line Mass Spectrometry for the Investigation of Biological Kinetics. In: Ehrfeld W. (ed.), Microreaction Technology. Springer, Berlin, pp. 267–274. Hothersall J.S., Baquer N., Greenbaum A.L. and McLean P. 1979. Alternative pathways of glucose utilization in brain. Changes in the pattern of glucose utilization in brain during development and the effect of phenanzine methosulfate on the integration of metabolic routes. Arch. Biochem. Biophys. 198: 478–492. Meyer B. and Heinzle E. 1998. Dynamic determination of anaerobic acetate kinetics using membrane mass spectrometry. Biotechnol. Bioeng. 57: 127–135. Miller W.M., Blanch H.W. and Wilke C.R. 1987. The effects of dissolved oxygen concentration on hybridoma growth and metabolism in continuous culture. J. Cell Physiol. 132: 1524–1530. Ozturk S.S. and Palsson B.O. 1990. Effects of Dissolved Oxygen on Hybridoma Cell Growth, Metabolism, and Antibody Production Kinetics in Continuous Culture. Bioprocess Eng. 6: 437– 446. Omasa T., Ishimoto M., Higashiyama K., Shioya S. and Suga K. 1992. The enhancement of specific antibody production rate in glucose- and glutamine-controlled fed-batch culture. Cytotechnology 8: 75–84. Philips H.J. and McCarthy H.L. 1956. Oxygen uptake and lactate formation of HeLa cells. P.S.E.B.M. 93: 573–576. Ramirez O.T. and Mutharasan R. 1990. Cell cycle- and growth phase-dependent variations in size distribution, antibody productivity, and oxygen demand in hybridoma cultures. Biotechnol. Bioeng. 36: 839–848. Reitzer L.J., Wice B.M. and Kennel D. 1979. Evidence that glutamine not sugar, is the major energy source for cultured HeLa cells. J. Biol. Chem. 254: 2669–2674. Schumpe A., Quicker G. and Deckwer W.F. 1982. Gas solubilities in microbial culture media. Adv. Biochem. 24: 1–38. Zielke H.R., Zielke C.L. and Ozand P.T. 1984. Glutamine: a major energy source for cultured mammalian cells. Fed. Proc. 43: 121–125.