An isentropic compression technique (ICE) has been developed at ... from eight shots on Z, spanning initial temperatures from ambient to melt. ..... 5.80. 5.11. 4.60. 4.63. 4.93. 9.52. 8.45. 7.88. 6.88. 8.36. 4.73. 6.68. 5.80. 4.42. 6.18. T(K). 381.
CP955, Shock Compression of Condensed Matter - 2007, edited by M. Elert, M. D. Furnish, R. Cliau, N. Holmes, and J. Nguyen O 2007 American Institute of Pliysics 978-0-7354-0469-4/07/$23.00
MEASUREMENT OF THE DYNAMIC fi-y PHASE BOUNDARY IN TIN Jean-Paul Davis and Dennis B. Hayes Sandia National Laboratories, Albuquerque, NM 87185-1181
Abstract: Experiments performed on the Z machine at Sandia Labs used magnetically generated planar ramp waves to quasi-isentropically compress pre-heated solid tin across the equilibrium p-y phase boundary. Velocity history measurements at a tin/window interface exhibited features that could be consistently related, through simulations, to the p-y structural transformation occurring in the bulk tin. The simulations used a homogeneous phase-mixture model with a y-phase energy offset that was adjusted to match the measured velocity feature. This determined the phase-boundary pressure from experiment and the phase-boundary temperature from the ;6-phase equation of state. Due to wave interactions, measurements using sapphire windows were more difficult to interpret than those using LiF windows and thus led to results with larger uncertainty. Results did not display the hysteretic overshoot seen in static and shock experiments on other phase-transforming materials. Keywords: phase transition, phase boundary, isentropic compression, tin PACS: 61.66.Bi, 62.50.+p, 64.60.-i, 64.70.-p, 64.70.Kb
The p-y phase boundary in tin (Sn) has a very steep dP/dT and occurs in easily accessible ranges of temperature and pressure. The crystal structure transitions with increasing pressure from 2-lattice body-centered tetragonal (bet) in the ;6-phase to regular bet in the y-phase. The p-y volume change of 3-5% is large enough to be easily detectable by time-resolved velocity measurements.
INTRODUCTION An isentropic compression technique (ICE) has been developed at Sandia Labs using fast pulsed power on the Z accelerator to provide ramped, planar, magnetic pressure loading of material samples over durations of several hundred nanoseconds [1]. Evolution of a ramped compression wave propagating through a material is sensitive to the derivative of the material's stress-strain response. The method is useful for studying structural phase transitions under dynamic compression, due to the rapid changes in wave speed upon entering or exiting a mixed-phase region. Phase boundaries can be measured for compression to peak pressures where shock loading would overdrive the transition. Dynamic phase boundaries can be mapped by preheating samples to different initial temperatures.
EXPERIMENTS The present data come from eight shots on Z, spanning initial temperatures from ambient to melt. Most of the pre-heated experiments used an apparatus similar to that described in [2] for liquid-tin experiments. Resistive heaters transferred heat either directly to the outer annulus of 12-mm di-
Sandia is a multi-program laboratory operated by Sandia Corporation, a Lockheed Martin Company, for the United States Department of Energy under Contract DE-AC04-94AL85000.
159
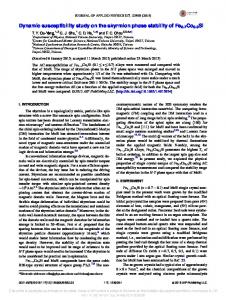
considered, which include fine-grain (40-50 |im) and course-grain (300-1000 |im) polycrystalline tin, single-crystal tin, and resolidified samples from liquid-tin experiments where a heater failed (these had non-uniform texture). Confidence in initial temperature To is ±5 K except where noted. Two of the measured velocity profiles are presented in Fig. 3. A ramp wave propagating through tin develops a kink at the phase boundary due to a sudden decrease in wave speed at the mixed-phase region. Wave interactions map this kink onto the interface velocity history, evident on both profiles in Fig. 3 about halfway to peak velocity. For a sapphire window, which has higher acoustic impedance than tin, interface pressure can cross the phase boundary prior to arrival of the kink feature from the bulk tin, complicating the wave interactions and making interpretation more difficult. Z1541WB exhibits an unusually strong precursor, about 1.2 GPa in the tin. Seen in many of the single-crystal and resolidified tin data, this unexplained phenomenon may arise from localized gaps in bond layers due to thermal distortions. Another technical problem encountered was sample and bond thickness uncertainty due to deformation of the tin during assembly. These and other issues did not affect analysis, which relies solely on the velocity level of the kink in the measured profile.
drive "insulator" AI2O3, 2.0mm (Z1007, Z1541 only) VISAR windows LiF or AI2O3
sample insulator AI2O3, 2.0mm (except Z737, Z903, Z964)
FIGURE 1. Schematic of the experimental configuration. The insulator layers exist only for certain shots as indicated; when not used, the two adjacent layers are bonded directly together. AI2O3 refers to z-cut sapphire.
0.5
0.7 time {[is)
FIGURE 2. Example drive measurement from shot Z964; measured window-interface velocity history on right, effective stress loading history computed by backward integration on left.
ANALYSIS Simulations of the experiments used a homogeneous mixture model for tin based on assumptions introduced by Horie and Duvall [4], with a numerical method developed by Andrews [5], extended to JV phases by Hayes [6], and implemented in the WONDY code [7]. Each phase has its own equation of state (EOS), and the mixture's extensive properties are mass-averaged over all phases. Each EOS used a Birch isotherm with constant cv and r/v, with parameters and reference states from the work of Mabire and Hereil [8]. We characterize the position of the fl-y phase boundary using the yphase reference energy ii^.™/, nominally 93.4 kJ/kg for Py.„f = 9.4 GPa and Ty.„f = 300 K (E/i.„f = 0 kJ/kg). The model includes a one-parameter kinetics law, but this was set close to equilibrium. Strength was neglected. Other materials in the
ameter tin samples mounted on sapphire insulator discs, or to the anode drive panel on which 6-mm diameter tin samples were mounted directly. To measure temperature, fine-gauge thermocouples were bonded either into grooves in the insulator, or to the anode panel itself if there was no insulator. Fig. 1 shows the experimental configuration for velocity interferometry (VISAR) of both a tin sample and a separate sample-less location on the same anode. The latter allows estimation of the effective pressure history at the anode's drive side by integrating the equations of motion backward in Lagrangian coordinate from the measurement position [3] (see Fig. 2). This pressure history can drive forward simulations that obviate magneto-hydrodynamics considerations. Table 1 lists each sample
160
0 100 200 300 Lagrangian distance from drive boundary of tin ().im)
time (|xs) FIGURE 3. Window interface velocity measurements (black) from Z964E (LiF window) and Z1541WB (sapphire window); simulated velocity profiles with adjusted Ej-ref (gray). Dotted lines indicate kinks in measured velocity, vertical bars show uncertainty in matching kink.
500
simulations (Al, Cu, Sapphire, LiF) used a MieGruneisen EOS with linear Us-Up Hugoniots and no account taken of elevated temperature nor strength. Each measurement was simulated using its effective drive pressure history and the nominal value of Ey.„f. The resulting simulated interface velocity history exhibits a plateau feature due to the phase transition occurring in the bulk tin. If the velocity level of this plateau did not match that of the phasetransition kink in the experimental data, further simulations were performed with different values of Ey.„f until it did match. Examples of adjusted-ii^.^/ simulations are shown in Fig. 3. The procedure is somewhat subjective, thus uncertainties were determined by considering the range of possible interpretations, and could be large for data with more than one kink (Z1541WB in Fig. 3) or no distinct kink. The experimental data generally do not exhibit a flat plateau region, probably due to metastability or kinetics effects. Only the velocity level need match; wave arrival time is unimportant. Once the kink was matched by adjusting Ey.„f, pressure and temperature on the phase boundary were extracted from the simulation by inspection of spatial distributions through the sample thickness taken at an appropriate time when the transition occurs near the drive side of the sample, as shown in Fig. 4. Pressure and temperature were read at the Lagrangian position where y-phase mass fraction deviates from 0. In effect, this procedure obtains the phase-boundary pressure from the experimental measurement of a velocity kink at the interface.
0
50 100 150 200 250 300 Lagrangian distance from drive boundary of tin ().im)
FIGURE 4. Snapshot of spatial distribution of (a) yphase mass fraction and pressure, and (b) temperature from adjusted-iij.re/ simulation for Z964E, showing determination of phase-boundary pressure and temperature. using the tin EOS to account for wave interactions. The corresponding phase-boundary temperature then comes directly from the ;6-phase EOS.
RESULTS Pressure and temperature on the p-y phase boundary, determined as above for the 18 samples in Table 1, are plotted in Fig. 5 using filled and open circles according to window material. Short lines through each datum indicate uncertainty due to difficulties of interpretation. Uncertainty perpendicular to these lines is due to uncertainties in the initial temperature (quite small in most cases) and the rise in temperature of ;6-phase material along an isentrope (assumed to be well known). The present model equilibrium phase boundaries, static compression data [9,10], and data from shock/release experiments [8] are shown for comparison. Much
161
needed to determine the effects of metastability and kinetics on interpretation of kinks in the measured velocity profiles for LiF and sapphire windows.
present model LiF window Sapphire window
500
REFERENCES
i
• • • • •
400
Declier Cannon (Barnett) Cannon RT Mabire shocli Mabire release from 17.9 GPa
0
5
1. 2.
Hall, C. A. et al. Rev. Set Instrum. 72, 3587 (2001). Davis, J.-P. and Foiles, S., Experimental and Computational Study of the Liquid-Solid Transition in Tin, Sandia National Laboratories Report SAND2005-6522, October 2005. 3. Hayes, D. B. et al, JAppl Phys. 94, 2331 (2003). 4. Horie, Y. and Duvall, G. E., Behavior of Dense Media under High Dynamic Pressure, lUTAM Symposium on High Dynamic Pressure, Gordon and Breach, New York, 1968, p. 355. 5. Andrews, D. J., J. Comp. Phys 7, 310 (1971). 6. Hayes, D. B., J Appl Phys 46, 3438 (1975). 7. Kipp, M. E. and Lawrence, R. J., WONDY V- A One-Dimensional Finite-Difference Wave Propagation Code, Sandia National Laboratories Report SAND81-0930, June 1982. 8. Mabire, C. and Hereil, P. L., J. Physique IV 10, Pr9/749 (2000). 9. Decker, D. L., Jorgensen, J. D., and Young, R. W., High Temp.-HighPres 7, 331 (1975). 10. Cannon, J. F., J. Phys. Chem. Ref Data 3, 781 (1974); Barnett, J. D., Bennion, R. B. and Hall, H. J., Science, 141, 1041(1963).
/-solid 10
15
pressure (GPa) FIGURE 5. Phase diagram for tin: present model phase boundaries ( ), static data [9,10] (A, •, ), shock and release data [8] (a, ), and present results (• for experiments with a LiF window, o for experiments with a Sapphire window) with uncertainty ranges. of the data fall close to the equilibrium phase boundary with considerably less hysteretic overshoot than seen under shock loading. The six cases falling furthest from the model phase boundary all used sapphire windows. Two of these were resolidified samples with large uncertainty in initial temperature, and could show better agreement if the actual temperature was much lower. Other data may suffer from as-yet unidentified experimental difficulties. Further work is
TABLE 1. Experimental details and nominal results, grouped by window material and sorted in order of increasing temperature; AI2O3 = z-cut sapphire, PC = polycrystalline, SC = single-crystal. Fine-grain tin samples were provided by G. T. Gray of Los Alamos National Laboratory. Parentheses indicate lack of precise measurement, and thus large uncertainty. Experiment Z737N Z1285WB Z1366WT Z964E Z1541ET Z1541EB Z1366SB Z1366ST Z1285EB Z903ET2 Z1366EB Z1080ET Z1285NT Z1541WB Z1007SB Z1366NT Z1541NB Z1541SB
Anode Insulator Tin Sample 809 nm Al 302 nm PC-fine — 1212 umAl 2005 nm AI2O3 505nmSC 1006 nm Al 2004 nm AI2O3 3 5 4 n m S C < 1 0 0 > 611 umAl 333 Jim PC-course — 754 nm Cu (2000 nm) AI2O3 361 nmSC 759 nm Cu (2000 nm) AI2O3 540nmSC 1013 umAl 2019nmAl2O3 502nmSC 1006 umAl 2004 nm AI2O3 504nmSC 1211 umAl 2004 nm AI2O3 4 9 6 n m S C < 1 0 0 > 615 umAl 345 Jim PC-course — 1013 umAl 1999nmAl203 504nmSC 613 Jim Cu 2002 nm AI2O3 810nmSC 1212 umAl 1998nmAl203 3 5 3 n m S C < 1 0 0 > 760 nm Cu (2000 nm) AI2O3 514nmSC 810 umAl 2189nmAl203 696 Jim resolidified 1011 umAl 2011 nmAl203 501 nmSC 747 nm Cu 1869nmAl203 508 Jim resolidified 756 Jim Cu 1879nmAl203 509 Jim resolidified
162
Window To(K) LiF 300 LiF 330 LiF 340 LiF 410 LiF 455 LiF 463 LiF 480 LiF 492 320 AI2O3 (325) AI2O3 339 AI2O3 375 AI2O3 377 AI2O3 467 AI2O3 (485) AI2O3 490 AI2O3 (495) AI2O3 (500) AI2O3
£•,.„;-(kJ/kg) 94.5 95.3 94.5 94.0 95.0 94.0 95.0 96.7 100.0 97.0 96.0 95.0 100.0 94.5 102.0 99.5 95.5 101.5
/'((.I'iO T(K) 8.29 381 7.88 414 7.50 423 5.80 492 5.11 541 4.60 544 4.63 560 4.93 579 9.52 414 8.45 419 7.88 426 6.88 461 8.36 478 4.73 547 6.68 597 5.80 590 4.42 576 6.18 609