FH Pforzheim - University of Applied Sciences, Tiefenbronner Str. 65, ... phone: +49 7231 28 6061, fax: +49 7231 28 6060, e-mail: mohr8fh-pforzheim.de.
WE4-1 / 83
Measurement of the Maximum Speed of PMD Fluctuation in Installed Field Fiber H. Bulow’, W. Baumert’,
H.Schmuck’,
F. Moh?, T. Schulz2, F. Kuppers3,W. Weiershausen3 1)
Alcatel Corporate Research Center, Holderaeckerstr. 35, 0-70499 Stuttgart, Germany, phone: +49 711 821 32282, fax: +49 711 821 32457, e-mail: hbuelowQrcs.sel.de
2) FH Pforzheim - University of Applied Sciences, Tiefenbronner Str. 65, D-75175 Pforzheim, Germany, phone: +49 7231 28 6061, fax: +49 7231 28 6060, e-mail: mohr8fh-pforzheim.de 3)
Deutsche Telekom, Technology Center, Am Kavalleriesand 3, D-64295 Darmstadt, Germany, phone: +49 615183 5688, fax: 4 9 6151 867476, e-mail: kueppersQtzd.telekom.de
In optical transmission systems with single channel bitrates of 10 Gbit/s and beyond the polarization mode dispersion (PMD) of the fiber may become visible as fluctuating signal distortion which may lead to high BER periods (outage). However, first concepts for PMD equalizers have already been proposed and analyzed [1,2] which adaptively track and compensate the signal distortion. In general, the PMD fluctuation driven by environmental temperature changes generates distortion fluctuation in the time scale of a few hours [3,4]. Up to now little is known about the maximum speed of PMD changes or the existence of PMD transients caused, for instance, by acoustic fiber vibration or mechanical motion. Neveflheless, even though these fast events may occur with a low probability, the speed strongly influences the design of PMD compensating units. Not only the equalizer adaptation logic need to be fast enough to track the distortion variation, but also an adequate technology for compensator components, like polarization controller or variable optical delay line, need to be chosen. In order to assess the requirements for PMD equalizers a PMD transient recorder was realized which allows to measure fast changes of PMD. Since conventional setups performing wavelength resolved PMD measurement (Jones-MatrixEigenanalysis) are limited in the time resolution to a few seconds, a “PMD transient recorder” was built which continuously observes the PMD induced distortion of a test signal with a bandwidth of up to 1 MHz and which stores transient events for further analysis. This setup is shown in Fig. 1. The test signal is generated by modulating a cw laser diode (1532.4 nm) using a lithiumniobate Mach-Zehnder modulator (MZI) driven by a 30 GHz rf oscillator. As it is illustrated by the spectrum shown in the upper left inset, the two dominating optical sidebands appearing at modulator output are separated by about 0.5 nm (AV = 60 GHz) [5]. They are amplified by a booster EDFA with 10 dBm output power before being launched as
Fiber
t I
with PMD
Fig. 1 PMD transient recorder setup. Left hand inset shows optical spectrum.
84 / WE4-2
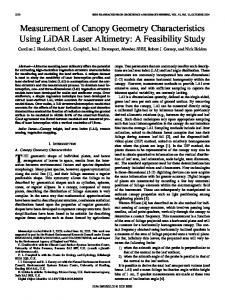
Fig. 2 State of polarization (SOP) of test signal at input and output of fiber with PMD.
Fiber with PMD
Left: input spectrum Right: output spectrum
test signal into the transmission fiber. At the receiver side the optical signal is preamplified by an EDFA and detected by a 60 GHz bandwidth photo diode. The envelope of the 60 GHz beat frequency appearing at the output of the photo diode is detected by a microwave detector with more than 2 MHz bandwidth. As shown by the input spectrum of Fig. 2, the states of polarization (SOP) of the two received optical carriers launched with identical input SOP are, in general, not identical any more due to PMD at fiber output. This is illlustrated by the different angles of rotation of the optical field vectors El and E2 of the output spectrum in Fig. 2. The microwave detector voltage U of the 60 GHz beat frequency is a function of the scalar product of the field vectors [5]:
U
0~
l,!?:21.
A temporal fluctuation of the fiber PMD, either a
fluctuation of the input principal state of polarization (PSP) or a fluctuation of the differential group delay and thus gives rise to a (DGD) AT leads to a variation of the SOP of El with respect to the SOP of variation of the 60 GHz amplitude U. Changes of U are detected by a trigger unit which initiates monitoring of U for 0.5 s by an oscilloscope with a sampling rate of 2 MHz. Finally the trace is stored in a PC (laptop). The advantage of this measurement principle is not only the high bandwidth of 1 MHz, but also it’s insensitivity to polarization variation. Therefore, only distortions are monitored which electronic PMD equalizers have to cope with [2]. However, since the envelope voltage U vanishes when input PSP of the fiber and source SOP are identical, fibers should be observed for a longer period to ensure that the statistics of PMD fluctuation covers all possible PSP’s and hence the probability of low sensitive measurements is reduced.
Fig. 3
0.06 0.05
Typical trace of detector voltage U recorded during a time span of 0.5 s. Fluctuationis induced by a PMD variation.
0.04
> 0.03 \
0.02
3
0.01
0 -0.01
-0.02
-0.03 -0.04
t/s
WE4-3 / 85
For first measurements at installed field fiber a loop of 52 km length deployed in a buried cable was selected due to a comparatively high mean PMD of (AT) = 6.3 ps. The loop is running from Deutsche Telekom Technology Center in Darmstadt to Bensheim and back and it constitutes a section of the European ACTS/Highway project field fiber testbed. During 36 h observation time more than 97 events have been monitored and stored. A typical recorded 0.5 s trace is shown in Fig. 3. We assume that such variation is due to moving of the link fiber (pigtails) in lab or central office. In order to analyze the speed of PMD induced voltage variation, we define as significant variation a voltage swing AU of 50 percent of the maximum amplitude Up of a monitored trace ( A b 0.5Up). In Fig. 3 such a significant variation occurs within a time span of At = 20 ms. Then we went through all 96 monitored traces and extracted the time span At of significant variation events. All these events have been classified according to the frequency of occurrence of the time span At and are shown in Fig. 4. According to the histogram the fastest fluctuations take place in a time scale of 6 to 13 ms.
15
Fig. 4 Frequency of occurrence of fast voltage variation induced by PMD fluctuation. Significant variations ( A b 0.5UJ are classified according to the required time span At.
g
5
10
E3 0
8
5 0 9.55
16.70 23.85 30.95 38.05 45.20
Time span (ms)
At
In conclusion a new transient recorder setup based on a dual wavelength heterodyne principle was realized which enables to monitor fast PMD changes. PMD fluctuations of an installed field fiber have been observed with an observation bandwidth of 1 MHz over a time period of 36 hours. Fastest PMD fluctuations occur within a time span of less than 10 ms. These measurements demonstrate that future PMD equalizing units should allow tracking of a distortion variation within milliseconds.
[l]
F.Heismann, D.A.Fishman, D.L.Wilson, "Automatic compensation of first-order polarization mode dispersion in a 10 Gb/s transmission system", proc. ECOC98, WdC11, Madrid, 1998
[2]
D.Schlump, B.Wedding, H.BUlow, "Electronic equalisation of PMD and chromatic dispersion induced distortion after 100 km standard fibre at 10 Gbit/s", proc. ECOC'98, WdC14, Madrid, 1998
[3]
H.BUlow, G.Veith, "Temporal Dynamics of Error-Rate Degradation Induced by Polarisation Mode Dispersion of an Installed Field Fiber Link", proc. ECOC'97, vol.1, Mo3C, Edinburgh, 1997, pp. 115-118
[4]
J.Cameron, X.Bao, J.Stears, "Time evolution of polarization-mode dispersion for aerial and buried cables", proc. OFC98, WM51, San Jose, 1998, pp. 249-250
[5]
R.Hofstetter, H.Schmuck, R.Heidemann, "Dispersion effects in optical mm-wave systems using self-heterodyne method for transport and generation", IEEE Transactions on Microwave Theory and Techniques, Part 2. (1995), VOI43, NO. 9, pp. 2263-2269