Cuniversity of Central Florida, Department of Mathematics, Orlando, Florida 32816 ... As part of Emerging Communications Technology task order work at KSC, ...
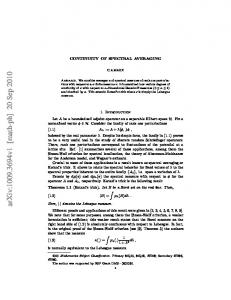
Measurements of Aperture Averaging On Bit-Error-Rate Gary L. Bastin,*a Larry C. Andrews,c Ronald L. Phillips,b Richard A. Nelson,d Bobby A. Ferrell,' Michael R. Borbath,e Darren J. Galus,e Peter G. Chifl,e William G. Harris,a José A. Mann, a Geoffrey L. Burdge,e David Wayne,b Robert Pescatoreb aASRC Aerospace, MS: ASRC-10, Kennedy Space Center, Florida 32899 bUniversity of Central Florida, Florida Space Institute, MS: FSI, Kennedy Space Center, Florida 32899 Cuniversity of Central Florida, Department of Mathematics, Orlando, Florida 32816 dNASA MS: YA-D7, Kennedy Space Center, Florida 32899 eHanis Corporation, P.O. Box 37, Melbourne, Florida 32902-0037 Abstract. We report on measurements made at the Shuttle Landing Facility (SLF) runway at Kennedy Space Center of receiver aperture averaging effects on a propagating optical Gaussian beam wave over a propagation path of 1,000 in. A commercially available instrument with both transmit and receive apertures was used to transmit a modulated laser beam operating at 1550 nm through a transmit aperture of 2.54 cm. An identical model of the same instrument was used as a receiver with a single aperture that was varied in size up to 20 cm to measure the effect of receiver aperture averaging on Bit Error Rate. Simultaneous measurements were also made with a scintillometer instrument and local weather station instruments to characterize atmospheric conditions along the propagation path during the experiments. Keywords: Scintillation index; atmospheric turbulence; signal-to-noise ratio; bit error rates; Lasercom, FSO. NRZ, 00K, BER. --
1. INTRODUCTION Advances to Free-Space Optical (FSO) communications theory are being developed at Kennedy Space Center (KSC) for a wide range of future NASA, DoD, and other US Government agency communication needs. The Shuttle Landing Facility (SLF) at KSC is a nearly ideal laser test ,rnge for developing improvements to existing optical scintillation theory, especially for developing higher performance pointto-point terrestrial-only links. Being 15,000 feet long, 300 feet wide, and with a uniformly finished surface, the SLF runway provides a homogeneous environment that enables taking exactly the precise experimental data required for extending existing optical scintillation theory. As part of Emerging Communications Technology task order work at KSC, this paper presents measurements from our ongoing research activity that is being conducted by the University-affiliated Spaceport Technology Development Contract. Participants include researchers from Harris Corporation, ASRC Aerospace, and the Florida Space Institute of the University of Central Florida, working together as a joint team. Recent research on the effects of optical scintillation on the probability of error, or bit error-rate (BER), involved the extension of the Rytov approximation into the strong fluctuation regime' and the use of a (spatially) partially-coherent source. 2 These advances in the theory will enable addressing optical scintillation degradation concerns for evaluating a wide range of future lasercom needs, including Earth-toMars, Earth-to-orbit, and Earth-to-Moon FSO links. For addressing the theoretical limits that exist for another set of future FSO needs, such as for achieving higher efficiency lasercom systems for terrestrial point-to-point links, enabling communication through rocket exhausts with FSO systems, developing lowered probability of intercept covert communication systems, and enhancing military laser target designator weapons systems, more complex theories of optical
scintillation, for predicting both amplitude and phase variations, are needed. After all, as documented in prior NASA research at JPL, space-to-ground links for satellite lasercom applications involve beam propagation through less air mass than horizontal terrestrial path links exceeding 10 km in length.3 Classical approaches to studying optical wave propagation are based primarily on studying simplified uniform plane wave and spherical wave models. Plane wave models, for example, are often used in describing the properties of starlight or laser beams passing through the Earth's atmosphere from space. Zernike's phase contrast method of observation involves assuming the existence of a phase object which alters the phase but not the amplitude of an incident plane wave. 4 Unfortunately, such simplified approaches do not account for the various effects that are caused by the finite size of a beam wave and its diverging and focusing capabilities. The traditional method to address and overcome the limitations of simplified modeling approaches is to develop theory for a basic wave model based on the lowest order Gaussian-beam wave, which is characteristic of a single transverse electromagnetic wave (TEM 00). This approach has the advantage of developing optical scintillation theory that provides, as limiting cases, the same results as have been previously shown by the earlier classical approaches. It also permits enhancing one's ability to address many of the first-level concerns that result from assuming a random media such as the atmosphere, for which small index-of-refraction fluctuations induced by random temperature variations are the primary concern.'
-- -- . -
Optical scintillation theory developed in this way is entirely consistent with Born and Rytov weak - fluctuation theories, and permits developing spectral representations for the .first-order and second-order complex phase perturbations that are consistent with the Rytov approximation. 6 Building off an extended version of the Rytov approximation is a method that characterizes optical scintillation into the focusing and saturation regimes.' This extension of the conventional Rytov theory is based on the notion that only scale sizes smaller than the spatial coherence radius or larger than the scattering disk contribute to optical - -. .. scI jIlation !Jnder moderate-to-strong irradiance fluctuations. The theory.-has,also- been extended to----account for large receiver apertures that lead to a reduction in scintillation known as the averaging effect. In this paper we report on recent measurements made at the Shuttle Landing Facility (SLF) at Kennedy Space Center. Two commercially-available instruments built by fSONA were used for the optical transmitter and receiver to perform the experiments. The purpose of the experiment was to measure the effect of aperture averaging on the BER and additionally to compare these measurements with published theory. Thus, various aperture sizes were used at the receiver end of the propagation path to study the decrease (improvement) in BER as the size of the receiver aperture was increased. Because the theory of optical scintillation in moderate-to-strong fluctuation regimes is relatively new, it has not been satisfactorily validated through the collection of experimental data. Consequently, the taking of experimental data as reported in this paper is key to determining the limitations of this optical scintillation theory.
2. OPERATIONAL SCENARIO The basic characteristics of the commercial instruments used during the experiments are listed in Table 2-1. The nominal free-space diameter of the spot size in the receive plane of the lasercom beam from the laser beam divergence was 2 meters, typical for a 1 km spacing between transmitter and receiver. Even under fairly strong turbulence conditions (i.e., C, 5x10 13 m 213 ), the beam diameter was only a few centimeters larger than 2 meters. Artificially reducing the receiver aperture from the 20-cm (8-in nominal) effective clear aperture, by controlling aperture mask diameters at the receiver; allowed simultaneously reducing receiver power levels while affecting signal to noise ratios within the data rate bandwidth. This permitted studying the affects of aperture averaging of scintillation effects for larger aperture masks on BER, at power levels for which moderate numbers of errors would occur during a reasonable time. In addition to the normal factory-standard hardware of the fSONA SONAbeam 622-M, we additionally added external neutral-density filters to the transmitting lasers. These transmitting laser add-ons enabled us
--
- --
to achieve more precisely calibrated control of the transmitting laser power, as needed to achieve the desired signal-to-noise ratios in the optical receiver as required to study bit error rates. Although reducing the aperture reduces the signal power and external noise power equally, which clearly has no impact on the signal-to-noise ratio, the internal noise power is not reduced by reducing the aperture mask diameter. Hence, reducing the aperture diameter can be used to vary the signal-to-noise ratio due to the presence of internal noise. Table 2-1
I
SONAhim 12-M IfSI'iNA
Transmission Rates Range: ___________________________________________ Laser Output Power Free-Space Wavelength Laser Beam Divergence Transmitter Type Receive Aperture Laser Safety Detector Type Laser Type
Cn
,,\
622 Mb/s (OC-12, STM-4) 450m to 5500m (3 dB/km attenuation) 560 mW, peak (4 x 140 mW) 1550 nm 2 milli-radian, nominal Directly modulated laser diode (00K) 20 cm (8-in) diameter (effective clear) Class IM (eye-safe) APD Fabry-Perot
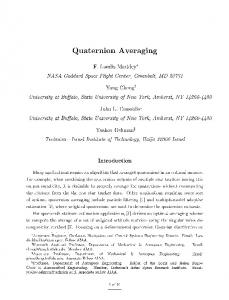
2.1 Concept of Operations Free Space Optical (FSO) equipment (ISONA SONAbeam 622M) was mounted on two trailers. Bit Error Rate (BER) measuring equipment (Transmit and Receive) was mounted in two additional trailers/vans. The trailers were towed to the centerline of the Shuttle Landing Facility (SLF) runway, separated 1 km, and experiments were run. Optical alignment was performed early in the day prior to the presence of the worst scintillation using a loop-back link from the far-end to the near-end, traversing the 1 km span twice. Once aligned, one-way scintillation tests were then conducted through local solar noon, collecting measured data of BER versus receive aperture diameters. The southern-most receive end of the link, as positioned on the SLF runway, is shown below. The northern-most transmit end of the link was similarly positioned at the center of the SLF runway, without the weather station equipment.
Figure 1 Receive-end Equipment positioned on centerline of SLF runway.
2.1.1
Instrumentation 10-12
Atmospheric conditions were continuously monitored during the experiments. Average values of refractive-index structure parameter, C,, 2 , were provided by a Scintec BLS900 scintillometer over the time period of data collection. In particular, measured values of C,, 2 that were averaged over one minute periods are shown in Fig. 2. Typical values were in the range of 10.14 to more than 10.13 m'3 . This same scintillometer instrument also provided the average cross wind speed during the time period of each experiment. Other environmental data instrumentation included a weather station that gave wind speed and direction, temperature, humidity, visibility, cloud ceiling, solar irradiance, atmospheric pressure, and runway surface temperature. Further discussion of the environmental instrumentation is provided in a companion paper.7
June 3, 2005 1-nnute averages
8 6
L
11
12
13
Time of
14
15
1€
Day
Figure 2 Measured values of the refractive-index structure parameter vs. time of day.
The Outer scale of turbulence L0 was estimated to be .1. in, equal roughly. to half the height of- the optical wave path above ground. Values of the inner scale of turbulence 1 were inferred from the surface roughness of the Shuttle Runway and average wind speed, i.e., 10 - const./ V 314 , where V denotes the average wind speed. One minute average values of the wind speed produced the inner scale values g shown in Fig. 3. Typical values of the inner scale June 3, 2005 8 calculated by this method were between 3 and 7 l-minuie averages mm. In addition to environmental data instrumentation, 6 bit error rate data collecting instrumentation was also used during the experiments. An OC-12 SONET rate signal at 622.08Mbps was generated . using an Advantest D3 186 Pattern Generator (PG). 4 The PG was configured to generate an NRZ-coded pseudo-random bit - sequence (PRES) 2"23-1 pattern data stream with a /2 mark ratio. there was 11 12 13 14 15 1€ no framing present on this signal. This PRBS . . Figure 3 Values of the inner scale inferred from one-minute signal drove a custom electro-absorption averages of the wind speed. modulated laser (EML). This modulated laser signal was then attenuated to a level that matched the acceptable operating input optical levels of the fSONA optical transceiver. Within the ISONA transceiver, this optical signal was regenerated and then used to drive any or all of the four ISONA internal I 550nm Fabry-Perot laser transmitters. Throughout the majority of our experiments, only one of the ISONA transmitters was configured to be active at any one time. Prior to running SLF range experiments, this particular transmitter was first thoroughly characterized in a controlled optical lab bench environment using various calibrated instruments. We experimentally measured laser transmitter properties including linewidth, output power level settings, beam diameter, stability, extinction ratio, and eye diagrams, all of which combined to help us better understand the limitations of the hardware and to determine which optical transmitter power levels would be best suited for use during experiments. The transmitted signal from the fSONA transmitter terminal was Sent through free space (1 km) and entered the fSONA receiver terminal. The receiver terminal focused the collected 1 550nm light onto an
Avalanche Photo Diode (APD). This received optical signal was then regenerated inside the fSONA terminal using a trans-impedance amplifier (hA), pre-amplifier, bandpass filter, post-amplifier, and limiter. The recovered data stream was then used to drive another internal laser to transport the received data out of the fSONA receiver terminal. Once the signal was removed from the fSONA receiver terminal, we needed to sample it again to recover the original transmitted pattern from our PG on the transmitter side. This was done using a high-sensitivity, multi-mode, 2.5Gbps multi-rate receiver module. This module drove a clock and data recovery (CDR) circuit which then fed the recovered data and clock to the Anritsu D3286 Error Detector. Automated instrument drivers controlled and synchronized data collection among the scintillorneter, weather station and the fSONA's received optical power meter during the entire time that data was collected. 2.1.1
Theoretical Equations
The modulation format of the SONAbeam 622-M FSO equipment used in this study is considered to be bounded by the theoretical performance of 00K (ON-OFF Keying), despite being NRZ-coded (non-returnto-zero coded). This modulation type is chosen because the receiver does not take advantage of coherent methods of detecting transmitted NRZ coded signals, but instead uses only non-coherent 00K detection techniques. The significance of this is that the theoretical performance of the FSO equipment used is 3 dB worse than if coherent NRZ decoding were used. Probability of error, which determines the theoretical Bit Error Rate (BER) curve performance, is given for NRZ-coded electrical data by8 Pr(E) = i. erfc(J)
-:
-
(1)
where erfc(x) denotes the complementary error function and z is the data signal to noise power ratio. This same probability of error equation applies equally for any antipodal-encoded modulation (e.g.. NRZ, BPSK, PRK, etc.) in which the cross-correlation, R12 , equals -1 between the two signaling states. 9 It does not, however, express the predicted probability of errof for 00K (ON-OFF Keying.) For 00K (which is orthogonal-encoded modulation), the cross-correlation between the two signaling states equals zero, and this shifts the theoretically-predicted BER curve 3-dB worse than antipodal signaling for the required signal-to-noise ratio that is necessary for achieving any particular desired BER performance.'° 00K is also sometimes called Intensity Modulated Direct Detection (IMIDD). In practice, true 00K is difficult to achieve for FSO systems, which are limited by the extinction ratios existing between the two states. OFF is never truly OFF. For the equipment used in this experiment, an extinction ratio of approximately 10 dB is all that is achieved for the '00K modulation' encoded states by the hardware. Despite being '00K-decoded', the effective modulation encoding is therefore actually NRZ-encoded for the hardware used in this experiment. The theoretical BER limits pertaining to NRZ rather than to-OOK are most applicable for predicting absolute theoretical BER performance curve limits. However, due to non-coherent receiver operation, the theoretical BER limits for 00K (IMIDD) remain more representative for predicting the measured performance of the hardware under investigation. Hence, a choice of comparing against the theoretical BER curve pertaining to 00K (1MJDD) is taken as the appropriate theoretical limit for the present investigation, despite giving up 3-dB from the actual theoretical limit that also exists. 00K additionally provides by far the better BER analytical model than NRZ for modeling the SONAbeam 622-M gear's BER performance, due to its assumption of full bit-window data bits, and non-coherent data detection in the actual hardware.
Probability of error for 00K-coded electrical data is given by:
PE = f erfc [.f i]
(2)
A theoretical lO BER is achieved for approximately a 15.6 dB data signal to noise power ratio. Probability of error for 00K-coded optical data, detected with a photodiode (see Appendix I), is given by:
erfc[!ifJ
'E
(3)
A theoretical I O BER is achieved for approximately a 21 .6 dB signal to noise power ratio. This BER performance level applies only in the absence of atmospheric turbulence, which only increases the effective implementation loss of hardware measured against theoretical 00K-coded BER perforiTlance curves. Such 00K-coded or IMIDD data has also been known as unipolar Non Return to Zero Level, NRZ-Level, and NRZ Change encoded data when discussed in IRIG telemetry standards.'2 The data signal to noise power ratio in either case (i.e., for either NRZ or 00K) is z which is defined as --
...-
-.
Sr --z=-
-
N0
.
--(4)-
where S is the total signal power in Watts, z is the bit period in seconds, and No is the noise power spectral density in Watts/Hz. The inverse of the bit period is the bit rate bandwidth. That is, (5)
2
Re-writing Eqn. 4, the physical interpretation becomes the ratio of the total signal power to the total noise power, i.e., the signal to noise ratio, as measured in the bit rate bandwidth. That is to saly:
S Eb N0 R N0
(6)
Provided that average signal-to-noise ratio, denoted by , is defined in exactly the bit rate bandwidth, becomes exactly equal to the . The key point is that the signal to noise ratio is not what determines the BER performance, unless proper assumptions are made relative to the bandwidth over which the noise power spectral density is assumed to be integrated. in the presence of atmospheric turbulence, the probability of error (BER) is considered to be a conditional probability that must be averaged over the probability density function (PDF) of a random signal s to determine the unconditional BER. This action leads to the expression:
Pr(E)=iJPz(s)erfc[j 2 where is the average signal-to-noise ratio and mean).
lds
(7)
)
p1 (s) is the PDF of the normalized signal (unit
Rather than using the traditional log-normal PDF, which is valid only under assumptions of weak turbulence, we find that the gamma-gamma PDF is more accurate under both weak and strong turbulence conditions. Hence, in our analysis, we use the gamma-gamma PDF defined by'3:
2(afl))'2 (a+/J)/2_I K ap ps(s) = F(a)F(fl)
where parameters and
(2,j),s
>0
(8)
f3 are
related to the reciprocals of the large-scale and small-scale irradiance fluctuations, respectively, of the random signal. In particular, the scintillation index of the irradiance fluctuations takes the form: o
=ex
P[ cr
(lo,Lo,D)+o(1o,D)]_l,
(9)
where D is the receiver aperture diameter, and where we define: 1
a
fi
= Expressions for the large-scale and small-scale irradiance fluctuations are provided in Ref. 1.
(10)
= exp[a,(lo,D)]_ 1
10.1
I
The implementation loss measured relativ& iô the NRZ theoretical curve is what determines the absolute quality of any particular set of hardware, as well as the true performance impact introduced by an assortment of degradations ranging from perhaps the timing uncertainty in particular bit synchronizers to, as is the topic of interest in this paper, the BER effects of optical scintillation versus aperture diameter size. For applying the results to real hardware, however, while accounting for real hardware limitations, the 00K theoretical curve is often more applicable, such as is the case for the measurements reported herein.
-. 0mef0y(l.pp,..1:4opM) - - - i rnwute aeages
A A A -- A A A A A A AA • A A A A A A.A • A • • _ A A A ••A • :
-
10.2
W io3
.
A. •
•
A
•
V
iüNoise power = 5.5 nW Rx Diameter = 1.25 in
• Measured
= A Theory 16
18
.Ji;Jn 3. 20)5
20
22
24
26
28
30
32
34
(dB)
Figure 4 BER as a function of the average signal-tonoise ratio based on one-minute averages. The receiver aperture was 1.25 inches. Filled circles represent measured data and the open triangles correspond to theory.
3. RESULTS Measured and theoretical values of the BER for a receiver aperture of 1 .25 inches are shown in Fig. 4 for one-minute averages. The rather meaningless scatter-diagram of Fig. 4 shows the need for increasing the averaging time in order to make meaningful comparisons between theory and measured data. We therefore performed averages of all quantities over a five-minute period and replotted the results in Fig. 5. In Fig. 5, we also included measured data over the time period from 1:45 PM to 3:00 PM with corresponding predicted theoretical values. During this latter time period,
1
10 Nsepon.er5.5nW Rx0iameter= 1.25 in June 3, 2(05 10
o
A W 10 a)
•
00 0
0
U
Measured (l:(0-1:40 PM) Thecy(1:O0-1:40PM) Measured (1:45-3:(0 PM> • 0 Theay (1:45-3:(0PM) • I • I • I 23 24 25 26 27 28 •
o
•
10
•
o o
o
•
V
&
•
0
1 I 29
I • 30 31
(dB)
Figure 5 Same as Fig. 4 except based on five-minute averages.
however, we often lost lock on the BER instrumentation and most of the measured data was at either high BER values or nearly zero. We believe taking data over longer time periods (5-10 mm.) would eliminate most of the remaining erratic behavior observed in comparing theoretical predictions with measured data. For both Fig. 4 and Fig. 5, to compare theoretical predicted results with these measured quantities, it was necessary to first calculate the mean noise power at the receiver. This back-to-back measurement was done under laboratory conditions in the absence of atmospheric effects and found to be 5.5 nW for Transmitter Power Level 7. Transmitter Power Level 7 for the fSONA transmitter was chosen specifically since it had the best extinction ratio (best eye diagram) in contrast to Power Levels I through 6, thereby reducing the introduction of hardware effects in accurately measuring the BER performance impacts of atmospheric turbulence. Using this value for the mean noise power, and the measured average signal power at the receiver, the resulting theoretical BER was calculated using Eq. (6) and also shown in Fig.s 4 and 5. The parameters (8) of the gamma-gamma distribution (7) were based on path-averaged values of C,,2, calculated inner scale values over the period of the experiment, and the strong fluctuation scintillation theory.' The data of Fig. 4 and Fig. 5 show that we are still at a preliminary stage in validating our theory for predictive purposes, and that considerably more collected data are required to complete the validation. Considering that BER is a predictive tool for estimating average performance in an otherwise random environment, the need for more data is not surprising. Fig. 6 shows measured BER and error count data versus receive aperture diameters of 2-inches, 3-inches, and 8-inches (full-aperture) over a 1 km link. For aperture diameters of 2-inches, the measured BER is seen to have often clustered around iO 3 , showing only occasional improvements to 10 to 10b0. The full aperture (8-inches), when checked around 1:55 PM, provided essentially 10.12 or better (error-free) BER with only a few instances of i0 BER However, for receive apertures of 3-inches measured around 3:00 PM, BER performance ranges from i0 to I012 or better (i.e., error-free.) The data therefore indicate that over a 1 km terrestrial link, a receive aperture diameter of 3-inches, or larger, is probably the minimum that .. .......- .- -. . should be. used-to achieve .good or adequate-performance. BB & & ror Count SLF23mayO5; 1 Km Link
. .
1000000000
1.000000E 0I t000000E 02
:2 Aperture©7oc
Rx:2Aperture@7 o'c
Rx:FuflAperture . -
1r7-@-l12cIoCk----------TXi-E7-@4GcIoCk
100000000
___________ ___ __._
1.000000E-03 1.000000E-04
. . .. -----1000000
.
1.0000000 05
--- -. ------ -.Rx:FullAperture
t000000E-06
-
_________ 100000
_©_1.0
-G-
1.0000000-07
--------- -- -_--_ -
e &,or Ratio _D_
0
1000000E-00
.
Rx:3Apertu
-- rrrz-gio
a
t000000E-09
oo 100
. .
l.000000E 10 -
o
l.000000E 11 -
-. .,-
t000000E- 12 -
. .--. - -
a. o-
.
0
1.0000000 13 12:00 PM
lo000 @7o'c
12:28PM
12:57PM
1:26PM
1:55PM
2:24PM
Time
Fig. 6 BER & Error Count versus Receive Aperture Diameter show considerable improvements of 3-inch receive aperture diameter performance over 2-inch receive aperture diameter performance.
2:52PM
0 &rorCount
- Although the 3-inch minimum diameter for achieving good BER performance over a 1 km link appears to be the minimum diameter that should be employed, there are times when a smaller diameter aperture can nonetheless provide surprisingly good performance, lasting through appreciable periods of 'good seeing.' Fig. 7 shows measured BER data for 1.0-inch and 1.25 inch apertures, respectively, measured over a 1 km long link. For the 1-inch diameter receive aperture, a BER of around I 0 to I 0 is as good as could be achieved. Yet, for a 1.25-inch diameter receive aperture, BER performance often achieved 10.6 to 10.12 to error free. These data also show that increasing aperture averaging through increasing receive aperture diameters only slightly can be a major factor in determining, or at the very least improving rather dramatically, the BER performance of a free-space optical link. Aperture averaging can clearly work to improve measured BER performance dramatically for only very slight increases in receive aperture diameter under appropriate atmospheric turbulence conditions. The variations of the refractive-index structure parameter, C 2 , must also be considered, in addition to the variations in the receive aperture diameter for completeness, less the importance of only slight differences in receiver aperture diameter become overstated. Fig. 8 shows C,, 2 variation for June 3d, applicable for the measured data shown in Fig.s 2,
3, 4,
5, and 7 vs. measured BER. As one would expect, the peak of C,,2 occurs around local solar noon, perhaps delayed slightly (10-15 minutes or so) at which time the scintillation is near its peak diurnal value. It then decreases rather rapidly for approximately an hour, as the sun descends toward the western horizon, before plateauing to nearly a constant value. 3 June 05. 1Km. Bit Error Ratio To Level 7; Rx&Tu 1 oclock position
10 .05
..._._ ......_._
-.-.---.---•-
- ----
1E-08-- ..
.
-- - .--
••--- -
0 Error Ratio
.
---.--___
._. .-----
IE-It E - 11
-----..._______________________________________-----------•..•--
-------
E-07 -- -
1E-09
___
___
oo, •
._
.
1E . 12 .11048 AM
.
----------.-.-.•-- - - -. ---
- -. - 1116AM
1145AM
1214 PM
12A3PM
112 PM
140PM
209PM
238PM
1-n'.
Fig. 7 BER versus Receive Aperture Diameter for 1.0-inch and 1.25-inch receive aperture diameters, 1 kmlink..
. 307 PM
315PM
3OOE-3
2 WE-U
ZOOE.t3
50E-13
OEr, Ro o CUC
I OCE-IS
5 XE-IA
Fig. 8 BER and CnA2 versus Receive Aperture Diameter for 1.0-inch & 1.25-inch receive aperture diameters. 1 km link.
4. CONCLUSIONS Results of tests conducted at the SLF runway at KSC have been presented. The absolute accuracy of the theoretical predictions of BER performance versus measured BER for specific receiver aperture masks are still inconclusive based on the limited data obtained during these experiments. The theory matches much of the measured data quite well but some of the measured data does not fall where the theory predicts. -Additionai experiments aTe necessary to-make more definitive statements :abor the between our theory and measured results. Longer term data collection would enable improving the accuracy of the theory through better understanding the limitations of the presently-developed predictive equations. The fundamental characteristic of improving BER through increasing receive aperture diameter, though, is clear. Differences in aperture averaging through increasing receiver aperture diameters only slightly can sometimes greatly improve measured BER performance. Additionally, there are rather long moments of 'good seeing' during which times surprisingly good BER link performance can be achieved despite the use of rather small receiver aperture diameters. More research is needed to understand better the limitations and benefits of aperture averaging to achieve better BER performance for terrestrial pointto-point data links. In addition to the receiver aperture averaging advantage reported in this paper, transmitter aperture averaging effects also need to be investigated in the course of future research. 4. ACKNOWLEDGEMENTS The help provided by Mr. Ed Taff, NASA Shuttle Landing Facility (SLF) Manager, in coordinating the use of the SLF runway as a laser test range, while not impacting Shuttle Training Activities (STA) required by astronaut crews training for Return to Flight (RTF) is gratefully acknowledged. Mr. James Kennedy, Center Director of the John F. Kennedy Space Center, is gratefully acknowledged in approving our nonstandard use of the SLF despite the schedule pressures of RTF. The addressing of safety issues associated with our unusual use of the SLF could not have occurred without the able assistance of Mr. Ennis Shelton, of NASA KSC Health Physics, and of Mr. Arthur Shutt, Safety Engineer of the University-affiliated Spaceport Technology Development Contract (USTDC.) Their continued assistance through the lengthy period of collecting data is gratefully acknowledged. The support of Harris Corporation, in supplying personnel and test equipment to enable the collection of real-time scintillometer data and weather data, is gratefully acknowledged. Likewise, the support of the Florida Space Institute, and of the University of Central Florida, in sharing research equipment and providing assistance from Graduate Students is gratefully acknowledged. The technical support of fSONA Communications Corporation, Richmond, BC, Canada, in answering technical questions and supporting conference calls, is gratefully acknowledged.
5. APPENDIX I - Optical BER Equations for 00K The difference in dBe (electrical decibels) versus dBo (optical decibels) primarily comes from the optical to electrical conversions occurring in photodiodes. A similar difference also occurs when deriving theoretical BER equations for RF vs. Electro-Optical 00K systems in terms of signal-to-noise ratios. To see this difference, let the output current from the receiver photodiode be (neglecting atmospheric effects): (11) where i5 = signal current and i,., = noise current. Hence, the noise to be zero-mean Gaussian, then:
=
1
p (1)
i and
=
=
.
If we assume
exp 1 ---
(12)
2oJ
1 p5(i)_,,,,._ -
(13)
2cr, exp[_fl )•
The first expression is the pdf on noise alone and the second is the pdf for signal and noise. Hence, the false alarm probability and detection probability are given by:
=
Jp (i)di =2 er/c _T
(14)
- .
Pdet=JrPs^(i)di=!erfc[TjLJ
(15)
where T is the threshold. The error probability (BER) for a digital system is defined by:
BER=--PJ. + ! P d where
= 1— .F
(16)
et . For 00K, set a threshold halfway between "ON" and "OFF", i.e., at T
= O.5i3.
In this case, we find: fa
is
(17)
fade
.2
BER= 1 erfc "_s j= i erfc[i tf i J z=SNR=---
2hcr
cr
(18)
The effect of the optical power to electrical current conversion using a photodiode is to add approximately 6 dB the theoretical 00K required for electró-optical versus RF/electrical communication systems, to achieve the same BER performance.
to
6. REFERENCES [1] L. C. Andrews, R. L. Phillips, and C. Y. Hopen, Laser Beam Scintillation with Applications (SPIE Press, Bellingham, WA (2001). [2] 0. Korotkova, L Andrews, R. Phillips, "Model for a partially coherent Gaussian beam in atmospheric turbulence with application in Lasercom," Opt. Eng. 43(2) 330-341 (Feb. 2004). [3] A. Biswas, M. Wright, B. Sanii, N. Page, "45 Km horizontal path optical link demonstrations," Proc. SPIE 4272, 60-7 1 (2001). [4] M. Born, E. Wolf, Principles of Optics, Pergamon Press, New York, NY (1975), Fifth Edition, pp. 424428. [5] L. C. Andrews, R. L. Phillips, Laser Beam Propagation through Random Media, SPIE Press, Bellingham, WA (2001). [6] L. C. Andrews; R. L. Phillips, Laser Beam Propagation through Random Media, SPIE Press, Bellingham, WA (2001), Chapter 5. [7 1 F. S. Vetelino et al., "Characterization of the Shuttle Landing Facility as a Laser Range For Testing and Evaluation of EO Systems," Proc. SPIE 5891 (2005). [8] R. Ziemer, W. Tranter, Principles of Communications, Systems, Modulation, and Noise, Houghton Mifflin Co., Boston, 1976, p. 315. [9] R. Ziemer, W. Tranter, Principles of Communications, Systems, Modulation, and Noise, Houghton Mifflin Co., Boston, 1976, pp. 315-316. [10] R. Ziemer, W. Tranter,.Principles of Communications, Systems, Modulation, and Noise, Houghton Mifflin Co., Boston, 1976, pp. 3 19-320. [11] R-. Zierner, W. Tranter, Principles of Communications, Systems, Modulation, and Noise, Houghton Mifflin Co., Boston, 1976, p. 315. [12] (RIG Standard 106-04, Part I, Appendix C, p. C-I (p. 356 of 495.) http://www.ntia.doc.gov/osmhome/106-04.pdf, approved for public release, unlimited distribution. [13] M. A. Al-Habash, L. C. Andrews, and R. L. Phillips, "Mathematical model for the irradiance PDF of a laser beam propagating through turbulent media;" Opt: Eng. 40, 1554-1 562 (2001).