Here we report stable isotopic measurements of. CO in an urban area, Mainz, Germany together with measurements of exhaust gas from automo biles using ...
Geochemical
Journal,
Vol.
Measurements
33, pp. 73 to 77,
1999
of stable
carbon
of CO in automobile from
and
oxygen
exhausts
semi-urban
Mainz,
and
isotopic
compositions
ambient
air
Germany
SHUNGO KATO,' HAJIME AKIMOTO,' MAYA BRAUNLICH,2 THOMAS ROCKMANN2 and CARL A. M. BRENNINKMEIJER2 l Research Center for Advanced
Science and Technology
4-6-1 Komaba, Meguro-ku, 2Atmospheric
Chemistry
Division
Johann-Becher-Weg
Tokyo
, The University 153-8904, Japan
of Tokyo,
, Max Planck Institute for Chemistry, 29, 55128, Mainz, Germany
(Received June 26, 1998; Accepted October
13, 1998)
Stable isotopic measurements of atmospheric CO (13CO, C180) were carried out at three season in a middle size city, Mainz in Germany. CO stable isotopic compositions of car exhaust fueled by gasoline , diesel and natural gas were also measured and showed different isotopic compositions (8180 vs . V-SMOW = 22.3 ± 0.3%0, 10.9 ± 0.8%o, 20.1 ± 1.0%o and 813C vs. V-PDB = -29.9 ± 0.3%0, -22.2 ± 1.1%0, -51 .3 ± 1.5%0, respectively). The 180/160 ratios of atmospheric CO in Mainz show a clear linear correla tion with the reciprocal concentration of CO. This reveals the contribution of CO emitted from a single pollution source (8180 = 20.7 ± 0.5%o V-SMOW), whose isotopic composition is close to that of CO from a gasoline engine combustion. From this value and car exhaust measurements, about 14 ± 7% of CO in Mainz air is estimated to originate from diesel fuel engine combustion. The oxygen isotopic composition can be used as a good indicator of contamination from car exhausts . On the other hand, the 13C/12C ratios of CO do not show a clear relationship with the reciprocal concentration of CO .
(Stevens et al., 1972). Measurements were also made in the upper troposphere using an, airplane (Brenninkmeijer et al., 1995, 1996). Stevens et al. (1972) reported CO isotopic measurements in several big cities and estimated the average CO isotopic composition from car exhausts. They also measured CO isotopes at a rural site in Illinois where air pollution was occasionally occurred. Sakugawa and Kaplan (1997) reported CO isotopic measurements in Los Angeles. In spite of these works, not enough information about isotopic compositions of CO sources is available. When discussing the CO budget in the atmosphere, au tomobile exhaust is one of the most important CO sources, especially in the northern hemisphere. Here we report stable isotopic measurements of CO in an urban area, Mainz, Germany together with measurements of exhaust gas from automo biles using different kinds of fuels.
INTRODUCTION
Carbon monoxide (CO) is an important mol ecule in the atmosphere because it reacts with OH radicals thus affecting the lifetime of many trace species in the atmosphere. Since CO has a rela tively short lifetime in the atmosphere (about 1 to 2 month) and its sources spread in wide variety, the CO concentration in the atmosphere has con siderable spatial and temporal variations. CO is also a good indicator of human activity since fossil fuel combustion is one of the main CO sources. Isotope measurements of atmospheric CO (13CO, C180) have been carried out because this approach is useful for better understanding of source ap portionment. Measurements in background air have been made in the Antarctica (Brenninkmeijer, 1993), in the Arctic (Rockmann and Brenninkmeijer, 1997), and at selected remote sites 73
74
S. Kato et al.
In this paper isotopic composition is expressed with S notation, e.g., 5180 = 1000 x ((180/ 160)sample/(180/160) standard 1}%o in the case of C180. Standards are V-SMOW and V-PDB for oxygen and carbon, respectively.
EXPERIMENTS
CO isotope compositions were measured using the method described by Brenninkmeijer (1993). Briefly, the air was introduced into the CO ex traction line with a mass flow controller. At first, two very effective cold traps named Russian doll trap (Brenninkmeijer, 1991) remove H20, CO2, N20, and hydrocarbons (except for CH4). Then using Schiitze reagent (1205 supported on silica gel) only CO was oxidized into CO2, which is trapped with another cold trap down stream. The amount of CO2 derived from CO was measured with a piezo resistive pressure sensor in a cali brated small volume, and stable isotope ratios were measured using an isotope mass spectrometer (Finnigan MAT252). The oxygen isotopic com position of CO can be calculated from the oxidized CO2 isotopic composition, since oxidation process by Schatze reagent is known to add one oxygen atom onto CO, without causing isotopic exchange (Brenninkmeijer, 1993). For the measurements
of atmospheric
CO in
Mainz, ambient air was collected through a 1/2 inch PFA tube from the roof of a Max Planck Institute for Chemistry building in Mainz (50°N, 8°E). Sample air was dried with about 1 L mo lecular sieve (13X) at the sampling inlet. Mainz has about 200,000 inhabitants and is located about 30 km southwest of Frankfurt (am Main). The institute's three-storied building is located on the Mainz university campus, which is surrounded by roads with considerable traffic. Measurements were made on June 11, 13, 16, October 14, 17 and December 2, 3, 4 in 1997. Samples were collected 4 to 6 times a day. For convenience the three sampling periods are called "summer", "au tumn" and "winter". Sample flow rate was set at about 3 L/min and about 300 L air was processed in each experiment. In these measurements the
error
is estimated
±2%
for
CO concentration,
±0.3%o for 5180 and ±0.3%o for S13C.
Car exhaust gas samples were collected with 6 L Tedlar bags or 50 ml syringes from the tail pipe. During sampling, the cars were stationary and the accelerators were somewhat pushed down. CO free air (zero gas) made using Sofnocat catalyst (Mo lecular Products Ltd.) was injected as a main flow into the CO extraction line at the rate of 3 L/min. The sampled exhaust gas was injected slowly through 1/16 inch metal tube upstream of the mass flow controller. RESULTS AND DISCUSSION Atmospheric
CO measurements
During the whole sampling period the CO concentrations varied from 186 ppb to 1741 ppb with lower concentrations appearing mostly in summer and higher concentrations in winter. The higher concentrations in winter would be caused by the stagnation of air because of an inversion layer, while in summer the mixing layer would be much higher to result in the lower CO concentra tion near the ground. This mixing would be very effective because CO concentration of around 200 ppb during summer is quite low for urban areas, which is comparable to the value at a remote site in northern hemisphere during winter (Derwent et al., 1998). A diurnal change of CO concentration was also noted; in the morning and evening CO concentration was higher in most of the days. This can be explained simply by an enhanced automo bile traffics during these hours. In Figs. 1 and 2, oxygen and carbon isotopic compositions of CO are plotted against reciprocal of CO concentration. A good linear correlation of 6180 and 1/[CO] over a wide range of isotopic value (9 to 20%o) can be seen in Fig. 1. On the contrary, 813C varied only 3%o and does not show clear linear correlation as seen in Fig. 2. Car exhaust measurements Results ral gas,
of the automobile
gasoline
Fig. 3 together
and
diesel
exhausts fuels
with atmospheric
are
using
natu
plotted
measurements
in in
C and 0 isotopes
22
of CO in automobile
exhausts
75
and air
30
i
Esim
summer • autumn O winter
20
3 0 18
ed ar e'xha st a veralee
I
I
kev~ns
;t al
191 21
I
i
I
xx
30
52at
I
20 natural
N 16
gasolinej
i
Eli
iI
gas i
I
,~ x
0
Y T.~A
14
r C
0 ~0 12
10
Los An, ;ele!
z
(S aiB
awa
and Kap lan, 199
7)
7
0
n e
i I
CIO
10
1
2
3 4 1 / [CO] (PPM)"
(Th
sw
ork)
Z-K
{diesel
i
s
01
8
0
M iinz
5
6
Fig. 1. Relationship between 5180 of CO and recip rocal of CO concentration. The solid line is a least square fitting of all measurements. The CO isotopic composition of polluting source is estimated 5180 = 20.7 ± 0.3%ofrom the intercept. Error bar for II[CO] is omitted since it is smaller than the size of symbols even at l/[CO] = 5.
1 1 1 1 1 1 1 1 1 1 1 1 1 1 1 1 1 -50 -40 -30 -20 S ' 3C (%o) vs. V-PDB
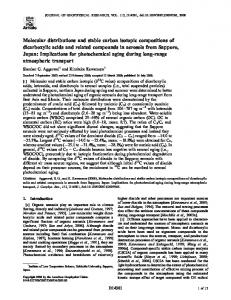
Fig. 3. Measured CO isotopic compositions of car exhausts; gasoline engine ((D), diesel engine (0) and natural gas engine (0). The atmospheric CO in Mainz (this work; A: summer, •: autumn and 0: winter) and in Los Angeles (x: Sakugawa and Kaplan, 1997) are plotted together. The average isotopic composition of automobile engine exhausts estimated by Stevens et al. (1972) is also included in the figure (D).
-25 0 summer autumn O winter
-26
T
a -27
r
1 Tr
r'Sc
T
0 U -28
I I
A
1
-29
-30 0
1
2
3
4
5
6
1 / [CO] (ppm)''
Fig. .2. Relationship between 613C of CO and recip rocal of CO concentration. The solid line is a least square fitting of all measurements with the intercept 313C=-28.7±0.3%a
Mainz (this work), and Los Angeles (Sakugawa and Kaplan, 1997). Gasoline cars without cata lytic converter give 5180 of 22.3 ± 0.3%oand 513C of -29.9 ± 0.3%o. No difference between just af ter starting the engine (cold engine) and after driving (hot engine) was observed. Gasoline cars with catalyst emit CO with the same isotopic
compositions as the one with non-catalyst car for cold start. For hot engines, the CO concentration in the exhaust from the catalyst car was too low to make isotopic analysis by the present sampling procedure. The oxygen isotopic composition from a gasoline fueled car is very close to the atmo spheric oxygen isotopic composition (5180 = 23.5%o), implying that atmospheric oxygen is transmitted to CO in the combustion process without significant isotopic fractionation. Brenninkmeijer and Rockmann (1997) reported oxygen isotopic compositions of CO from hot engine (5180 = 19.5 ± 1%o)and cold engine (8180 = 6 ± I %o). The former is consistent with this work, however, the latter is very light compared to the present data. The extent of kinetic isotope effect may depend on various factors, especially under cold engine conditions. The average isotopic composition of automobile engine exhausts esti mated by Stevens et al. (1972) is also plotted in Fig. 3. These values (513C= -27.4 ± 0.3%o,5180 = 24.6%o) were estimated from the atmospheric measurements in some big cities over the world. They also reported that the carbon isotopic com
S. Kato
76
positions of CO are different urban atmospheric CO will isotopic
composition
of the fossil fuel used in each
city. The 813C of gasoline work is about value
in big cities. pically
3%o lighter
estimated
in each city, since inherit the carbon
from
engine
exhausts
than the average
atmospheric
This may be explained
light fossil
in this
et al.
[CO] = [CO]bg + [CO]s,
(1)
8180 = ([CO]bg X 6180bg + [CO]s X 6'8Os)/[CO]. (2)
isotopic
measurements by the isoto
fuels used in Mainz.
Diesel cars without catalyst give lighter oxy gen and heavier carbon (6180 = 10.9 ± 0.8%o and 813C = -22.2 ± 1.1%) both for cold and hot engine condition. This large isotope fractionation of oxy gen could be from the incomplete combustion. This also causes the carbon particle production in diesel engine exhaust and might affect the frac tionation of CO carbon isotopic composition. Busses running with natural gas in cold and hot engine condition give nearly the same oxygen isotopic composition as gasoline engine car but gives much lighter carbon (6180 = 20.1 ± 1.0% and 813C = -51.3 ± 1.5%o). The proximity of the 6180 value to that of atmospheric oxygen my be indicative of a highly efficient combustion, which excludes fractionation process. Biogenically and thermogenically produced CH4 in natural gas has very light carbon isotopic ratios with wide variety (613C = -44%o in average; Stevens and Engelkemeir, 1988), so the present results may reflect the light isotope composition of the fuel used.
Oxygen isotopic compositions of CO as an indi cator of local car exhaust emissions to the ambi ent air We present the oxygen isotopic composition of the atmospheric CO as a sum of the background 6180 and the local source 8180 (see Eqs. (1)-(3)). Similar equations are applicable for carbon simply by changing the notations. [CO] and 8180 repre sent CO concentration and its oxygen isotopic composition at a sampling site, respectively. [CO]bg and 818Obg represent CO concentration in the background air and its isotopic composition. [CO], and 8180, represent additional CO concen tration and oxygen isotopic composition of CO due to local pollution source, respectively.
Substituting Eq. (1) in Eq. (2) one gets the fol lowing equation:
180 = {[CO]b g X (818Obg 8180s)1/[CO] + 618Os. (3) This equation means that if the measured air is contaminated by a single category of CO source, the plot of 6180 against 1/[CO] gives a linear cor relation and the intercept (l/[CO] = zero) gives the isotopic composition of the polluting CO source. Figure 1 gives a linear correlation of 8180 and l/[CO] with an intercept of 6180 = 20.7 ± 0.3%0, which is close to that of gasoline engine exhausts. The error is taken from standard error of least squares fit. Thus, it is likely that most of the polluting CO in Mainz comes from gasoline car exhausts. If one tries to explain the slightly lower 5180 estimated by interception than that of gasoline exhaust (22.3 ± 0.3%o) by mixing gaso line and diesel exhausts (10.9 ± 0.8%0), 14 ± 7% of CO needs to come from diesel exhausts. It has been known that the CO destruction reaction, CO + OH CO2 + H, induces an inverse 10% kinetic isotope effect in oxygen (Stevens and Wagner, 1989), which could result in lighter in oxygen in the atmospheric CO as compared to the source CO. However, automobile exhaust CO does not travel for long time enough to make large CO isotopic fractionation before reaching the sampling location in Mainz. For example, if we assume the OH concentration at 106 molecules cm-3 and use kco+ox = 2.8 x 10⁻¹³ cm3 molecules-is-1, about 4 days are needed to decrease 1%o from original 6180 of car exhausts, which is much longer than the expected traveling time of CO within the city. There are considerable seasonal isotopic and concentration changes of background CO. The seasonal variation of background air would disturb a correlation found in Fig. 1, because the slope of Eq. (3) is not constant in this case, and it will be
C and 0 isotopes of CO in automobile
exhausts
and air
77
difficult to make a single line found in Fig. 1 es
spectrometer
pecially at low CO concentration. Using Eq. (3), we can estimate this influence. For example, the background CO concentration is constant at 150
ported by CREST(Core Research for Environmental Science and Technology) of the Japan Science and Technology Corporation.
ppb and its oxygen isotopic composition changes from 3 to 9%o, the observation of 8180 will show about 5%o difference at 1/[CO] = 5. Also when the isotopic composition of background CO is constant (S180bg = 6%0) and the background CO concentration changes from 110 to 160 ppb, the observation of 8180 will show about 4%o differ ence at 1/[CO] = 5. When assuming a suitable background CO concentration and an isotopic composition for each season in the Mainz mea surements, the contribution of the CO background concentration and isotopic composition can be canceled and give a single line as shown in Fig. I within a range of scattering of data.
If 14% of diesel exhaust (S13C = -22.2 ± 1.1%o) mixes into gasoline exhaust (S13C = -29 .9 ± 0.3%0) as estimated from the oxygen iso topic composition, the resulted S13Cwill be -28.8 ± 0.4%0. This estimated value is close to the in tercept of the least square fit (813C = -28.7 ± 0.3%o). However, this consistency seems to be just by chance because the observed 813C have large scatter. When the CO concentration is high (1/ [CO] < 2), where the isotopic compositions are strongly influenced by the CO source and should be reflected more correctly, the observed 613C values are heavier than the expectation. This means there is a pollution with heavier carbon at high CO concentration. For example, heavier carbon fuel locally used might have affected the obser vation because of stable thin inversion -layer in winter. The observed atmospheric carbon isotopic value varied only 3%o, since background CO and automobile exhaust CO do not have large differ ence. Therefore, the carbon isotopic composition is not a sensitive indicator for assessing the con tribution of car exhaust. In contrast, the oxygen isotopic composition has been found to be a useful indicator of pollution from automobiles. Acknowledgments-We thank R. Hofmannfor helping the car exhaust sampling,and W. Hanewackerfor mass
operation.
This research
is partially
sup
REFERENCES Brenninkmeijer, C. A. M. (1991) Robust, high-effi ciency,
high-capacity
cryogenic
trap. Anal.
Chem.
63,
1182-1184.
Brenninkmeijer, C. A. M. (1993) Measurement of the abundance of 14CO in the atmosphere and the 13C/ 12C and 180/160 ratio of atmospheric CO with ap plications in New Zealand and Antarctica. J. Geophys. Res. 98, 10595-10614. Brenninkmeijer, C. A. M. and Rockmann, T. (1997) Principal factors determining the 180/160 ratio of atmospheric CO as derived from observations in the southern hemispheric troposphere and lowermost stratosphere. J. Geophys. Res. 102, 25477-25485. Brenninkmeijer, C. A. M., Lowe, D. C., Manning, M. R., Sparks, R. J. and Velthoven, P. F. J. (1995) The 13C, 14C, and 180 isotopic composition of CO, CH4, and CO2 in the higher southern latitudes lower stratosphere. J. Geophys. Res. 100, 26163-26172. Brenninkmeijer, C. A. M., Muller, R., Crutzen, P. J., Lowe, D. C., Manning, M. R., Sparks, R. J. and Velthoven, P. F. J. (1996) A large 13CO defect in the lower Antarctic stratosphere due to "ozone hole" chemistry: Part 1, observations. Geophys. Res. Lett. 23, 2125-2128. Derwent, R. G., Simmonds, P. G., Seuring, S. and Dimmer, C. (1998) Observation and interpretation of the seasonal cycles in the surface concentrations of ozone and carbon monoxide at Mace Head, Ireland from 1990 to 1994. Atomos. Environ. 32, 145-157.
Rockmann, T. and Brenninkmeijer, C. A. M. (1997) CO and CO2 isotopic composition in Spitsbergen during the 1995 ARCTOC campaign. Tellus 49B, 455-465. Sakugawa, H. and Kaplan, 1. R. (1997) Radio and stable-isotope measurements of atmospheric carbon monoxide in Los Angeles. Geochem. J. 31, 75-83. Stevens, C. M. and Engelkemeir, A. (1988) Stable carbon isotopic composition of Methane from some natural and anthropogenic sources. J. Geophys. Res. 93, 725-733. Stevens, C. M. and Wagner, A. F. (1989) The role of isotopic fractionation effects in atmospheric chemis try. Z. Naturforsch. 44a, 376-384. Stevens, C. M., Krout, L., Walling, D., Venters, A., Engelkemeir, A. and Ross, L. E. (1972) The isotopic composition of atmospheric carbon monoxide Earth Planet. Sci. Lett. 16, 147-165.