MEASURING BANK EFFICIENCY IN DEVELOPING COUNTRIES: THE CASE OF WAEMU (WEST AFRICAN ECONOMIC MONETARY UNION)
BY
Sandrine Kablan
[email protected]
Abstract This paper offers to measure WAEMU banks efficiency and its determining factors, after the banking system reforms from 1993 to 1996. At this purpose, we use Data Envelopment Analysis method (DEA) for assessing technical efficiency and Stochastic Frontier Analysis (SFA) for cost efficiency. Our results suggest similar evolutions for the two types of efficiency for every WAEMU countries apart from Ivory Coast and Burkina Faso. A detailed analysis per banking shareholder’s equity group reveals that local private banks are the most efficient ones, followed by foreign and then state owned banks. Despite technological changes that occurred in the banking system, Malmquist index shows that the increase of technical efficiency is much more the fact of scale efficiency change than that of the incorporation of technological innovations. Lastly, we found that WAEMU banks efficiency is sensitive to variables like financial soundness, the ratio of bad loans per country, the banking concentration and the GDP per capita.
African Economic Research Consortium May 2007
1
TABLE OF CONTENTS
INTRODUCTION: ............................................................................................................................................... 3 I) WAEMU BANKING SYSTEM ........................................................................................................................... 4 I-1) The evolution of the banking system: ...................................................................................................... 4 I.2- WAEMU banking system characteristics ................................................................................................ 5 II) LITERATURE REVIEW : .................................................................................................................................... 8 II.1) The nonparametric approach: ............................................................................................................... 8 II.2) The parametric approach: ..................................................................................................................... 9 III) METHODOLOGY: ......................................................................................................................................... 10 III-1) DEA Method: ..................................................................................................................................... 10 III-2) Stochastic Frontier Analysis: ............................................................................................................. 12 III-3) Data: .................................................................................................................................................. 13 III.4) results: ................................................................................................................................................ 14 III-4-1) Technical efficiency scores.......................................................................................................................... 14 III-4-2) cost efficiency scores ................................................................................................................................... 16 III-4-3) Determinants of efficiency .......................................................................................................................... 19 a) Endogenous factors impacting efficiency: ...................................................................................................... 19 b) Exogenous factors: .......................................................................................................................................... 19
CONCLUSION.................................................................................................................................................... 22 APPENDICES ..................................................................................................................................................... 23 REFERENCES .................................................................................................................................................... 27
2
Introduction: The financial sector has an important role to play in the economic development process. Financial institutions are the main intermediation channels between saving and investment in a country. The best financial systems limit, quantify, gather and negotiate all operation risks, and incite the savers to invest, by offering them a proportional payment to the scale of the incurred risks. While efficient, financial intermediaries allow mobilizing saving from diverse sources and allocate it to more productive activities, what benefits not only investors and beneficiaries of the investments but also the whole economy (Gulde, Patillo et Christensen, 2006). Indeed, a banking system which efficiently channels financial resources to productive use is a powerful mechanism for economic growth (Levine 1997). In Subsaharan Africa, bank are the main financial intermediaries. Therefore, restructuring policies have been led in order to improve their efficiency. Especially for the WAEMU zone since its creation, monetary policy purpose was to favour main sectors which were supposed to lead the economic growth, with preferential interest rates. However, this policy didn’t give the expected results; on the contrary it caused the banking crisis at the end of the 80s and the beginning of the 90s. During this period, there were about 27 banks failures (Powo Fosso, 2000). In order to solve problems of banks insolvency and profitability, reforms and restructuring measures were taken by the monetary authority. The end of loans quantitative control, the creation of an organism for banking surveillance and regulation: WAMU Banking Commission (La Commission Bancaire de l’UMOA) and interest rates liberalization. Those reforms were set up for improving efficiency in financial resources mobilisation and allowance. Indeed, bank efficiency has raised much interest those last years. Most of them were done, after important changes or restructuring measures periods in banking systems (Allen et Rai, 1996; Leigthner and Lovell, 1998 and Grigorian and Manole, 2000). At the African level, Peris and Hauner, 2005 measured the efficiency of Ugandan banks to ascertain the effect of the restructuring of the banking system. Similarly, Kirkpatrick, Murinde and Tefula, 2007, conducting a study on African Anglophone banks after the period of banking crises (late 80's and early 90 years) to work out possible solutions for managers of banks in Africa, but also regulators and supervisors. Efficiency measurement determines how banks provide an optimal combination of financial services with a set of inputs. On the one hand, one is asking oneself bank capability to efficiently and technically produce, financial services for economic agents. On the other hand, banks as financial companies look for profitability. Therefore, they are constrained from achieving maximum profit, due to regulatory restrictions (minimum reserve, capital adequacy requirements, etc). Their management has substantial control on the cost of inputs, whereas the output side is beyond their control (Worthington, 1998). So our study aims at assessing both technical and cost efficiency, in order to identify the suitable policies for increasing banks efficiency, so that they will be able to fully play their role of financial intermediary in the WAEMU zone. Our results suggest that WAEMU banks are efficient as far as they are acting as deposits bank providing short term loans to enterprises. Scale economy plays an important role in improving technical efficiency. Financial soundness and legal environment are also important factors. Our study is organised in three parts. First, we present WAEMU zone while insisting on changes of the banking system and its characteristics. Second, we make a theoretical and
3
empirical literature review on the methods of efficiency measurement. Lastly, we estimate and analyze banks efficiency scores and their determinants in the WAEMU countries. I) WAEMU Banking system I-1) The evolution of the banking system: 90s were for Sub-Saharan African countries, years of financial distresses for the WAEMU countries. Interest rate control policy as well as the intervention of governments in the management of state owned banks introduced a bias in economic criteria for credit distribution. For example, a productive project in a non prioritary sector could not find funds for financing, while a non productive project in a prioritary sector could be financed. In those conditions, market mechanisms which should play a regulatory role through the interest rate equilibrium, by allowing good financial resources allowance within the economy, could not be effective. After the crisis, monetary authorities restructured the banking system of the WAEMU. Failures banks were liquidated or privatized. In the later case, banks ownership was opened to foreign and domestic investors. In addition, a sub-regional regulatory institution was created in 1990: the WAMU Banking Commission. It ensures the supervision of banks activities, and the respect of the banking regulation. Beside that measure, the Central Bank changes the monetary policy, in 1993. It substitutes the administrative method of monetary regulation by market mechanisms, which are more flexible. These changes intervened at three levels: the refitting of the grid of the directing rates, the establishment of a renovated money market, and the liberalization of banks conditions, which results in the suppression of several directing rates floors and the removal of the upper limit of banks debtor conditions. The liberalization of banks conditions would have been implemented for reinforcing the mobilization of domestic resources and their optimal allowance for financing the economy. This measure is supposed to give credit institutions a greater room for manoeuvre in the determination of their costs and their prices. It would also lead to a better competition within the banking system through a greater transparency in the invoicing of the banking services costs. Brownbridge and Harvey (1998) 1 found evidences according to which the liberalization of 1990 would have led to a more vigorous competition among African banks with regard to the deposits and the distribution of the other services. However, it is not sure that liberalization improved the efficiency of loans distribution in the presence of important distortions in the other economic sectors. Considering this reforms context, we are investigating in this study the level and the determining factors of bank performance in the WAEMU zone. In order to better answer this question, we will first examine the characteristics of the banking system.
Brownbridge M and Harvey C, 1998 “Banking in Africa: The impact of financial sector reform since independence (Trenton, New Jersey : Africa World Press”.
1
4
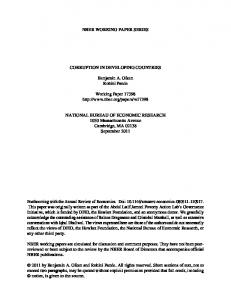
I.2- WAEMU banking system characteristics There are actually 90 credit institutions formally approved in WAEMU: 70 banks and 20 financial institutions 2 . Countries which present the larger number of banks are Ivory Coast (16) and Senegal (10). The WAEMU banking system is concentrated, indeed 19 banks are large ones and hold the major market share in the zone: 62,7%; 24 are of medium size with a 27,6% share while the 9,7% residual share is held by the 27 small banks. WAEMU banks as financial intermediaries collect resources with economic agents who have financial excess and carry out loans to those who need financing. Therefore, they propose financial products such as loans, deposits and securities. The financial intermediation of WAEMU countries evolved as shown in graph 1. The degree of economy monetization, represented by the ratio of M2 to the GDP remains constant around 25% between 1990 and 1994, then decrease until 1998 to 21%, for then finding its initial level in 2003. It is lower than the average degree in Sub-Saharan Africa which is approximately 29% over the period 90-03 3 . In the same way the ratio of credit to private sector to GDP, strongly decrease from 25% to 15% between 1990 and 1994, for then stabilizing itself 4 . A more detailed analysis of the banking products (graph 2) reveals a balance sheet structure dominated by deposits and loans which respectively account for 72,74% and 58% of average banks total assets. Securities share a very small proportion of the total assets (approximately 7,7% on average) over all the studied period. Graph 1: Financial intermediation evolution in WAEMU
30
25
20
15
10
5
0 1990
1991
1992
1993
1994
1995
1996
1997
1998
1999
2000
2001
2002
2003
lo a n s t o p riva t e s e c t o r/ G D P M 2 /G D P
Source : Global Development Indicators and World Development Indicators. Rapport de la commission bancaire de l’UMOA, 2004. Author calculations, Source: Global Development Indicators and World Development Indicators. 4 Analysing the evolution of M2, credit to the private sector and GDP, we found that the first two variables increase during the period, but less quickly than the third one. This confirms the idea of a decreasing of the economy monetization and the financing of the economic activity by loans, the 1990-1994 period, corresponding to a restructuring period after the banking crisis. 2 3
5
Graph 2: WAEMU banking products evolution from 1996 to 2004
90,00 80,00 70,00 60,00 50,00 40,00 30,00 20,00 10,00 0,00
Loans deposits securities
1996 1997 1998 1999 2000 2001 2002 2003 2004
Source : « Bilans des banques et établissements financiers de l’UMOA » and author calculations
The proportions of these products per country are ranged in the same sections for loans and deposits, however one can observe a greater dispersion with securities: 0,06% for the minimum in Ivory Coast and 13% for the maximum in Togo (table 3). Banks credit from 1996 to 2004 is as followed: 5% for primary sector, 22% for industries and 73% for services and trade. Therefore, one can notice that banks of the zone primarily intervene like deposit banks accompanying enterprises (above all services and trade sector) in their treasury loans, but more rarely in investment loans or long financing. As graph 3 testifies it, after the devaluation, banks become on-liquid but remain reluctant in distributing long terms loans to small and medium enterprises. Indeed, short-term loans represent more than twice of the medium and long term loans (approximately 70% of the total of loans granted by banks). Table 3: Level of the principal balance sheet items expressed as a percentage of total assets of WAEMU banks in 2004.
Countries Loans Deposits Securities Bénin 54,53 77,64 7,24 Burkina Faso 58,45 78,67 9,48 Côte d'Ivoire 57,42 76,72 0,06 Mali 59,63 71,09 1,57 Niger 50,57 76,80 3,78 Sénégal 54,85 78,65 12,86 Togo 52,24 75,08 13,00 UMOA 59,59 76,26 6,64 Source : « Bilan des banques et établissements financiers de l’UMOA »
6
Graph 3 : Evolution of Short, Medium and Long term loans in WAEMU FCFA 3000000 2500000 2000000 1500000 1000000 500000 0 1996
1997
1998
1999
2000
2001
2002
2003
2004
Medium and long term loans Short term loans Source : Rapport de la commission bancaire de l’UMOA
90s have been for WAEMU banks years of technological changes, with the appearing and the diffusion of New Technology of Information and Communication (NTIC). Within the zone those technological changes are late to become effective, in comparison with other SubSaharan African Anglophone Countries. The subsidiaries of foreign banks are the first ones to improve financial service distribution by using those technological changes with computers, cash dispenser, providing banking cards and telematics. In addition, the creation of the banking accounting plan “plan comptable bancaire” in 1996, will force banks to use computer in their activities. Besides those technological changes, we observe a qualitative improvement of human capital used by banks. Indeed, the share of qualified staff increased from 22,5% in 1990, to 28% in 1996 and 36,6% in 2004; what can be viewed as an increase of 61,8% between those two late dates. The number of branches has increased from 394 in 1996 to 523 in 2004. This rise is due besides the addition of new created banks branches, to the raise of the number of old banks branches in Benin, Burkina Faso, Mali, Niger and Senegal; that number having decreased or stayed steady respectively in Ivory cost and Togo. Bank management has evolved as shown by the return on equity ratio, the net exploitation coefficient and the raw rate of customers portfolio deterioration. The first one representing the ratio of net profit for the year to shareholders’ equity, decreased from 30 to 13% from 1996 to 2004, showing a depreciation of banks profitability. On the contrary, the net exploitation coefficient increase (from 59,6% to 66,2%) indicating an improvement of the financing of operating and depreciations expenses, by the value added created by banks. The raw rate of customers portfolio deterioration evolves in an almost steady way from 21,5% to 18,7%.
7
Graph 4: Evolution of banks management characteristic ratio from 1996 to 2004.
80 70 60 50 40 30 20 10 0
Raw rate of customer portfolio deterioration Net coefficient of exploitation Return on equity ratio
1996
1997
1998
1999
2000
2001
2002
2003
2004
Source: Rapport de la commission bancaire de l’UMOA.
Knowing the characteristics of WAEMU banks, we turn now to the efficiency measurement concept, while reviewing the various theoretical and empirical studies on the subject. II) Literature review : The idea of efficiency of a production unit was first introduced by Farell (1957), under the concept of “input oriented measure”. According to Farell, a technical efficiency measure is defined by one minus the maximum equiproportionate reduction in all inputs that still allows continuous production of given outputs. Technical efficiency is linked to the possibility of avoiding wasting by producing as much outputs as the use of input allows it (output oriented measure), or by using as less as input that the production objective plans it (input oriented measure). This efficiency is measured by comparing observed and optimal values of production, costs, revenue, profit or all that the production system can follow as objective and which is under appropriate quantities and prices constraints. Therefore, we can analyse technical efficiency, in terms of deviation compared with an idealistic production frontier isoquant. The literature proposes two approaches for measuring frontier production: the mathematical programming approach (non parametric) and the econometric one (parametric). II.1) The nonparametric approach: The mathematical approach known under the name of DEA method (Data Envelopment Analysis) consists in estimating the frontier by using non parametric mathematical linear programming. It offers an analysis based on the relative evaluation of the efficiency in an input/output multiple situation, by taking into account each bank and measuring its relative efficiency to an envelopment surface made up with the best banks. However, this method doesn’t allow for noise treatments. The non parametric method was usually used by making
8
the assumption of constant return to scale (CRS). But recently, the assumption of variable return to scale (VRS) was used in specifications because this hypothesis is more relevant with the environment of imperfect competition in which banks operate. This assumption is therefore made by Grigorian and Manole (2002), to evaluate the efficiency of transition countries banks from Eastern Europe, following the technological changes which occurred in the banking industry and the banking system reforms after financial liberalization. Leigthner and Lovell (1998) are also interested in the impact of financial liberalization on Thai banks efficiency. They lead an analysis based on the one hand, on profit objective of the Thai banks and on the other hand, on the economic growth objective of the Bank of Thailand. Their results show that under appropriate conditions, financial liberalization can lead to growth, whatever the analytical objective is. Moreover, the size and the nature (domestic or foreign) of banks affect the productivity, growth and productivity change measures. In the same way, Berg, Forsund, Hjalmarsson, Suominen (1993), study the productivity of banks in Nordic European Countries (Finland, Sweden and Norway) vis-a-vis increasing financial integration and banks internationalization due to Europe integration. It comes out from their study, that the Swedish banks are the best ones to face financial European integration and banks internationalization. Other studies analyse banks efficiency, by using the parametric approach. II.2) The parametric approach: The econometric approach consists of an econometric estimate of the best practice frontier by its specification in a Cobb-Douglas, CES or translogarithmic (cost or production) function. The econometric method can be deterministic. In this case, every deviation from the frontier is attributed to inefficiency. It can also be stochastic; it is then possible to separate random errors from the production unit inefficiency. The stochastic frontier method has two principal advantages compared to non-parametric DEA method. First, it allows separating random error from the production unit inefficiency and takes into account the existence of exogenous shocks. At this purpose, the error term is divided into two components: an inefficiency component and a random one (wich is composed of the error measurement and the exogenous shocks). Second, the stochastic frontier analysis is less sensitive to absurd values. English, Grosskopf, Hayes and Yaisawarng (1993), using a distance function with a translogarithmic form found that on average US banks were inefficient after mergers and consolidations of the US banking system in the 90s. Allen and Rai (1996) in an international banks comparison use the stochastic frontier analysis (SFA) and the Distribution Free Approach (DFA) 5 and show that the inefficiency level displayed by universal banks is smaller than that of separate activities banks. Then in a second step, the authors analyse the determining factors of efficiency. However, they don’t take into account environmental variables in the explanation of efficiency. It is this caveat that Lozano-Vivas and Dietsch (2000) depicted, in their study comparing French and Spanish banks. They make a comparison of Spanish and French banks, integrating in the cost frontier countries environmental specificities. This approach employs the average residuals of the cost function estimated with panel data to construct a measure of cost X-efficiency. 5
9
Regarding African studies on the issue, Peris and Hauner, 2005 make an analysis of Ugandan banks efficiency after the restructuring period using the DEA method. They show that, the improvement of the competitiveness of Ugandan banks after the reforms period could be linked to that efficiency. More specifically this increased competitiveness leads to en improvement of largest and foreign banks efficiency, unlike smaller banks which have become less efficient. Kirkpatrick, Murinde and Tefula, 2007 will examine the efficiency of Anglophone African banks after the period of banking crises (1992-1999). They use the stochastic frontier approach with cost and profit functions, then as a second step they explained these cost efficiencies and profits found by banks specific factors and relevant macroeconomic variables. They find that profit X-inefficiency is slightly higher than cost Xinefficient. The latter is exacerbated by the presence of non-performing loans, higher capital ratios and financial liberalisation. Conversely, it is apparent that the largest banks are most efficient and the level of penetration of foreign banks reduced X-inefficiency. In our study, we propose to make an analysis of WAEMU banks efficiency, after banking reforms implemented by BCEAO. The studies evoked above will be used as a basis of reflexion to find suitable methods for efficiency measurement. III) Methodology: Our approach consists in using the two non-parametric and parametric methods of efficiency measurement. It is justified by the fact that the first will enable us to specifically be interested in the technical aspect of production in using efficient combination of inputs in order to produce a given output. And, the second one will lead us to measure bank efficiency with a cost objective. WAEMU banks, as any rational producer are especially carried towards the maximization of their profit and thus ceteris paribus the minimization of production costs. At this purpose, banks presenting high efficiency-cost scores will not necessarily be the most technical efficient ones. It is for explaining such a dichotomy, that we propose to measure the technical efficiency and the cost-efficiency of WAEMU banks. III-1) DEA Method: Technical efficiency analysis aims at answering the following question: Do production unit use as many inputs as the production of outputs requires it? Therefore, we first ask the following question: as financial intermediaries, what do banks in WAEMU countries produce? According to the financial intermediation approach 6 , banks are supposed simultaneously to offer liquid deposits without risk, and loans which are risky assets and less liquid. The principle of added value, stipulates that the elements which contribute to generate added value, are regarded as outputs. Thus even if the deposits collection costs a credit rate to bank; it saves the cost of the resources which should differently be collected on the money or financial market. In the same way, loans represent an output that bank offer to agents with financial needs like enterprises (small and medium, or large ones) as well as securities investment. Therefore, we find three principal activities for banking production: the activity of deposits collection, loans distribution and securities investment. To produce these outputs, 6
On the contrary with average variables of the production approach, banks are supposed to produce services of transaction and information. Therefore banking product is made up with accounts opened by the bank for managing deposits and loans.
10
banks use labour (qualified and unqualified), physical capital and financial capital. The linear mathematical program used to calculate scores efficiency under the assumption of CRS is as follow: Max u,v (u’yi/v’xi) , (1) St u’yj/v’xj≤1, j=1,2,…,N : number of associated constraints for solving the mathematical problem. u, v ≥ 0 With xi the vector of inputs matrix K*N of firm i and yi the vector of the output matrix M*N of firm I; and u’ and v’ are M*1 et K*1 vectors of input and output weights respectively. To avoid an infinite number of solutions, the constraint v’xi =1 is imposed which provides: Max u,v (u’yi) , (2) St u’yj - v’xj ≤ 0, j=1,2,…,N u, v ≥ 0 Because solving the problem on this form will be difficult, one can use the duality in linear programming, and derive an equivalent form of this problem: Min өλ ө, (3) Sc – yi + Yλ ≥ 0, өxi –Xλ ≥ 0, λ ≥ 0, Where Y is a vector of all outputs of every firms and X is the vector of all inputs of every firms; ө is a scalar and λ is a N*1vector of constants. The value of ө obtained will be the efficiency score for the i-th firm. To take into account changes in scale economies, the convexity constraint N1’ λ = 1 can be added for giving the following program: (4) Min өλ ө, St – yi + Yλ ≥ 0, өxi –Xλ ≥ 0, N1’λ = 1 λ ≥ 0, Where N1 is a N*1vector of 1. Following, Berg, Forsund, Hjalmarsson and Suominen (1992), we will estimate technical efficiency under those two assumptions of CRS and VRS 7 . The empirical estimated model will be: (loans, deposits) = f (labour, physical capital, financial capital). In addition the use of panel data allows the calculation of the Malmquist index using the distance function: Mo(ys, xs, yt, xt) = [dos(yt,xt) dot(yt,xt)]1/2 / [dos(ys,xs) dot(ys,xs)]1/2
(5)
The VRS assumption is adapted to the environment in which banks evolves, and thus makes it possible to have scores robust to misspecification, while the CRS assumption allows to compare the largest banks with smallest ones and prevent the first ones to appear artificially efficient.
7
11
It represents the productivity at the production point (yt, xt) relative to the point (ys, xs). A value higher than 1 means a positive growth of the total factors productivity between the periods s and t. An equivalent way to write this productivity index is: Mo(ys, xs, yt, xt) = [dot(yt,xt) / dos(ys,xs)]* [(dos(yt,xt)/ dot(yt,xt))*(dos(ys,xs) / dot(ys,xs))]1/2 (6) The second factor between square brackets is the geometric mean of measurements of the displacement of the frontier compared to the same individual, observed at period t (first ratio), then at period s (second ratio). This term between square brackets measures technological change i.e. the displacement of the frontier between the two appointed dates. The first factor measures the change of Farell technical efficiency level between periods s and t. It is the equivalent of Farell technical efficiency ratio at period t on this same efficiency at period s, under the assumption of CRS (EFTcrs). It has two components; one meaning pure inefficiency, and the other one scale efficiency. The index of pure efficiency is obtained by recomputing efficiency indices on the same data under the assumption of VRS (EFTvrs). The index of scale efficiency (EFE) is the ratio of efficiency under the assumption of CRS to efficiency under the assumption of VRS (EFE = EFTcrs/EFTvrs). We will use the Malmquist index and its components in order to explain and understand the evolution of technical efficiency during the studied period. III-2) Stochastic Frontier Analysis: The question that we are addressing here is: what is the optimal combination of inputs which makes it possible to produce an optimal combination of outputs while minimizing production costs? To allow the comparison of the two methods results, we will use the same inputs and outputs that those used for DEA. Given the multiplicity of bank functions we will choose a translogarithmic function model which seems to be adapted to the multi-criteria character of banks efficiency. Indeed, this functional form makes it possible to take into account the multiple complementarities links between explanatory factors and it does not impose any restriction. Moreover, panel data with random errors will allow us to mitigate the weakness of available quantity on banks level data. In this model, the statistical noises vary through the banks and time, just as inefficiency (Battese and Coelli, 1992). We will apply to this model the method of the maximum likelihood for the estimate of the parameters with the current assumption of a normal truncated distribution for the inefficiency term. We also consider that banking technology is the same all around WAEMU. Indeed, most of the banks are subsidiaries of French banking groups. In addition, these banks operate in the same sub-region of Western Africa and recruit banking workers who were trained according to French standards. The cost function thus arises in the following way: Ln CT= α0+∑iαi lnpi +∑j ßjlnyj +1/2∑i∑kαik lnpi lnpk +1/2∑h∑jßhj lnyh lnyj +∑i∑j δij lnpi lnyj + vit-uit (7) with: pi : the inputs price vector yj : the ouputs value vector vit: is a statistical noise with the independent normal distribution N(0, σv2), uit: is the positive inefficiency term and is assumed to be distributed independently of vit.
12
The likelihood function is written in the following way: Ln L = N/2 ln(2/π)- Nlnσ – 1/2σ2Σ εi2 + Σln [φ(εiλ/σ)],
(8)
Cost efficiency scores are calculated with the following equation: (9) E(ui/ε) = [σλ/(1+λ2)] [φ(εiλ/σ)/ ψ (εiλ/σ) + εiλ/σ] 2 2 where εi = vi-ui, σ = (σu + σv ), λ = σu/σv, φ is the standard normal density function and ψ is the standard normal cumulative distribution. III-3) Data: Among the 48 banks 8 which operate in the zone over the period 1996-2004, we selected 35 according to data availability 9 . Therefore, our sample will not respect the proportions per country of the original population. Among these banks, some are not observed over all the considered period. Our sample represents 82% of the total share of assets. We used for the stochastic frontier estimate Bankscope data base for banks balance sheets and income statements. However for DEA method, because of missing data for certain banks, we rather used “ Bilan des banques et établissements financiers de l’UMOA” which contains exhaustive series on banks balance sheets 10 . Data on banks number of employees and the foreign shareholders in the equity capital are extracted from “Rapport Annuel de la Commission bancaire - UMOA”. Social and economic data come from the World Bank data bases “World Development Indicators” and Global Development Finance. The average variables values are presented in tables 4 and 5. Table 4: Average value of variables used for the estimate of cost frontier efficiency
Variables Total Assets Deposits Loans Total Costs PK PL PF
Bénin 83605,57 79064,33 55976,07 5415,31 0,29 8,22 0,07
Burkina Faso 84975,85 73056,72 51960,54 5846,92 0,33 6,82 0,06
Côte d'Ivoire 156651,04 147896,31 140324,97 13389,34 0,23 11,40 0,08
Mali 104307,84 84717,02 72439,74 5508,89 0,17 8,08 0,09
Sénégal 128683,70 110341,42 93010,80 8483,78 0,31 9,75 0,07
Togo 47929,55 39596,01 28049,64 3854,55 0,23 7,55 0,09
WAEMU 101025,59 89111,97 73626,96 7083,13 0,26 8,64 0,08
Total costs = interests payable, operating expenses and depreciation expenses out of total assets Deposits = amounts owed to credit institution and to customers out of total assets Loans = loans and advances to credit institutions and to customers out of total assets PK= (depreciation expenses and provisions for assets)/(tangible and intangible assets) PL = (personnel expenses)/average number of workers per year PF = interest payable and similar charges with credit institutions and customers/borrowed capital
Tableau 5 : Average value of variables used for the estimate DEA efficiency 8
This number doesn’t take into account new created banks and banks which cease their activities after 1996. Because of data availability banks of Niger won’t be taken into account in our sample. 10 Variables used in the parametric and non parametric methods are calculated by the same way. 9
13
Variables Deposits Loans Titres KP KF Lc Le
Bénin 74461,09 62613,36 13019,42 2072,84 1531,11 37,18 112,60
Burkina Faso 71200,75 56557,67 15711,19 3542,31 3171,17 88,44 164,47
Côte d'Ivoire 132765,21 126087,14 2991,20 4296,91 10390,73 101,74 238,23
Mali 89782,67 83052,92 1692,81 3748,00 5261,36 97,39 99,06
Sénégal 96623,21 84075,79 16645,44 3195,17 1420,72 37,99 154,69
Togo 41780,96 38601,16 2601,36 3062,56 682,62 65,44 117,44
WAEMU 84435,65 75164,67 8776,90 3319,63 3742,95 71,36 147,75
Deposits = amounts owed to credit institution and to customers Loans = loans and advances to credit institutions and to customers KP = tangible assets KF = financial assets L = average number of workers per year The variables values in the two tables are in million of CFA Francs, except PK and PF where they represent ratios, and also L.
III.4) results: III-4-1) Technical efficiency scores Tables 6.1 and 6.2, give results of efficiency scores estimated according to the DEA method respectively under the assumption of CRS and VRS. Scores efficiency are obtained by calculating the average score for each country. The average efficiency score over all the period is 0,76 with CRS and 0,85 with VRS. These scores are inferior to those found by Peiris and Hauner, 2005 for Uganda (0,99) but superior to the degree of thai banks found by Leigthner and Lovell, 1998 (0,62 and 0,59). There is heterogeneity of the level of efficiency across countries. Indeed, Togo presents the smallest efficiency degree (0,55 with CRS and 0,60 with VRS) and Senegal displays the highest ones (0,83 and 0,95 respectively in CRS and VRS). The evolution of technical efficiency scores by country (under CRS and VRS assumptions) over the considered period reveals that Benin, Mali and Senegal have an increasing tendency, while Ivory Coast and Burkina Faso have decreasing ones. The special case of Togo, decreasing tendency from 1996 to 2001 and increasing after is due to the raise of the investment securities at the end of the period, while the inputs levels remained steady. Therefore, Togolese banks were more efficient in producing that specific asset with almost the same level of inputs than the anterior years. However, the zone whole efficiency degree has a slight increasing tendency for the CRS and decreasing one for the VRS (cf appendix 1). A more detailed analysis, of efficiency degrees per banks groups (state owned, local private and foreign) shows that local private banks are the most efficient ones with an average efficiency of 0,85 and 0,92 respectively under CRS and VRS, followed by foreign banks with 0,72 (CRS) and 0,83 (VRS). State owned banks score the lowest efficiency degrees: 0,56 (CRS) and 0,64 (VRS) (cf appendix 2). Concerning network banks, efficiency evolution is generally homogenic apart from BOA and BNP networks, where one can observe heterogeneity across the countries where the subsidiaries are settled down, as shown in appendix 3.
14
Table 6: WAEMU banks technical efficiency scores estimated with DEA 6.1) Constant Return to Scale Assumption
Years 1996 1997 1998 1999 2000 2001 2002 2003 2004 Average value for the period
Bénin 0,74 0,81 0,83 0,84 0,67 0,78 0,85 0,85 0,84
Burkina Faso 0,76 0,78 0,67 0,78 0,68 0,68 0,55 0,48 0,54
Côte d'Ivoire 0,79 0,72 0,80 0,73 0,67 0,69 0,66 0,69 0,70
Mali 0,69 0,63 0,75 0,75 0,73 0,78 0,78 0,79 0,84
Sénégal 0,55 0,76 0,78 0,97 0,92 0,82 0,83 0,98 0,94
Togo 0,59 0,61 0,57 0,49 0,43 0,47 0,44 0,54 0,89
WAEMU 0,74 0,77 0,78 0,80 0,73 0,75 0,73 0,76 0,81
0,80
0,65
0,72
0,75
0,83
0,55
0,76
6.2) Variable Return to Scale Assumption Years 1996 1997 1998 1999 2000 2001 2002 2003 2004
Bénin 0,74 0,82 0,83 0,85 0,75 0,83 0,93 0,96 0,92
Burkina Faso 0,84 0,88 0,68 0,81 0,76 0,80 0,58 0,53 0,56
Côte d'Ivoire 0,93 0,97 0,98 0,92 0,91 0,85 0,84 0,82 0,84
Mali 0,81 0,79 0,76 0,77 0,77 0,81 0,83 0,79 0,87
Sénégal 0,81 0,94 0,95 0,98 0,94 0,95 0,99 1,00 0,97
Togo 0,70 0,64 0,62 0,51 0,48 0,49 0,52 0,63 0,95
WAEMU 0,85 0,89 0,86 0,86 0,82 0,83 0,83 0,83 0,87
Average value for the period
0,84
0,70
0,89
0,80
0,95
0,60
0,85
Table 7 describes the Malmquist index and its components. Global technical efficiency change is equal to 1,5% for the whole zone during the studied period. This growth is the fact of scale efficiency change which is equal to 1%, and pure technical efficiency (technical efficiency under the assumption of VRS) which increased of 0,4% over the period. What implies that WAEMU banks (except in Ivory Coast and Benin) knew to exploit the scale change which occurred during the period, while the rise of pure technical efficiency is due to banks of Mali, Senegal, Togo and Benin. Total factors productivity growth was around 1,4% over the period. That is the fact of global technical efficiency increase rather than the incorporation by banks of technological changes. Indeed, the latter decreased of 0,4% from 1996 to 2004, drop due to countries such as Benin, Burkina Faso and Ivory Coast.
15
Table 7: Average growth rate of total factors productivity (Malmquist index) and its components from 1996 to 2004.
Countries Bénin Burkina Faso Côte d'Ivoire Mali Sénégal Togo WAEMU
Total Technical Efficiency Change 1,017 0,958 0,985 1,026 1,055 1,053 1,015
Technological Change 0,965 0,983 0,988 1,010 1,026 1,005 0,996
Pure Technical Efficiency Change 1,028 0,950 0,987 1,009 1,018 1,039 1,004
Scale Efficiency Change 0,989 1,009 0,999 1,017 1,036 1,013 1,010
Total Factor Productivity Change 0,981 0,942 0,978 1,036 1,082 1,073 1,014
III-4-2) cost efficiency scores Considering that these banks are of different sizes, it may appear some heteroskedasticity leading to rank banks bias in scores efficiency. We propose to address this issue in future researches. We first tried to estimate the cost frontier in one step as in Battese and Coelli 1996, but we weren’t able to conclude for the existence of the cost frontier. Because of that, we finally proceed in two steps. Estimate of the stochastic cost frontier function is presented in table 9. The parameter γ = σu2/(σu2 + σv2) is significantly different from zero. This result enables us to reject the assumption according to which, the variance of the efficiency term σu2 is null 11 . Consequently, the uit term can not be isolated from the regression, the cost frontier does exist and the estimate of the parameters by Ordinary Least Squares is inadequate. The estimated values of the cost function parameters enable us to calculate the gap of each observation compared to the frontier of best practices. As underlined above, this gap is divided into two terms: ui characterizes banks inefficiency, vi represents the term of random error. Calculated inefficiency degrees, according to the Battese and Coelli methodology, vary between 0 and the infinite. Therefore, efficiency scores are measured by its reverse which varies between zero and one. Table 9 presents the annual average banks efficiency for our studied sample from 1996 to 2004, across country. The average cost efficiency score in WAEMU is 0,67; this result is closed to that found by Chaffai (1993 and 1997) for Tunisian banks which was about 0,66. However it’s inferior to 0,80 found by Kirkpatrick, Murinde and Tefula (2007) for anglophones african banks. Cost efficiency of WAEMU countries increases at different speeds, apart from Togo, where it is steady. Thus, the extreme efficiency scores are displayed by the Malian banks for the maximum (0,76) and Burkina Faso banks for the minimum (0,56). However, the increase in the efficiency scores for all countries is reflected on the level of WAEMU average cost-efficiency which slightly grows up from 0,67 in 1996 to 0,70 in 2004.
Indeed, the stochastic frontier does exist when γ is significantly different from 0, ie when σu is different from 0: therefore the share of the error term which depends on inefficiency does exist and we can consider a best practices frontier. 11
16
Table 8: Estimated parameters of the translogarithmic cost function
Variables
Parameters
constant
α0
Y1
α1
Y2
α2
Y3
α3
PK
β1
PL
β2
Y1Y1
α11
Y1Y2
α12
Y1Y3
α13
Y2Y2
α22
Y2Y3
α23
Y3Y3
α33
PKPK
β11
PKPL
β12
PLPL
β22
Y1Pk
δ11
Y1PL
δ12
Y2Pk
δ21
Y2PL
δ22
Y3PK
δ31
Y3PL
δ32
lnσ2 =ln(σu2 + σv2) 2
2
γ = σu / (σu +
σv2)
Number of observations Log-likelihood ***, **, * significant at the 1%, 5%, and 10%levels
Coefficient
Standard Deviation
0,2690 *** 5,1821 ***-3,7795 *-0,5452 0,1791 -0,2957 ***-2,1611 *** 3,0719 *** 0,4539 ***-1,0265 ***-0,3596 -0,0127 -0,0255 **-0,1519 0,0085 ***-0,4733 0,2310 *** 0,4218 -0,1597 *** 0,1209 0,0029
2,4636 1,7004 1,3320 0,3041 0,3779 0,5878 0,5667 0,8499 0,1743 0,3383 0,1301 0,0195 0,0329 0,0726 0,0787 0,1100 0,1712 0,0803 0,1331 0,0249 0,0356
***-2,8611 ** 1,0173
0,3257 0,4623 234 109,28
This result could be explained by the drop of total costs due at the same time to a decrease in the directing interest rates and the banking restructuring gradually implemented by BCEAO since 1993 and which has been effective since 1996. Indeed, the drop of loans administration and banks conditions liberalization process encouraged by BCEAO, supported a better competition within the banking system. This could have allowed banks by extending their market share, to use scale economies in order to increase their efficiency, as suggested by the Malmquist index evolution.
17
Table 9: WAEMU banks cost efficiency scores
Years 1996 1997 1998 1999 2000 2001 2002 2003 2004
Bénin 0,68 0,68 0,68 0,69 0,70 0,71 0,73 0,74 0,74
Burkina Faso 0,57 0,51 0,52 0,53 0,57 0,58 0,58 0,59 0,60
Côte d'Ivoire 0,62 0,63 0,67 0,67 0,70 0,69 0,65 0,64 0,65
Mali 0,73 0,75 0,73 0,74 0,76 0,76 0,77 0,79 0,79
Sénégal 0,73 0,69 0,69 0,70 0,73 0,74 0,76 0,76 0,77
Togo 0,63 0,59 0,60 0,58 0,60 0,60 0,60 0,61 0,62
UMOA 0,67 0,65 0,65 0,66 0,68 0,68 0,69 0,69 0,70
Average value for the period
0,70
0,56
0,66
0,76
0,73
0,60
0,67
Analysing cost efficiency according to banks ownership reveals an analogous result with that of technical efficiency. Indeed, local banks display the highest cost-efficiency scores (0,76) on average, followed by foreign banks (0,68), while state owned banks are the least cost-efficient ones (0,56). On the contrary, network banks cost efficiency scores are quite heterogenic, as shown in appendix 6. Only “Société Générale” network presents homogeneity in the cost efficiency evolution. This result testifies that network banks cost efficiency is sensitive to the environment of the country in which they evolve. A synthesis between cost and technical efficiency shows that they evolve with the same tendency in the following countries: Benin, Mali, Senegal and Togo. However, Ivory Coast and Burkina Faso present different tendencies. In the Burkina Faso case, the decrease of technical efficiency during the studied period is the fact of the total factor productivity (-6,8%) which results in the decrease of 4,2% of total technical efficiency and that of technological changes (-1,7%). Indeed, for Burkina Faso the decrease of pure technical efficiency of 5%, is not reversed by the gain in scale economies which are very low (0,9%). Again for Ivory Coast, we observe a decrease of total factor productivity of 2,2% which is the fact of total technical efficiency evolution (-1,5%) and some waste due to the lack of effective incorporation of technological changes (-1,2%). The decreasing of total technical efficiency coming from that of pure technical efficiency (-1,3%) and scale efficiency (0,1%). Our results need to be interpreted with caution, indeed banks assets used for estimating the cost function are heterogeneous and are not risk-adjusted. Among the three bank products used to estimate the cost frontier efficiency, credits are riskier than deposits and securities. Therefore, WAEMU banks seem to be technically efficient on average, considering the fact that they act as deposit banks mostly providing short term loans. Technical efficiencies differ from cost efficiencies. However, the difference between the two methods does not make it possible to make a direct comparison of these two efficiency measurements. Different efficiency degrees (while considering bank ranking) at the geographical level on the one hand and at the methodological level on the other hand, lead us to ask the question of the determinants of banks efficiency in WAEMU.
18
III-4-3) Determinants of efficiency Following Lozano-Vivas and Dietsch (2000), Allen and Rai (1996), and Grigorian and Manole (2000), we will explain banks scores efficiency with macroeconomic and environmental variables (exogenous variables) and variables linked to banks decision process (endogenous variables).
a) Endogenous factors impacting efficiency: These variables are decision variables specific to each bank; in other words, they can influence directly or indirectly their technological process 12 . They are: the ratio of stockholders' equity to total assets (CP), the ratio of economic profitability defined as net income out of total assets (RN), the share of loans granted to the customers in the total assets and the share of deposits of each bank in their total assets (DEP). For all these variables, the suggested coefficients are positive ones. Indeed, the use of internal funding generates cost savings; again better results can have a positive impact on banks efficiency. Finally, a stable base of deposits is expected to increase WAEMU banks efficiency, which as we saw it above act more like collecting deposits banks.
b) Exogenous factors: Most of them are variables which describe the principal environmental conditions in which banks operate. Indeed, the distribution of banking services in the areas with low population density (Dp) involves important costs and do not encourage banks to increase their level of efficiency. We also include the Herfindahl-Hirschmann Index, for taking into account the impact of market concentration on WAEMU banks efficiency. 13 If market concentration reflects the power of banks, it may increase costs for the industry in general through slacks and inefficiency. Conversely, if the market concentration reflects the selection of the market and consolidation across the survival of the most efficient banks, then concentration will be associated with low cost given that the market remains contestable. The income per capita (PIBt), affects many factors related to demand and banking services distribution (mainly deposits and loans). Countries with a higher income per capita have a banking system which operates in a mature environment, resulting in more competitive interest rates and profit margin. We will also integrate the share of stockholders’ equity held by the foreign investors (Kf) in the explanation of banks efficiency. Indeed, Azam, Biais and Dia (2004) in their study on the restructuring of WAEMU banking system after the crisis of 1990, show the link between this variable in period t and the performance of the banks at period t-1 (measured by the ratio of the net profit to total loans). Again, Grigorian and Manole (2000) in their study on the determining factors of commercial banks efficiency in transition countries, find that banks which are controlled by foreign head offices are generally more efficient. Bad loans tend to increase banks production costs as well as inefficiency in loans distribution. Indeed, facing an environment in which the share of bad loans is high, banks will be more reluctant in granting loans because of incurring loss. Therefore, we test whether the variable “badloans” is 12 13
Allen and Rai, 1996 Herfindahl-Hirschmann index is calculated as the sum of the market share squares of each bank.
19
significant in determining bank efficiency. It is calculated as the ratio of total bad loans in each country to the total loans. It catches the negative impact of problem loans that banks face in WAEMU countries. 14 Given the fact that, efficiency scores are ranged between 0 and 1, a double truncated Tobit model (appendice7) seems to be suitable to generate consistent estimates of regression coefficients. Therefore, we regress efficiency degrees, on the variables coded above with 0, when they are lower than the average over one year and 1 when they are higher than this average 15 . The results of the estimates are presented in table 11. Tableau 11 : Regression results of efficiency measures derived from the stochastic cost frontier and DEA method against endogenous and exogenous banks variables
Dependent Variable Constant RN CP DEP HH PIBt Badloans Dp Kf
Prob> chi2 Loglikelihood Number of observations
Costefficiency
Technical Efficiency (CRS)
Technical Efficiency (VRS)
***0,6581
***0,8691
***0,9072
(-0,0265)
(0,0794)
(0,0834)
-0,1357
0,0429
0,0401
(0,0131)
(0,0359)
(0,0395)
*0,0317
-0,0460
-0,0188
(0,0182)
(0,0498)
(0,0610)
0,0067
-0,0191
0,0045
(0,0173)
(0,0472)
(0,0518)
**0,0394
0,0348
0,0272
(0,0156)
(0,0385)
(0,0410)
***0,1314
*0,1162
***0,2743
(0,0199)
(0,0725)
(0,0767)
*-0,0265
**-0,0925
**-0,0982
(0,0140)
(0,0372)
(0,0414)
*-0,0245
**-0,0795
**-0,0943
(0,0133)
(0,0342)
(0,0533)
0,0244
0,0588
0,0377
(-0,0161)
(-0,0562)
(-0,0533)
0,00
0,01
0,00
144,17
-64,62
-71,90
260
260
260 ***, **, * significant at the 1%, 5%, and 10%levels
The income per capita (PIBt), the ratio of bad loans (badloans) and the population density are significant for the three regressions with the same respectively positive for the first one and 14
We use this variable instead of individual bad loans which were not available for each banks of our sample. However Kf is equal to one, when the share of stockholders capital held by foreigners is superior to 50% and 0 on the contrary.
15
20
negative for the two others. Those signs are consistent with the theory apart from the population density. Indeed, a high GDP per capita has a positive impact on cost and technical efficiency under CRS (i.e. when banks operate on an optimal scale) or VRS assumption (i.e. when one takes into account the environment of imperfect competition and the prudential rules that banks face). Again, the increase of the bad loans ratio of a country has a negative impact on banks efficiency. On the contrary, the non expected sign of the population density is explained by the fact that WAEMU banks do not integrate in their strategy for efficiency improvement the effect of population density. Concerning the other variables, they are not significant. However, for the cost-efficiency the ratio of stockholders' equity to total assets (CP) has a significant positive impact. This result was also found by Allen and Rai (1996) for small banks in separated banking countries, They explained this sign as the fact of the reduction of moral hazard agency costs. Herfindahl-Hirschmann index is significant, indicating the positive impact of banking concentration on banks cost-efficiency, which confirms the idea that WAEMU banks gain advantage of scale economies offered by this market structure.
21
Conclusion The estimated scores efficiency of WAEMU banks are on average equal to 0,67 for cost efficiency and 0,76 and 0,85 for technical efficiency under CRS and VRS respectively. Generally, estimated efficiency levels increase during the studied period apart from Ivory Coast, Burkina Faso, where we observe different evolutions of cost-efficiency and technical efficiency. A more detailed analysis (per banks group) reveals that local banks with private capital are the most efficient ones, followed by foreign banks subsidiaries, and lastly state owned banks which display the lowest cost and technical efficiency scores. The evolution of Malmquist index and its components during the studied period shows that WAEMU banks did not integrate technological changes during the studied period. Indeed, even if banks have imported those new technologies, they don’t contribute to the improvement of technical efficiency. Whereas technological changes allow banks in developed countries to increase in speed, quality and ease financial services access, the ratio of people owning a bank account (3,02%) in WAEMU countries and its implications gives to the incorporation of those innovations a non productive effect. Scale economies on the contrary play a more important role. Therefore, it would be interesting for the authorities to implement measures (for instance fostering the increase of the percentage of people with a bank account in WAEMU countries), in order to allow banks through scale economies to better incorporate technological changes. In this case, a multiplication of automatic cash dispensers for example would more significantly impact bank efficiency. Besides, strengthening the legal and judicial environment in which banks operate would allow them to better play their role of financing the economy. Indeed, the more confident would banks be in the local environment, the less reluctant they would be in loans distribution. Finally, it is important for the monetary authority to keep an eye on the financial health of banks, and especially on their return on equity.
22
Appendices Appendix 1 : Technical efficiency evolution under the assumptions of Constant Return to Scale (CRS) and Variable Return to scale(VRS).
Mali
Benin 1 0,9 0,8 0,7 0,6 0,5 0,4 0,3 0,2 0,1 0
1 0,9 0,8 0,7 0,6 0,5 0,4 0,3 0,2 0,1 0
CRS
VRS
19 96 19 97 19 98 19 99 20 00 20 00 1 20 02 20 03 20 04
VRS
CRS
1996 1997 1998 1999 2000 2001 2002 2003 2004
Togo
Sénégal 1 0,9
1,2 1 0,8
0,8 0,7
CRS
0,6
0,6 0,5 0,4
VRS
0,4 0,2
CRS VRS
0,3 0,2
0
19 96 19 97 19 98 19 99 20 00 20 00 1 20 02 20 03 20 04
0,1 0 1996 1997 1998 1999 2000 20001 2002 2003 2004
Burkina Faso
Côte d'Ivoire
1
1
0,9
0,9
0,8
0,8
0,7
0,7
0,6 0,5
0,6 0,5
CRS VRS
0,4
CRS VRS
0,4
0,3
0,3
0,2
0,2
0,1
0,1
0
0 1996
1997
1998
1999
2000
20001
2002
2003
2004
1996
1997
1998
1999
2000
20001
2002
2003
2004
WAEMU 1 0,9 0,8 0,7 0,6 0,5
CRS VRS
0,4 0,3 0,2 0,1 0 1996
1997
1998
1999
2000
2001
2002
2003
2004
23
Appendix 2 : Technical efficiency evolution according to banks shareholder’s equity
Technical efficiency evolution under VRS assumption according to banks shareholder's equity
Technical efficiency evolution under CRS assumption according to banks shareholders'equity 1 0,9 0,8 0,7 0,6 0,5 0,4 0,3 0,2 0,1 0
foreign banks local banks state owned banks
1 0,9 0,8 0,7 0,6 0,5 0,4 0,3 0,2 0,1 0
1996 1997 1998 1999 2000 2001 2002 2003 2004
foreign banks local banks state owned banks
1996 1997 1998 1999 2000 2001 2002 2003 2004
Appendix 3 : Technical efficiency(VRS) evolution of WAEMU banks per network . Société Générale Network
ECOBANK Network 1 1
0,9
0,9
0,8
0,8
0,7
0,7 0,6 0,5
B
0,6 0,5
CI
CI
0,4
S
0,4
T
0,3
0,3
0,2
0,2
0,1
0,1
0
0
1996 1996
1997
1998
1999
2000
2001
2002
2003
1997
1998
1999
2000
2001
2002
2003
2004
2004
Belgolaise Network
LCL Network
1
1
0,9
0,9
0,8
0,8
0,7
0,7
0,6 0,5
CI
0,4
T
0,6 0,5
0,3
0,3
0,2
0,2
0,1
CI S
0,4
0,1
0
0 1996
1997
1998
1999
2000
2001
2002
2003
2004
1996
1997
1998
1999
BOA Network
2000
2001
2002
2003
2004
BNP Network
1
1
0,9
0,9
0,8
0,8
0,7
0,7
0,6 0,5
Bénin Mali
0,6 0,5
0,4
CI
0,4
0,3
0,3
0,2
0,2
0,1
0,1
0
CI BF S T
0 1996
1997
1998
1999
2000
2001
2002
2003
2004
1996
1997
1998
1999
2000
2001
2002
2003
2004
24
Appendix 4 : Cost efficiency evolution of WAEMU banks per countries from 1996 to 2004
Burkina Faso
Bénin 1,00 0,90
1,00 0,90 0,80 0,70 0,60 0,50 0,40 0,30 0,20 0,10 0,00
0,80 0,70 0,60 0,50
cost efficiency
0,40 0,30 0,20 0,10 0,00 1996
1997
1998
1999
2000
2001
2002
2003
2004
cost efficiency
1996
1997
1998
1999
2000
Côte d'Ivoire
2001
2002
2003
2004
Mali
1,00
1,00
0,90
0,90
0,80 0,70
0,80 0,70
0,60
0,60 0,50
cost efficiency
0,50 0,40
0,40
0,30 0,20
0,30
0,10
0,10
cost efficiency
0,20
0,00
0,00 1996
1997
1998
1999
2000
2001
2002
2003
2004
1996
1997
Sénégal
1998
1999
2000
2001
2002
2003
2004
Togo
1,00
1,00
0,90
0,90
0,80
0,80
0,70
0,70
0,60 0,50
0,60 0,50
cost efficiency
0,40
0,40
0,30
0,30
0,20
0,20
0,10
0,10
0,00
cost efficiency
0,00 1996
1997
1998
1999
2000
2001
2002
2003
2004
1996 1997 1998 1999 2000 2001 2002 2003 2004
WAEMU 1,00 0,90 0,80 0,70 0,60 0,50
cost efficiency
0,40 0,30 0,20 0,10 0,00 1996
1997
1998
1999
2000
2001
2002
2003
2004
25
Appendix 5 : Cost efficiency evolution according to WAEMU banks shareholder’s equity
Cost efficiency evolution of WAEMU banks according to their shareholders' equity 1 0,9 0,8 0,7 0,6 0,5 0,4 0,3 0,2 0,1 0
Foreign banks local banks state owned banks
1996
1997
1998
1999
2000
2001
2002
2003
2004
Apendix 6 : Cost efficiency evolution of WAEMU banks per network . ECOBANK Network
BNP Network
1
1
0,9
0,9
0,8
0,8
0,7
0,7
0,6 0,5
B CI
0,6 0,5
0,4
T
0,4
0,3
0,3
0,2
0,2
0,1 0 1995
CI BF S T
0,1
1996
1997
1998
1999
2000
2001
2002
2003
2004
0 1995
2005
1996
1997
1998
1999
2000
BOA Network
2002
2003
2004
2005
LCL Network
1
1
0,9
0,9
0,8
0,8
0,7
0,7 B
0,6 0,5 0,4
CI
0,6 0,5
M
0,4
0,3
0,3
0,2
0,2
0,1
0,1
0 1995
2001
1996
1997
1998
1999
2000
2001
2002
2003
2004
CI S
0 1995
2005
1996
1997
1998
1999
2000
2001
2002
2003
2004
2005
Société Générale Network 1 0,9 0,8 0,7 0,6 0,5
CI S
0,4 0,3 0,2 0,1 0 1995
1996
1997
1998
1999
2000
2001
2002
2003
2004
2005
26
Appendix 7: Choice of a double truncated Tobit model The Tobit model is a model in which the dependent variable is continuous and observable on a certain interval. This is the case with the efficiency variable that we are trying to explain. Indeed, efficiency evolves between 0 and 1, and can therefore not be modelled by a logit or probit model because it is not a dichotomous variable. The Tobit model is located midway between the linear regression models in which the endogenous variable is continuous and observable and qualitative models. The simple Tobit model generally is expressed in the following manner: E (yi*/xi)=xi β +εi, where β ε Rk. yi*is not always observable and It is only observed if its value exceeds a threshold ci generally 0. You can build yi = yi* if yi* > 0 et yi = 0 if not, i= 1, 2, ….N An Ordinary Least Square estimate of this kind of truncated or censured model, is not convergent; it is rather biased. And one can not determine the sense of the bias. There is also multiple censorship Tobit model. In this case, the latent variable yi* is observed within a truncated interval. Indeed, in some applications, the dependent variable can be censored to the left and right. When thresholds of censorships are identical for all individuals, the model is called a double truncated Tobit model. It is presented as follow : yi= c1 si yi* ≤ c1 yi= yi* si c1 < yi*≤ c2 yi= c2 si yi*≥ c2 Where (c1 ; c2) ε R2 are the boundaries of the censorship. This model is used in applications where the dependent variable react to large variations (or high values) of the explanatory variables. That is why in our study we code the explanatory variables to 0 or 1. For example, if for a given variable, we realize that it is above the average of all the countries, we believe it has a positive impact on efficiency, therefore we code it to 1. On the other hand if it is lower than the average for the country and it has a negative impact, we code it to 0. This codification also accounts for the fact that the idea of the efficiency refers to a relative frontier.
27
References Aigner; Lovell; Schmidt (1977) « Formulation and estimation of stochastic Frontier production Function models », Journal of Econometrics, 6, pp21-37. Allen Linda, Rai Anoop (1996) « Operational Efficiency in banking : An international comparison », Journal of banking and finance, 20 pp 655-672. Ary Tanimoune, «Libéralisation financière et intermédiation bancaire dans l’UEMOA : une analyse sur données de panel », XIVe Journées Internationales d’économie monétaire et bancair, Lyon 6-7 juin 2002. Azam Jean Paul, Biais Bruno, Dia Magueye,(2004) “Privatisation in developing Economies: the case of West African Banks”, Journal of African Economies, vol 13, n° 3. Berg S.A. ; Forsund F.; Hjalmarsson L.; Suominen M. (1993) « Banking efficiency in the Nordic Countries », Journal of banking and Finance. Berger Allen N and Humphrey David B, (1997) “Efficiency of financial institutions: International Survey and Directions for Future Research”, European Journal of Operational Research, Berger Allen N. and Mester Loretta, (1997), “Inside the black box: What explains differences in the efficiencies of financial institutions?”, Journal of Banking and Finance n°21. Bilan des banques et établissements financiers UMOA, de 1998 à 2004. Buchs Thierry and Mathiesen Johan, January 2005 “Competition and efficiency in banking: behavorial evidence from Ghana”, IMF Working paper. Cihak Martin and Podpiera Richard, June 2005 “Bank behaviour in developing countries: Evidence from east Africa” IMF Working Paper. Coelli, Tim; July 1996 “A guide to Frontier Version 4.1: A computer program for stochastic Frontier production and cost fonction estimation”, CEPA Working paper. Coelli, Tim; July 1996; “A guide to DEAP: Data Envelopment Analysis (computer) Program”, CEPA working paper. Daumont Roland, Le Gall Françoise, Le Roux François, Avril 2004; « Banking in SubSaharan Africa : What went wrong ?»; IMF Working Paper David A. Grigorian and Vlad Manole, September 2002, « Determinants of commercial bank performance in transition : An application of Data Envelopment Analysis. » IMF, Working Paper. Delage Alain, Masiera Alain: “Le franc CFA: bilan et perspectives”, Bibliothèque du développement, éditions l’harmattan, Paris 1994
28
Dietsch Michel and Lozano-Vivas Ana, (2000) “ How the environment determines banking efficiency : A comparison between French and Spanish industries” Journal of banking and Finance n°24. English, Grosskopf, Hayes and Yaisawarng (1993), “Output allocative and technical efficiency of banks” Journal of banking and Finance. Farell M J, (1957) «The measurement of productive efficiency », Journal of the Royal Statistical Society, series A (general), vol. 120, N3, pp 253-290. Frei Frances X., Harker Patrick T, Hunter Larry W., “Inside the Black Box: What make a bank efficient?” in Performance of Financial Institutions, chp 8, Cambridge University Press, 2000 Grigorian and Manole (2000) “Determinants of commercial bank performance in transition: an apllication of data Envelopment analysis”, IMF Working paper WP/02/146 Gulde, Patillo and Christensen, (2007) “Sub-Saharan Africa : Financial Sector challenges”, IMF Harker Patrick and Stravos Zenios, “Performance of Financial Institutions: Efficiency, Innovation, Regulation”, Cambridge University Press, 2000 Hasan, Lozano-Visas and Pastor (2000): “Cross-border performance in European Banking”, Bank of Finland Discussion Papers 24. Hauner David and Peiris Shanaka, December 2005 “Bank efficiency and competition in lowincome countries: the case of Uganda.” IMF Working Paper. Honohan Patrick (1993), “Financial Sector failures in Western Africa”, The Journal of modern african studies, 31, I, pp 49-65. Kumbhakar Subal, Lozano-Vivas Ana, Lovell Knox C A, Hasan Iftekhar, (2001) “The effects of Deregulation on the performance of Financial Institutions: the case of Spanish Savings banks”, Journal of Money, Credit and Banking, Vol 33, N° 1. Jondrow, Lovell, Materov et Schmidt (1982) « On the estimation of technical efficicency in the stochastic Frontier Production Function Model », Journal of Econometrics, 19, pp 233238. Leigthner Jonathan and Lovell Knox, (1998) “The impact of financial liberalization on the performance of Thai banks” Journal of Economics and Business, 50 (2), 115-131. Lenoir, Alain « L’Afrique francophone subsaharienne, une zone en mutation » Banque Magazine Janvier 2004 n° 654 Lovell Knox , Schmidt Shelton, “ The measurement of productive efficiency: Techniques and application.” Oxford University Press, 1993. Mathis Jean : « Monnaie et banques en Afrique francophone » ; EDICEF/AUPELF, Paris 1992.
29
Nakane Márcio I. et Weintraub Daniela B., “Bank privatization and productivity : evidence for Brazil”, World Bank Policy Research Working Paper 3666, July 2005 N’gusessan Tchétché : « Gouvernance et politique monétaire : A qui profitent les banques centrales de la Zone Franc ? » Editions l’Harmattan, Paris, 1996.
Patrick et Sylvianne Guillaumond, « Zone Franc et développement africain. » Economica Edition 1984. Powo Fosso Bruno, (2000) « Les déterminants des faillites bancaires dans les pays en développement: le cas des pays de l’UEMOA. » Cahier 02-2000, Centre de recherche et de développement économique _Montréal : Université de Montréal. Problèmes économiques, Avril 1998 « Où sont les systèmes francophone ? » Revue Financière, N° 2 564.
financiers d’Afrique
Rapports annuels de la Banque Centrale des Etats de l’Afrique de l’Ouest, BCEAO. Rapports annuels de la commission bancaire de l’UMOA, Commission bancaire. Ross Levine, (June 1997) “Financial development and economic growth: views and Agenda”, Journal of economic literature vol XXXV 688-726. Sigal Ribon and Oved Yosha, “Financial liberalization and competition in banking: an empirical investigation”, Bank of Israel, Discussion paper n° 99-05, December 1999. Siruguet, Jean-Luc « Banques africaines : de la difficulté des réformes en cours » Banque Magazine Janvier 2004 n° 654 Vallée Olivier : « Le prix de l’argent CFA. Heurs et malheurs de la zone Franc. » Khartala, Paris, 1989.
30


![Higher Education in Developing Countries - World Bank Group [PDF]](https://m.moam.info/img/260x300/higher-education-in-developing-countries-world-ban_647ad37f098a9ecc0b8b45f0.jpg)


