MEASURING COORDINATION GAPS OF OPEN SOURCE GROUPS THROUGH SOCIAL NETWORKS Szabolcs Feczak, Liaquat Hossain Faculty of Engineering and IT, The University of Sydney, PNR J05, Sydney, Australia
[email protected],
[email protected]
Keywords:
Coordination gaps, Social Networks, Distributed Teams, Open Source Software
Abstract:
In this paper, we argue that coordination gaps, such as communication issues and task dependencies have significant impact on performance of work group. To address these issues, contemporary science suggests optimising links between social aspects of society and technical aspects of machines. A framework is proposed to describe social network structure and coordination performance variables with regards to distributed coordination during bug fixing in the Open Source domain. Based on the model and the literature reviewed, we propose two propositions—(i) level of interconnectedness has a negative relation with coordination performance; and, (ii) centrality social network measures have positive relation with coordination performance variables. We provide empirical analysis by using a large sample of 415 open source projects hosted on SourceForge.net. The results suggest that there is relationship between interconnectedness and coordination performance and centrality measures were found to have positive relationships with the performance variables of coordination measures.
1. INTRODUCTION Coordination can be viewed as the additional information processing required in order achieving the same goal with multiple actors as one would do alone. However, management of the dependencies and efficient communication is required to minimise coordination gaps. (Malone, 1988) Previous studies focus on measures such as the efficiency of communication and dependency management, the quality of the outcomes, degree of meeting requirements and deadlines for reducing coordination gaps of project groups working towards a common goal. (Rathnam & Mahajan & Whinston, 1995; Kraut, 1995; Faraj & Sproull, 2000) Nevertheless, management of coordination for a distributed team imposes higher variability in the dependency management requirements and therefore, makes the coordination much more challenging compared to groups operating on the same site and not having this sort of distance. (Bonaccorsi & Rossi, 2003) Group awareness
therefore can help to raise the level of efficiency through implicit coordination. (Gutwin, 2004) Since one major facet of coordination is communication, it is important to study relation between network structures and coordination performance in a distributed environment. Centrality has been identified to have major positive influence on coordination performance in local teams, but has not been confirmed yet on large scale. (Rathnam, 1995) Therefore, analysis of coordination problems in dynamic and dispersed collaboration groups through their social structure is considered to be an important area of research. In social networks centrality denotes the structural power position of a node in a given network. Centrality has three measures (a) Freeman degree centrality - number of adjacent nodes, (b) closeness - reciprocal value of the total number of hops in the shortest possible way to every other node. and (c) betweeness - number of times the node appears on the shortest path between other nodes. The higher the value is the more influence can a particular node has on the entire network. Centrality is not only understood on nodes, a characteristic
2
This article was published in the proceedings of the 11th International Conference on Enterprise Information Systems - ICEIS 2009 Volume HCI, Milan, Italy, May 6-10, 2009. 2009, ISBN 978-989-8111-88-3
value can be calculated for the total network as well using any if the above measures. Network density is the number of links divided by the number of all theoretically possible links. (Robert & Hanneman, 2001; Freeman 1979) There are several studies in the open source domain looking for answers regarding coordination. (Madey & Freeh & Tynan, 2002; Spaeth, 2005) “Free and Open Source Software development not only exemplifies a viable software development approach, but it is also a model for the creation of self learning and self-organising communities in which geographically distributed individuals contribute to build a particular software.” (Sowe & Stamelos & Angelis, 2006) Consequently, open source as a domain for this study was chosen for exploring coordination performance measures.
2. COORDINATION THEORY FOR OSS We apply coordination theory for exploring the effective coordination structures of open source software teams engaged in bug fixing activities. Using research findings of Sandusky and Gasser’s study (Sandusky, 2005), we highlight the tasks below which relates to coordination process by incorporating normative software management processes identified in open source environment: (i) Goals: ensure that the software (i.e., is able to perform all specified functions); (ii) Tasks (i.e., production tasks--identify the defect); (iii) coordination tasks (i.e., report a bug, categorize a bug: which module does it relate to, what is the severity, priority); (iv) Actors-open source software community members (i.e., one ore more developers in various roles); and, (v) Dependencies (i.e., the most common dependencies are from the producerconsumer type). Dependency management is performed in order to achieve the ultimate goal with multiply actors: software without defects. Therefore, effectiveness of the coordination is measured against bug fixing task performance. Technical environment has a moderating role in the information technology domain (Rathnam & Mahajan & Whinston, 1995),
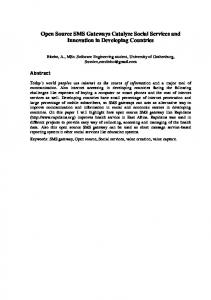
however these tools do not have ultimate effect on coordination performance. Study by Kraut, and Streeter suggest that project size and complexity increases coordination gaps so these have been added to the moderating variables as well (Kraut & Streeter, 1995). With regards to the features of the distributed team, experience was advised as a factor which plays an important role in coordination, providing a base for better understanding peers and work flows to carry out internal coordination without excessive communication (Faraj & Sproull, 2000). The number of the members in the team relates to the size of the project so it has been added to extend work group features. To measure coordination performance, we consider time constraint as it has direct correlation with coordination performance (Espinosa, 2002). Since coordination performance itself is not tangible it is common practice to relate this measure to the outcome of the work actors have completed (Rathnam & Mahajan & Whinston, 1995). Evaluation of the outcome could be done with interviewing the users, however we do not have the resources to do that, so the rating which relates to dependency management is going to be done with software evaluation methods discussed above (Kraut & Streeter, 1995). Therefore, software quality metrics are going to used to extend the timeliness measure and evaluate coordination performance. Figure 1 presents the elements of the framework and relations between them. In developing this framework, previous studies of coordination and software development were analysed. After identifying certain metrics, a preliminary test was carried out to investigate if it is feasible to measure those values advised by the literature. Based on the availability and reliability of data accessible, the measures were short listed. Based on the literature and the model, we propose the following propositions for this study: (i) higher degree of network density creates redundant information flows which have a negative effect on the coordination performance; and (ii) higher degree of centrality and betweenness creates stricter hierarchy, which significantly reduces the dependencies, and coordination gaps.
Social Network Structure (Independent Variables)
Coordination performance (Dependent Variables)
Centrality Measures
Mean Time Between Failure
Degree Closeness
Defect Removal Effectiveness
Betweenness
ReciprocalTime To Fix
Network Density
Figure 1: OSS Coordination performance model
This article was published in the proceedings of the 11th International Conference on Enterprise Information Systems - ICEIS 2009 Volume HCI, Milan, Italy, May 6-10, 2009. 2009, ISBN 978-989-8111-88-3
3. METHODS Most data about open source projects are publicly available. However the number of projects is large and they are scattered all over the world. Furthermore, the services they use are not homogeneous, and comparing many projects with distinct technological characteristics in an unbiased manner would be very tedious. Based on the above it has been decided to use one of these major hosting facilities as a source of data with a combination of manual investigation of the preliminary selected limited number of projects to check if they actively use the services offered. The choice on SourceForge was made based on the possibility that we could have SQL access to monthly data dumps granted through the Notre Dame University, Indiana, United States. During the data set definition the following aspects were kept in mind, to acquire as representative data set as possible: (i) avoid prominent projects; (ii) avoid projects with gatekeepers; (iii) size of the project: around ten to derive meaningful network structures; (iv) select projects which have distinct characteristic to help answering our questions, with minimum 200 interactions; and, (v) the project should be active in bug fixing.
3.1 Network data for social structure measures First a list of the bug fixing contributors of the selected projects was extracted grouped by communication thread. Each unique participant is identified by going through all lines and adding the identifier to a vector if it does not contain it yet. An empty adjacency matrix can be formed based on that. Going through the lines again sorted by time, we count the number of times an actor could see a post from another actor in the thread before him/her, this count becomes the weight of the link. It is assumed that actors who submitted a post earlier than someone else do not read the ones followed by them unless they post again in the thread. Interactions within each thread counted separately, so even if two actors follow each other on the timeline it does not count if it was on a different thread. At the end of this process the matrix is symmetrised based on the smaller number of interactions. During the measurement, the threshold was set to minimum five interactions to consider a link significant (Adamic, 2005).
3
3.2 Coordination performance measures Time to Fix and Mean Time Between Failure characteristics were measured based on the bug tracking system records available from the database. The Time to Fix index was calculated as an average of differences between the open and the close date. Mean Time Between Failure index was calculated as an average of differences between the open time of a bug and the open time of the bug before that bug in consecutive timely order. Based on the histograms, the variables did not follow normal distribution, descriptive statistics confirm this, because all skewness and kurtosis highly deviate from zero. The Defect Removal Efficiency (DRE) D(415)=0.141, p