http://dx.doi.org/10.5755/j01.eee.18.8.2630
ELEKTRONIKA IR ELEKTROTECHNIKA, ISSN 1392-1215, VOL. 18, NO. 8, 2012
Measuring Progress of Scrum-based Software Projects V. Mahnic, N. Zabkar Faculty of Computer and Information Science, University of Ljubljana, Tržaška 25, SI-1000 Ljubljana, phone: +386 1 4768 447
[email protected]
al. [8] presented an adaptation of the Earned Value Management method [9] for Scrum projects. Measuring performance of Scrum-based software projects has also been the subject of the authors’ research for the last five years. A model for performance monitoring, which included views of different stakeholders (i.e., IT management, Team members, ScrumMaster and Customers) was developed first [10]. The next step was the introduction of the measurement repository [11] and consideration of requirements of the CMMI Measurement and Analysis Process Area [12]. Then the assessment of the model’s compliance with COBIT [13] was made. Suitability of the model for practical use was extensively tested in an academic environment within the scope of a capstone course which requires students of the last semester of the Computer Science program to develop an almost real software project [14], [15]. The same course also served as a case study on agile estimating and planning using Scrum [16]. In order to test the model in an industrial environment the collection of IT management measures was further studied within the framework of a real project, which took place during 2011 in the largest Slovenian publishing company. The main project’s business objectives were to renew the web edition of the company’s daily newspaper with the largest circulation and introduce Scrum as the development process to their web applications department [17]. It was additionally agreed that the project will also serve as a case study for evaluation of IT management measures defined within our model. Consequently, the first author helped the company in preparations for Scrum implementation and supervised the collection of prescribed base measures during the first seven Sprints. Measurement data were collected using a slightly extended version of the Agilo for Scrum project management tool and analyzed after completion of the project. The results of the analysis are presented in the remainder of this paper. The following section contains a brief description of the project that served as a case study, then the measurement results are presented and discussed, and finally the most important conclusions are presented. In order to make the paper more easily understandable the meaning of Scrum specific terms is explained in Table I.
Abstract—Possible loss of management control is one of the greatest concerns when adopting agile software development methods in industrial practice. Therefore, monitoring progress of agile projects is an important issue in the software industry. This paper describes a set of measures that provide IT management with continuous insight in the Scrum-based software development process. The proposed measures were applied within the scope of the project of rebuilding the web site of Slovenian daily newspaper with the highest circulation, which served as a case study for evaluation of their usability. The paper presents the measurement results and discusses their value for project management. The case study showed that each proposed measure describes a valuable process aspect and that data collecting does not require additional administrative work that would harm the agility of Scrum. Index Terms—Agile methods, Scrum, software development management, software measurement.
I. INTRODUCTION Agile development methods and practices [1] have been gaining wide acceptance in the software development community. In January 2010 Forrester [2] reported results of their Global Developer Technographics Survey which revealed that 35% of respondents used an agile development process. At the same time Gartner predicted [3] that by 2012 agile development methods will be utilized in 80% of all software development projects. According to the last State of Agile Survey the most widespread agile method is Scrum [4], [5], which is used by 66% of 6042 respondents. The same survey also revealed that the loss of management control is one of the greatest concerns about adopting agile. Therefore, continuous monitoring of the development process through appropriate set of measures is crucial to ensure visibility, inspection, and adaptation. II. RELATED WORK Measuring agile software development has been studied by different authors. Hartmann and Dymond [6] pointed out that agile metrics should not be simply adopted from plandriven approach, but must be defined in such a way that they do not harm the agility of the development process. Ktata and Levesque [7] described an approach to the design and implementation of a measurement program for Scrum teams using the Goal-Question-Metric method. Sulaiman et Manuscript received March 14, 2012; accepted May 11, 2012.
73
ELEKTRONIKA IR ELEKTROTECHNIKA, ISSN 1392-1215, VOL. 18, NO. 8, 2012 Sprint length, and the cost of each developer’s engineering hour) enabled the computation of derived measures indicating the project progress.
III. PROJECT DESCRIPTION The project that served as a case study lasted 7 months (from May until the end of November) and consisted of 9 Sprints. By rebuilding the web site the publishing company wanted to establish a new technological platform, renovate the content of the newspaper’s web edition, standardize further development and maintenance procedures, and facilitate editorial teams’ work. Fresh new look and some advanced technical solutions were expected to increase the number of portal’s users and their activities. Scrum was considered an appropriate development method due to vague and changing requirements, project’s nature (agile methods are typically used for development of web applications), and short time to deliver. It was expected that in the case of successful implementation Scrum would be accepted as a standard methodology.
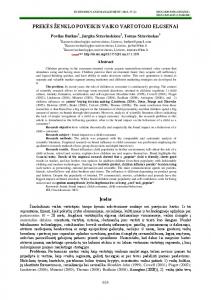
IV. RESULTS During the case study the following derived measures of progress were observed: velocity, amount of work remaining (represented by the Release and Sprint burndown charts), and schedule and cost performance indexes. The first two measures are well known and established measures of agile projects progress. With the purpose of monitoring development costs the earned value indexes were added by the authors, since these are not included in other measures. A. Velocity Velocity represents the amount of work accomplished in each Sprint expressed in story points. Fig. 1 shows the difference between the planned and actual velocity for seven Sprints that we observed during the study. The planned velocity was estimated by the Scrum Team at the beginning of each Sprint and the user stories were allocated to the Sprint so that the sum of story points fitted within the capacity determined by the velocity estimate. The actual velocity was calculated at the end of the Sprint by summing up story points for all the stories accepted by the Product Owner. The results revealed that the actual velocity was behind the planned velocity for the majority of Sprints. This was understandable for the first Sprint, since there was no previous experience and the planned velocity was estimated by simply assuming a working day (i.e., a story point) to be equal to 6 hours of effective work. The actual velocity was at its lowest in the fifth Sprint due to two new developers added to the development team, who were expected to increase the amount of work completed, but created disruption instead, which decreased the productivity of other team members. A substantial difference between the planned and actual velocity in Sprint 6 was a consequence of too optimistic velocity estimate. Instead of adapting the estimate to actual achievement in previous Sprints the team succumbed to the pressure of approaching deadline and promised to deliver more functionality than actually possible.
TABLE I. SCRUM SPECIFIC TERMS A short description of desired functionality (user requirement). Story point Measure of effort required for implementing a user story. Usually corresponds to an ideal day of work. Product Backlog A set of all user stories currently known. Sprint An iteration. Sprint Backlog Subset of the Product Backlog consisting of user stories that the Team committed to implement in a particular Sprint. Each story is further split into tasks. Scrum Team Developers responsible for implementing functionality. Product Owner Represents the interests of everyone with a stake in the project and maintains the Product Backlog. ScrumMaster Manages the Scrum process and ensures that everyone follows Scrum rules and practices. User story
The number of people working on the project varied slightly from Sprint to Sprint between 6 and 8. The associate editor of the newspaper’s web edition was assigned the role of the Project Owner, while the head of the web development department played the role of the ScrumMaster. During his absence this role was performed by his assistant. Other project members were developers, constituting the Scrum Team responsible for implementation of desired functionality. Sprints lasted three weeks. Each Sprint started with the Sprint planning meeting on Thursday and ended with the Sprint review and the Sprint retrospective meetings on Tuesday of the third week of the Sprint. In between the Scrum Team had 12 working days to develop software. At the end of each Sprint the Product Owner evaluated all implemented stories strictly considering the concept of “done”. All stories that did not conform to user requirements were rejected. In order to measure progress the following base measures had to be collected: the size (in story points) of each user story in the Product Backlog, and the amounts of work spent and work remaining (in hours) for each task in the Sprint Backlog. The size of each user story was estimated using planning poker at the Sprint planning meeting, while the amounts of work spent and work remaining were recorded every day at the Daily Scrum meetings. These measures (together with some basic project parameters, such as the
Fig. 1. Planned and actual velocity in Sprints 1–7.
74
ELEKTRONIKA IR ELEKTROTECHNIKA, ISSN 1392-1215, VOL. 18, NO. 8, 2012
Work Remaining Hours
Analysis of velocity revealed two common mistakes that should be avoided in Scrum projects: planned velocity should be estimated considering the actual velocity of previous Sprints and there should be no changes in development team in the middle of the project.
Remaining Story Points
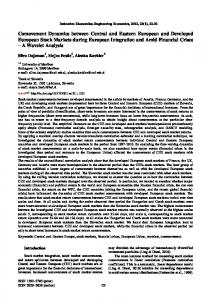
B. The Release burndown chart It shows the amount of work remaining at the beginning of each Sprint by plotting the sum of story points of all unfinished stories in the Product Backlog. It makes visible the correlation between the amount of work remaining and the progress of the Scrum Team in reducing this work. The trend line for work remaining indicates the most probable completion of work at a given point in time.
30 20 10 0 6
1
2
3
4
5
6
7
8
9
10
11
12
Day of Sprint
Ideal
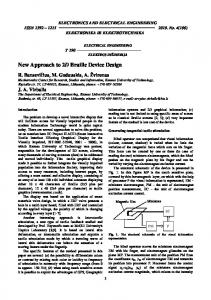
D. Earned value management (EVM) It is not part of Scrum, but is often required as good practice (e.g., by the government projects in the United States). While other studies that explore the use of EVM within Scrum (e.g., [8]) describe the computation of earned value at the release level, we introduced the computation of EVM indexes at the Sprint level. An interested reader can find detailed description in [11]. Our approach provides the values of schedule performance index (SPI) and cost performance index (CPI) on a daily basis, thus enabling immediate response in the case of deviation from the plan, which can be especially useful when longer Sprints are used. Computation of SPI and CPI requires collection of only one additional base measure, i.e., the number of hours spent on each task between two consecutive Daily Scrum meetings. Fig. 4 and Fig. 5 show the SPI and CPI values for Sprint 2 of our case study. The CPI values were computed assuming that the cost of engineering hour was the same for all members of the Scrum Team.
40
5
30
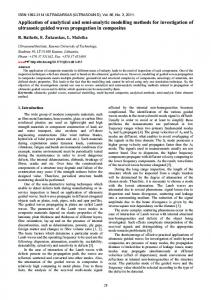
Fig. 3. Sprint burndown chart for Sprint 2.
50
4
40
Actual
60
3
50
0
70
Ideal
60
0
80
2
70
10
90
Actual
80
20
100
1
90
7 Sprint
Fig. 2. Release burndown chart at the beginning of Sprint 7.
The Release burndown chart in Fig. 2 indicates that the Team was not able to reduce the amount of work remaining quickly enough to complete the project in seven Sprints as it was expected at the beginning of the project. The main reason for this were emerging requirements, which were not part of the initial Product Backlog, but were constantly added by the Product Owner during the project. In such cases the Release burndown chart can be used to simulate the impact of removing functionality from the release to get a more acceptable completion date. Using this approach the publishing company reexamined the contents of the Product Backlog and successfully launched a reduced release after 9 Sprints.
1,2 1
SPI
0,8
0,6 0,4 0,2 0 1
C. The Sprint burndown chart It is similar to the Release burndown chart, but instead of giving the big picture of the entire release it represents the amount of work remaining that needs to be accomplished till the end of the Sprint. The horizontal axis shows the days of a Sprint, while the vertical axis shows the number of remaining working hours. The chart is updated every day by aggregating the estimates of work remaining for all tasks in the Sprint Backlog, which are collected at the Daily Scrum meeting. The trend line of remaining working hours indicates whether the Team will accomplish the tasks committed by the end of the Sprint. Fig. 3 shows how the amount of work remaining was changing in Sprint 2 of our case study. In contrast to chart in Fig. 2, this chart shows a more evident falling trend indicating that the development team developed software for almost all user stories planned for that Sprint.
2
3
4
5
Actual
6
7
8
9
10
11
12
Day of Sprint
Ideal
Fig. 4. SPI for Sprint 2.
1,2
1
CPI
0,8 0,6 0,4 0,2
0 1
2
3
Actual
4
5
6
Ideal
7
8
9
10
11
12
Day of Sprint
Fig. 5. CPI for Sprint 2.
Fig. 4 shows that the Sprint was behind plan (SPI value
75
ELEKTRONIKA IR ELEKTROTECHNIKA, ISSN 1392-1215, VOL. 18, NO. 8, 2012 less than 1) since the third day, thus providing early indication that something went wrong. The Team was again quite close to the plan (target value of 1) on the eighth and tenth day, but finished the Sprint without accomplishing all tasks. Similar information is presented in the Sprint Burndown chart (Fig. 3), where the gap between the actual and ideal amount of work remaining is the smallest on days 2, 8, and 10. Fig. 5 shows that the labor costs exceeded the plan (CPI value less than 1) on the second day and remained too high till the end of the Sprint. However, unlike in SPI and Sprint burndown charts, CPI on days 2, 8 and 10 was not close to the target value 1, since more working hours were spent than planned. While SPI provides similar information as Sprint burndown chart (when the amount of work remaining is above the ideal line in the burndown chart, the value of SPI is less than 1 and vice versa), the CPI provides the information that is not available from any other measure.
their contribution while piloting proposed model in industrial environment. REFERENCES [1] [2]
[3]
[4] [5] [6]
[7]
V. CONCLUSIONS [8]
The case study proved that each proposed measure indicates a valuable aspect of measuring progress of Scrumbased software projects and that data collecting does not require additional administrative work that would harm the agility of development process. Velocity enables IT management to learn from the previous planning cycles and improve their estimates of the amount of work that can be done in subsequent Sprints. Release Burndown chart gives a big picture of the project trends, which can be used for the prediction of the completion date. It reflects the impact that an addition (or removal) of user stories has on the completion date and functionality of the Release. Sprint burndown chart shows project trends during one Sprint, which can be used for the prediction of the scope fulfillment by the end of the Sprint. SPI presents information similar to Sprint burndown in EVM terminology, while CPI completes the whole picture with the information about cost efficiency, which is not included in other measures. In the future the authors plan to extend their model for performance monitoring by measuring accuracy of effort estimates obtained through planning poker [18], an agile group estimation technique that is usually used for estimating user stories. Preliminary studies [19], [20] provided promising results indicating that the planning poker estimates tend to be more accurate than the statistical combination of individual estimates if planning poker is used by experienced professionals. The authors would like to further explore the impact of accuracy of effort estimates on velocity and thus improve progress measurement of Scrumbased software projects.
[9]
[10]
[11]
[12]
[13]
[14]
[15]
[16]
[17]
[18]
[19]
ACKNOWLEDGMENT The authors are grateful to Janez Urevc and Rok Stebe for
[20]
76
L. Williams, “Agile software development methodologies and practices”, Advances in Computers, vol. 80, pp. 1–44, 2010. D. West, T. Grant, “Agile Development: Mainstream adoption has changed agility, Trends in real-world adoption of agile methods”, Forrester, Jan. 20, 2010, [Online]. Available: http://www.forrester.com/rb/Research/agile_development_mainstrea m_adoption_has_changed_agility/q/id/56100/t/2 T. E. Murphy, J. Duggan, D. Norton, B. Prentice, D. C. Plummer, S. Landry, “Predicts 2010: Agile and Cloud Impact Application Development Directions”, Gartner, Dec., 2009. K. Schwaber, M. Beedle, Agile Software Development with Scrum. Upper Saddle River, USA: Prentice-Hall, 2002, p. 158. K. Schwaber, Agile Project Management with Scrum. Redmond, USA: Microsoft Press, 2004, p. 163. D. Hartmann, R. Dymond, “Appropriate Agile Measurement: Using Metrics and Diagnostics to Deliver Business Value”, in Proc. of AGILE 2006 Conference (AGILE’06), Minneapolis, Minnesota, 2006, pp. 126–134. Q. Ktata, G. Levesque, “Designing and Implementing a Measurement Program for Scrum Teams: What do agile developers really need and want?”, in Proc. of C3S2E-10, Montreal, Canada, 2010, pp. 101– 107. T. Sulaiman, B. Barton, T. Blackburn, “AgileEVM - Earned Value Management in Scrum Projects”, in Proc. of AGILE 2006 Conference (AGILE’06), Minneapolis, Minnesota, 2006, pp. 7–16. [Online]. Available: http://dx.doi.org/10.1109/AGILE.2006.15 A Guide to the Project Management Body of Knowledge (PMBOK Guide), 4th ed., Newtown Square, USA: Project Management Institute, 2008, p. 506. V. Mahnic, I. Vrana, “Using stakeholder driven process performance measurement for monitoring the performance of a Scrum-based software development process”, Elektrotehniski vestnik, Ljubljana: Electrotechnical Society of Slovenia, no. 5, pp. 241–247, 2007. V. Mahnic, N. Zabkar, “Measurement repository for Scrum-based software development process”, in Proc. of the 2nd WSEAS International Conference on Computer Engineering and Applications (CEA'08), Acapulco, Mexico, 2008, pp. 23–28. V. Mahnic, N. Zabkar, “Introducing CMMI measurement and analysis practices into Scrum-based software development process”, International Journal of Mathematics and Computers in Simulation, NAUN, vol. 1, no. 1, pp. 65–72, 2007. V. Mahnic, N. Zabkar, “Using COBIT indicators for measuring scrum-based software development”, WSEAS Transactions on Computers, vol. 10, no. 7, pp. 1605–1617, 2008. V. Mahnic, “Teaching Scrum through team-project work: students’ perceptions and teacher’s observations”, International Journal of Engineering Education, vol. 1, no. 26, pp. 96–110, 2010. V. Mahnic, “A capstone course on agile software development using Scrum”, IEEE Transactions on Education, vol. 1, no. 55, pp. 99–106, 2012. [Online]. Available: http://dx.doi.org/10.1109/TE.2011.2142311 V. Mahnic, “A Case Study on Agile Estimating and Planning using Scrum”, Elektronika ir elektrotechnika (Electronics and Electrical Engineering). no. 5, pp. 123–128, 2011. J. Urevc, R. Stebe, V. Mahnic, “Scrum implementation in publishing house „Delo”, in Proc. of the Conference Dnevi slovenske informatike, Portoroz, Slovenia, 2012. J. Grenning, “Planning poker or how to avoid analysis paralysis while release planning”, April 2002, [Online]. Available: http://www.renaissancesoftware.net/files/articles/PlanningPokerv1.1.pdf K. Moløkken-Østvold, N. C. Haugen, H. C. Benestad, “Using planning poker for combining expert estimates in software projects”, Journal of Systems and Software, vol. 81, no. 12, pp. 2106–2117, 2008. V. Mahnic, T. Hovelja, “On using planning poker for estimating user stories”, Journal of Systems and Software, vol. 85, no. 9, pp. 2086– 2095, 2012.