Research and Practice in Technology Enhanced Learning World Scientific Publishing Company & Asia-Pacific Society for Computers in Education
MEASURING SELF-REGULATED LEARNING SKILLS THROUGH SOCIAL INTERACTIONS IN A TEACHABLE AGENT ENVIRONMENT
GAUTAM BISWAS, HOGYEONG JEONG, JOHN S. KINNEBREW, BRIAN SULCER, AND ROD ROSCOE * Vanderbilt University, Department of EECS/ISIS Box 351829, Sta B Nashville, TN 37235
[email protected] http://www.teachableagents.org We have developed a learning environment where students teach a computer agent, using visual representations, and can monitor the agent’s learning progress by asking her questions and having her take quizzes. The system provides self-regulated learning and metacognitive support via dialogembedded prompts from Betty, the teachable agent, and Mr. Davis, the mentor agent. Our primary goals have been to support learning of complex science topics in middle school classrooms and facilitate development of metacognitive skills to support future learning. In this paper, we discuss methods that we have employed for detecting and characterizing students’ behavior patterns from their activity sequences on the system. In particular, we discuss a method for learning hidden Markov models (HMM) from the activity logs. We demonstrate that the HMM structure corresponds to students’ aggregated behavior patterns in the learning environment. Overall, the HMM technique allows us to go beyond simple frequency and sequence analyses, such as individual activity and predefined pattern counts, instead using exploratory methods to examine how these activities cohere in larger patterns over time. The paper outlines a study conducted in a 5th grade science classroom, presents the models derived from the students’ activity sequences, interprets the model structure as aggregate patterns of their learning behaviors, and links these patterns to students’ use of selfregulated learning strategies. The results illustrate that those who teach an agent demonstrate better learning performance and better use of metacognitive monitoring behaviors than students who only learn for themselves. We also observed more advanced and focused monitoring behaviors in the students who received metacognitive strategy feedback from the mentor agent while they taught the teachable agent. Keywords: Learning by teaching; metacognition; measuring self-regulated learning; sequence analysis; hidden Markov models.
1. Introduction We have developed computer-based learning environments that use the learning-byteaching paradigm to help middle school students develop higher-order cognitive skills when learning in science and math domains (Biswas et al., 2005; Blair et al., 2007 Leelawong and Biswas, 2008). To teach, one must gain a good understanding of the *
Rod Roscoe is now at the University of Memphis, TN. 1
2
Biswas, Jeong, Kinnebrew, Sulcer, & Roscoe
domain knowledge and then structure the knowledge in a form that can be presented to others (Bargh and Schul, 1980). Preparing to teach is a self-directed and open-ended activity where one explores, integrates, and structures knowledge first for oneself, and then for others. Biswas, Schwartz, & Bransford (2001) have reported that students felt that the responsibility to teach encouraged them to gain deeper understanding of the materials during preparation. Beyond preparing to teach, the act of teaching taps into three critical aspects of learning interactions – structuring, taking responsibility, and reflecting. With respect to structuring, teaching peers gives students opportunities to organize their knowledge and articulate it via explanations, which facilitates self-monitoring and revision of that knowledge (Roscoe and Chi, 2007). Moreover, interactions with the pupil (e.g., questions) can prompt additional, reflective knowledge-building for the teacher (Roscoe and Chi, 2007). Since teaching is frequently open-ended and self-directed, teachers also need to take the responsibility of deciding which content is most relevant (Artzt and Armor-Thomas, 1999). Finally, effective teachers reflect by monitoring how well the students understand ideas and apply them to answer questions or solve problems. Studies have shown that tutors and teachers often reflect on their interactions with students during and after the teaching process in order to better prepare for future learning sessions (Chi et al., 2001). To stimulate and promote these learning interactions, we have designed a teachable agent (TA) system called Betty’s Brain (Biswas et al., 2005). In this system, students teach a computer agent using a causal map, which is a visual representation of knowledge structured as a set of concepts and their relationships (Leelawong and Biswas, 2008). Using their agent’s performance (which is a function of how well the agent has been taught) as motivation and a guide, students study the available resources so that they can remediate the agent’s knowledge, and, in this process, learn the domain material themselves. For this reason, our learning-by-teaching environment is well-suited to helping students become more knowledgeable of, and responsible for, their own cognition and reasoning. As a result, the students are likely to develop problem-solving and monitoring skills that go beyond the learning of specific domain content; learningby-teaching environments provide the much larger framework that guides students on how to learn and how to prepare for future learning (Bransford and Schwartz, 1999; Schwartz and Martin, 2004). We have hypothesized that working with Teachable Agents helps students better understand domain knowledge and engage in a variety of productive learning strategies that promote organizing and reasoning with this knowledge. Furthermore, the activities involved in this teaching process and the metacognitive prompts from the agents help the students monitor their own learning as they teach their agent. This paper discusses the results of a study we conducted in 5th grade science classrooms, where students taught their agent about entities and their relationships in a river ecosystem. One of our goals was to determine if teaching an agent produced better learning performance than students who only learned for themselves. A second goal, and
Measuring SRL Skills through Social Interactions in a Teachable Agent Environment
3
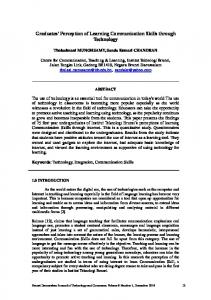
the focus of this paper, was to determine whether metacognitive and self-regulated learning (SRL) prompts by the TA and Mentor agents helped the student develop SRL strategies that they applied to their learning. We did this by analyzing students’ activity sequences as they taught Betty, and then comparing their interpreted behaviors across different conditions. Such analyses are important because they shed light on students’ underlying learning processes and the strategies they employ in achieving the task (Roscoe and Chi, 2007, Wagster, et al., 2007). To date there has been very little work on deriving students’ self-regulated learning strategies from their activity sequences in computer-based environments. Therefore, we adopt exploratory data analysis methods to quantify and assess student learning and metacognition. Specifically, we present and compare three complementary methods: 1) traditional action frequency analysis, 2) a novel relevancy measure appropriate for assessing coherence of student behavior and task focus in Betty’s Brain, and 3) a novel methodology that derives hidden Markov models (Rabiner, 1989; Li and Biswas, 2002) from student activity sequences. 2. Learning by Teaching: The Betty’s Brain System The Betty’s Brain system is illustrated in Figure 1. The teaching process is implemented as three primary activities:
Figure 1. Betty's Brain System with Query Window
4
Biswas, Jeong, Kinnebrew, Sulcer, & Roscoe
(1) teach: Students explicitly teach Betty using a concept map representation (Novak, 1998) that includes concept names, which appear as boxes, and links between concepts, which appear as arrows. The links can be of two types: (a) descriptive (e.g., “algae are a type of plant”), or (b) causal (e.g., fish eat (decrease) macroinvertebrates – therefore, an increase in fish causes a decrease in macroinvertebrates). Students teach Betty new concepts and links using the Teach Concept and Teach Link buttons. They can also delete and modify their concepts and links using the Delete and Edit buttons. (2) query: Students use a template, illustrated in Figure 1, to ask Betty questions and find out how she answers them based on what she has been taught. Students can also request explanations to observe how Betty reasons through chains of causal links. (3) quiz: Students observe Betty’s performance on a set of predefined questions that are assigned by the Mentor agent. Our middle school students are typically novices in the domain, as well as novices in teaching, when they start using the Betty’s Brain system. To effectively enable learning by novices, we provide a variety of scaffolds to help them overcome obstacles they may face in learning and teaching the domain material. For example, the system contains a set of indexed, hyper-text resources that the students can access and learn from at any time while working on the system. These resources contain all of the information (and more) that the students need to build their concept maps to teach Betty. Once taught, Betty uses qualitative reasoning methods to answer questions by reasoning through chains of links (Forbus, 1984; Leelawong and Biswas, 2008). If asked, she explains her reasoning through text, speech, and animation schemes. Students reflect on Betty’s answers and her explanations, potentially revising their own knowledge as they make changes to the concept maps to better teach Betty. A second agent named Mr. Davis plays the role of a mentor in the system. At any time, students can seek help from Mr. Davis by clicking on a “Ask Mr. Davis” button. This help includes answers to a variety of general questions, such as, “How do I build a concept map?” “How do I search for specific information in the resources?”, and “How does Betty answer a question using the concept map?” After Betty takes a quiz, Mr. Davis grades it, and, if asked, provides specific knowledge construction and monitoring feedback on how to find errors and make corrections to the map. Occassionally, the mentor also provides spontaneous self regulated learning feedback using mechanisms that we discuss in the next section. Additional details of the Betty’s Brain system and earlier experiments conducted with this system are summarized in (Biswas et al., 2005; Leelawong and Biswas, 2008). 2.1. Self-Regulation Support in Betty’s Brain In addition to answering queries and taking quizzes, the Betty’s Brain agents also provide spontaneous feedback that reflects the students’ teaching behaviors. This feedback is designed to promote students’ use of metacognitive strategies in their learning tasks (Schwartz et al., 2007; Tan, Biswas, and Schwartz, 2006; Wagster et al., 2007). Cognitive science researchers have established that metacognition and self-regulation are
Measuring SRL Skills through Social Interactions in a Teachable Agent Environment
5
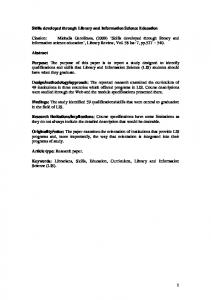
Figure 2. Metacognitive Model for Student Actions in Betty's Brain important components in developing effective learners in the classroom and beyond (Bransford, Brown, and Cocking, 2000; Zimmerman, 2001). We believe that TA environments, when combined with adequate scaffolding and feedback, can provide appropriate educational opportunities for students to develop both metacognitive knowledge and control, and, thereby, improve their subsequent learning. Schunk and Zimmerman (1997) point out that the self-regulation profiles of novice learners are quite distinct from those of experienced learners. Novices are often poor at forethought, and their self-judgment abilities are not well developed. These processes are teachable, but students in typical classrooms are rarely provided opportunities to learn and exercise self-regulation strategies (e.g., Nicol and Macfarlane-Dick, 2007). Our system addresses this problem by adopting a SRL framework that promotes a set of comprehensive skills: setting goals for learning new materials and applying them to problem-solving tasks; deliberating about strategies to enable this learning; monitoring one’s learning progress; and revising one’s knowledge, beliefs, and strategies as new material and strategies are learned (Azevedo, 2005; Schraw, Kauffman, & Lehman, 2002; Winne and Hadwin, 2008; Zimmerman, 2001). Figure 2 illustrates our conceptual cognitive/metacognitive model, employed in the design of the Betty's Brain system. Pintrich (2002) differentiates between two major aspects of metacognition for learners: (i) metacognitive knowledge that includes knowledge of general strategies and when they apply, as well as awareness of one's own abilities, and (ii) metacognitive control and self-regulatory processes that learners use to monitor and regulate their cognition and learning. In our model, metacognitive control is incorporated into knowledge construction and monitoring strategies.
6
Biswas, Jeong, Kinnebrew, Sulcer, & Roscoe
For knowledge construction in the Betty's Brain system (i.e., building causal concept maps), we identify two key types of self-regulation strategies: (i) information seeking, in which students study and search available resources in order to gain missing domain information or remediate existing knowledge, and (ii) information structuring, in which students structure the information into causal and taxonomic relationships to represent and reason about their knowledge structured as concept maps. The model also posits two types of monitoring strategies: (i) checking, where students use the query or the quiz features to test the correctness of their concept map, and (ii) probing, a stronger monitoring strategy, where students systematically analyze their map in greater detail, by asking for explanations, and following the causal reasoning steps generated by the agent to locate potential errors in the maps. In conjunction with these higher-level cognitive activities, social interactions and motivation also play an important role in the self-regulation process (Zimmerman, 2001). We believe that two interacting factors of our TA implementations are particularly supportive of self-regulation. The first is shared responsibility, which targets the positive effects of social interactions for learning. This manifests in the form of a joint effort where the student has the responsibility for teaching the TA (the TA knows no more and no less than what the student teaches her), and the TA assumes responsibility for answering questions and taking tests. The second factor is a visual shared representation, which is implemented as the concept map that the students use to teach their agents. This structure provides students with a concrete representation to follow Betty’s reasoning processes, and understand how Betty systematically combines information along a chain of links to answer questions. Proper guidance (i.e., relevant and timely feedback) provides opportunities to help the students develop good learning strategies, such as (1) reading the resources again to check concept map links and attempt to correct invalid ones, and (2) probing further by asking queries and checking explanations to find the source of an error. We have developed a number of triggering patterns that are linked to strategies for goal setting, self-assessment, and monitoring learning progress. Examples of these patterns, along with Betty’s and the Mentor’s responses are illustrated in Table 1. Betty’s responses combine motivational and self-regulation cues, whereas the Mentor, Mr. Davis’ responses focus primarily on self-regulation strategies. Betty’s persona incorporates metacognitive awareness that she conveys to the students in appropriate situations (Wagster et al., 2007; Schwartz et al., 2009). Table 1 illustrates a number of recurrent student action sequences, where metacognitive feedback may be useful. When the system detects such patterns, Betty makes suggestions to the student. For example, if her quiz scores are not improving, Betty asks the student to check if she really understands what she has been taught. This may be a cue to think of monitoring strategies that will help the student check on their own learning progress. As another example, as the student teaches Betty by adding concepts and links to the map, she will occasionally remark that the relation implied by a link between two concepts does not make sense to her and that the student should check to see if he or she is
Measuring SRL Skills through Social Interactions in a Teachable Agent Environment
7
teaching her correctly (again this is a suggestion to the students to monitor their own learning). At other times, Betty spontaneously responds to student revisions of the concept map by demonstrating reasoning with “chains of links.” Such spontaneous demonstrations may help students become more familiar with the chain-of-links reasoning processes that Betty uses to derive indirect effects, (e.g., bacteria consume dissolved oxygen, which affects macroinvertebrates, so an increase in bacteria will affect macroinvertebrates, even though there is no direct link between them). This can also provide cues to students, making them reflect on information that goes beyond what they may have read in the resources. For example, the student may wonder if it is true that an increase in bacteria will cause macroinvertebrates to increase. If this is not true, was there an error in one of the direct links? This reflection may result in the student rereading the resources to discover the source of the error. Like Betty, Mr. Davis responds to activity pattern triggers as shown in Table 1. Whereas Betty’s responses provide cues, Mr. Davis’ responses describe explicit selfregulation strategies. For example, if a student repeatedly uses the quiz and edit features with no intervening activities, implying a guess-and-check behavior to map building, the Mentor agent intervenes to remind Betty and her student teacher that a more systematic way to locate errors in the map is to ask relevant questions and then check the explanations Betty provides for her answers. Table 1. Examples of Interactive Action Patterns with Agent Responses Regulation Goal
Pattern Description
Student asks Betty a Monitoring number of questions, through but does not request Explanation explanations.
Betty Response
Mr. Davis Response
Let’s see, you have asked me a lot of questions, but you have not asked for my explanations lately. Please make me explain my answers so you will know if I really understand.
Without asking Betty to explain her answers, you may not know whether she really understands the chain of events that you have been trying to teach her. Click on the Explain button to see if she explains her answer correctly.
You have not taught Betty anything Are you sure I understand what new. Please, spend some time Student makes you taught me? Please ask me teaching her new links and concepts repeated quiz requests, some questions to make sure I and make sure she understands by Selfbut does not make any Assessment got it right. I won’t take the quiz asking her questions. Then she can changes to his/her otherwise. Thanks for teaching take the quiz again. If you need help map. me about rivers! learning new things, check the resources.
8
Biswas, Jeong, Kinnebrew, Sulcer, & Roscoe
Tracking Progress
The most recent quiz score is significantly worse than the previous one.
I would really like to do better. Please check the resources, teach Betty did well on the last quiz. me, and make sure I understand What happened this time? Maybe by asking me questions that are you should try re-reading some of on the quiz. My explanation will the resources and asking Betty more help you find out why I am questions so that you can make sure making mistakes in my answers. she understands the material before you get her to take quizzes. Also, be sure to check out the new tips from Mr. Davis.
Setting Learning Goals
Betty is asked a question that she cannot answer for the second time.
I just don’t know the relationships yet, maybe we should ask Mr. Davis what we need to learn.
I’ve seen this kind of difficultly with teaching some of my students in the past. You should try looking for missing link connections or links that are in the wrong direction.
2.2. Measuring Self-regulated Learning The traditional approach to measuring students’ SRL thinking has been through selfreport questionnaires (e.g., Pintrich, et al., 1993a; Weinstein, Schulte & Palmer, 1987; Zimmerman & Martinez-Pons, 1986). In these experiments, SRL is assumed to be an aptitude that the student possesses (Azevedo and Witherspoon, 2009), and the questions are designed to assess various facets of the student’s self-regulated learning strategies. For example, these questions may attempt to assess students’ inclination to elaborate and think critically as they read a passage, or to determine their approach to managing available time and space resources (Perry and Winne, 2006; Zimmerman, 2008). Pintrich et al. (1993b) and Zimmerman and Martinez-Pons (1986) have shown that these measures are good predictors of students’ standard achievement test scores and that they correlate well with achievement levels. However, Hadwin and others (Hadwin et al., 2001; Perry and Winne, 2006) suggest that while the questionnaires provide valuable information about the learners’ own perceptions, they fail to capture the dynamic and adaptive nature of SRL as students are involved in learning, knowledge-building, and problem-solving tasks. Moreover, studies done by Winne and Jamieson-Noel (2002) and Hadwin et al. (2007) show a lack of congruence between the self-report measures and other measures. For example, Hadwin et al. (2007) found only 27% accordance between students’ activity traces in learning environments and relevant items in the Motivated Strategies for Learning Questionnaire (MSLQ). More recently, the traditional approach of using static questionnaires or interviews to measure self-regulated learning is being enhanced by examination of trace data, such as concurrent think-aloud protocols employed while students are actively involved in their learning and problem-solving tasks (e.g., Azevedo and Witherspoon, 2009). Underlying this approach is a move away from assessing self-regulation as an intrinsic aptitude, and instead assessing it as dynamic and adaptive event occurrences (Aleven et al., 2006;
Measuring SRL Skills through Social Interactions in a Teachable Agent Environment
9
Azevedo and Witherspoon, 2009; Hadwin et al., 2007; Jeong and Biswas, 2008; Zimmerman, 2008). By identifying and analyzing temporal event sequences from trace data (e.g., student actions in a computer-based learning environment), we hope to develop online measurement schemes for students' SRL strategies. 3. Experimental Results and Analysis Our participants were 56 students in two 5th grade science classrooms with the same teacher. Students were assigned to one of three conditions using stratified random assignment based on standardized test scores. All students created river ecosystem concept maps over five 45-minute sessions. The two experimental conditions (i) the learning-by-teaching (LBT) group, and (ii) the self-regulated learning-by-teaching (SRL) group were told to teach Betty by creating a map, so that she could pass a test on her own later and join the school science club. Although these two conditions differed in agent feedback, both employed the learning by teaching paradigm. As students taught Betty, they could ask her questions, explain her answers to the questions, and take quizzes, which were sets of questions made up by a mentor agent, Mr. Davis. In addition to the teachable agent, Betty, both groups had access to Mr. Davis. After Betty took a quiz, the mentor graded the quiz and displayed the results on the screen. Both systems also provided feedback to students after a quiz. In the LBT version of the system, Mr. Davis provided corrective feedback after the quiz results were displayed. The corrective feedback linked to an incorrect answer, provided the student with information on: (1) a concept currently missing from the concept map needed to generate the correct answer; (2) a link missing from the concept map needed to generate the correct answer, if missing concepts was not the problem, or (3) a link that was incorrectly represented in the map (e.g., one of the link effects was incorrect, or the direction of a link was reversed) if missing concepts and links were not the reason for the incorrect answer. In contrast, the SRL version of the system provided feedback in the form of self regulated learning strategies. After seeing Betty’s quiz results, the students could ask the mentor for suggestions. In response, Mr. Davis suggested an information seeking strategy: he pointed to keywords the students could use to access and read relevant sections of the resources to learn more about concepts and relations that were missing or were incorrect in the maps. In addition to feedback after a quiz, Betty and Mr. Davis also generated spontaneous responses triggered by the activity patterns, such as the ones described in Table 1. Our control condition for the study, the intelligent coaching system (ICS) group was told to create the map to learn for themselves. The Betty agent was removed from this version of the system, and the students only interacted with the mentor, Mr. Davis. Otherwise, the interface to this system was identical to the two learning by teaching systems. The features available in the three versions of the system are listed in Table 2. A check mark (√) implies the feature is available. If two systems have check marks on the same column that the feature is identical in the corresponding systems. On the Quiz,
10
Biswas, Jeong, Kinnebrew, Sulcer, & Roscoe
Query and Explanation columns, B stands for Betty, M for mentor, and S for self. For example, students in the ICS condition took the quiz for themselves (S), Mr. Davis graded the quiz, and provided the same corrective feedback as in the LBT version of the system. In the other two conditions, Betty (B) took the quiz. The students in the ICS condition could also query their map and ask for explanations, but in this case, it was the mentor (M) who responded to them. In the LBT and SRL conditions, Betty was asked the queries, and she explained her answers. The content and form of the explanation was identical for the ICS, LBT, and SRL groups. Table 2. Features available to the different conditions Condition
Resources
Concept Map Editor
Query
Quiz
Explanation
ICS LBT SRL
√ √ √
√ √ √
M B B
S B B
M B B
Betty feedback
Mentor feedback Corrective
SRL
√ √ √
√
All students took a pre-test before the intervention, and an identical post-test after they had worked on the system for five sessions. The tests contained multiple-choice and free-response questions (see Appendix A for selected examples and Leelawong and Biswas, 2008, for additional details). The test had 6 multiple choice questions (1 point each for a maximum of 6 points) and 4 free response questions (6 points each for a maximum of 18 points). The free response questions asked for a definition (4 points max) with supporting examples (2 points) †. Example questions appear in Appendix A. Table 3 presents the average pre- and post-test scores by condition. We used two graders for the pre- and post-tests, and the inter-rater reliability was over 0.9. Table 3. Student Test Scores Measure Pretest Posttest Pretest Posttest
†
ICS Multiple Choice 5.2 (2.0) 5.6 (1.8) Free Response 4.8 (2.5) 6.8 (2.5)
Conditions LBT
SRL
3.7 (1.4)
4.1 (1.3)
4.8 (2.0)
4.5 (1.9)
4.3 (1.8) 8.6 (3.6)
4.4 (2.9) 9.2 (4.3)
The free response question scores for the pre- and post-test are low. This is because the students had trouble in defining terms like interdependence, chain of events and balance using precise terms. Our intervention did not directly train the students to write the definitions in precise language. The examples students provided in the post-test were more relevant, indicating that there was some improvement in their understanding of these concepts. However, a number of students had higher scores in their post tests for the LBT and SRL groups. The overall scores are still low because an equal number of students did not do well. This can be seen in the increase in standard deviation (almost double) from pre- to post-test for the LBT and SRL groups.
Measuring SRL Skills through Social Interactions in a Teachable Agent Environment
11
3.1. Student Learning Performance In this experiment, we employ two measures of learning performance: (i) gain in the multiple choice and free-response scores from pre-test to post-test (i.e., post-test score minus pre-test score), and (ii) gain in concept map scores. The concept map score was calculated as the sum of the number of correct concepts and number of correct links in a student’s map in comparison to the expert map. All links in the expert map corresponded to information in the resources on a causal relationship between two concepts, and any deviations (e.g., shortcut links bypassing an intermediate step) were considered incorrect in Betty’s quizzes (for example, when the map had short cut links, students were told that the answers were correct, but for the wrong reason), as well as in generating the concept map score. The expert map had a total of 11 concepts and 19 links, so the maximum score that a student could obtain on the map was 30. This score is both a performance measure (of progress on the assigned task) and a learning measure because the concept map is used by students to represent their knowledge acquired from the resources. The gain in concept map scores is calculated as the difference between students’ final map score and the map score at the end of session 1. Table 4 presents the gains in test and map scores by condition. Results show that the two groups that taught Betty (LBT and SRL) outperformed the ICS group on gains in both test and map scores with statistically-significant performance differences between the SRL and ICS groups. We further analyze the differences between groups on gains in the component parts of the test and map scores (i.e., multiple choice test scores, free response test scores, map concepts scores, and map links scores) with the results presented in Table 4 ‡. The gain score differences between the three groups for the multiple choice test questions are not statistically significant. However, for the free response questions, the SRL group showed greater gains than the ICS group at the p < 0.1 confidence level with a relatively large effect size of d̂ = 0.72. For the number of correct concepts in the students’ final maps, the SRL group outperformed the ICS group (p < 0.05, d̂ = 0.81), and the LBT group (p < 0.01, d̂ = 1.05). Similarly, for the number of correct links in the students’ final maps, the SRL group again outperformed the ICS and LBT groups (p < 0.05, d̂ = 0.97 and p < 0.1, d̂ = 0.72, respectively). The fact that the SRL group had higher free response and map score gains than the LBT group (although not all of the differences were statistically significant for the number of students in this study), suggests that the SRL feedback may have helped students in their learning and monitoring tasks, over and above the act of teaching.
‡
Throughout this section, all statistical comparisons of means among conditions were made with ANOVA posthoc (Tukey HSD) tests. Further, rather than use a set, arbitrary cutoff (e.g., p < 0.05) for statistical significance, we report the results for a variety of significance values (p < 0.1, p < 0.05, and p < 0.001), allowing the reader to make their own determinations based on the reported results.
12
Biswas, Jeong, Kinnebrew, Sulcer, & Roscoe
Table 4. Mean pre-to-post test and concept map score gains Gain Score Multiple Choice Free Response Map Concepts Map Links
ICS 0.4 (2.4) 1.9 (3.0) 8.1 (2.4) 12.2 (3.8)
Conditions LBT SRL 1.1 (3.1) 0.4 (1.5) 4.3 (3.2) 4.8 (4.7) 7.3 (2.7) 10.4 (3.1) 12.7 (5.3) 16.2 (4.4)
Table 5 shows the Pearson correlations between the different gain scores. The free response questions, which required students to reason about important concepts (interdependence, balance, and reasoning in causal chains), show strong (statisticallysignificant) correlations with the map scores. This correlation illustrates that the concept map is more than simply a representation of student knowledge. Rather, effective structuring of this knowledge in a causal concept map is strongly correlated with learning gains in themes like interdependence that require reasoning through causal chains. On the other hand, the multiple choice questions, which were based on definitions and single causal links, show little correlation with free response and map scores. The lack of correlation with multiple choice questions is not surprising since these questions did not require reasoning about general concepts or causal chains. It is possible that students could more easily guess the right answer to these questions. Table 5. Gain score correlations Gain Score Multiple Choice Free Response Map Concepts
Free Map Response Concepts .16 -.07 -.35a --a p < .05. bp < .001.
Map Links .13 .41a .54b
3.2. Analyzing Student Activity Patterns All student activities in the system were captured in log files. Each activity was assigned to one of five primary categories: (1) Editing§ (2) Ask Query (3) Take Quiz (4) Read Resources** (5) Check Explanation †† For each activity, the program captured additional information related to the activity. For example, when the student asked a query, the query and Betty’s response to the query were also stored in the log file. The logs also recorded a number of off-topic activities (e.g., a student adding concepts and links that were not related to the river ecosystem §
Editing covered multiple actions: adding, deleting, or modifying a concept or link in the concept map Even if the student read multiple pages at one time, it was recorded as a single read event. †† Explanations were usually delivered in multiple steps. **
Measuring SRL Skills through Social Interactions in a Teachable Agent Environment
13
domain). Sometimes students intentionally asked questions with nonsensical answers just to amuse themselves. These off-topic activities were not included in our analysis. We employ three analysis methods for studying the students’ behavior patterns. The first method analyzes the frequency of students’ activities. These results are briefly summarized in Section 3.2.1. (more details and correlations with performance are available in Roscoe et al., 2008). Our second analysis method calculates the relevance between student activities over a small window. This provides a measure of the informedness of each map editing activity and the diagnosticity of each reading, querying, explaining, or quizzing activity, based on the relevance of other recent activities. Sequences of more closely-related activities may imply the use of more coherent learning strategies, as described in Section 3.2.2. . The third analysis uses machine learning methods to derive aggregate behavior models in the form of hidden Markov models (HMMs) from students’ activity sequences. We describe the HMM approach and the results in Section 3.2.3. . 3.2.1. Analyzing Frequency of Student Activities To analyze student activities, we first consider differences in frequency of individual actions across the groups. Edit events imply map building or map refinement activities, whereas query, explanation, and quiz events are related to monitoring activities. Quiz events allow the student to check the overall correctness of the current map, using a set of queries provided by the Mentor, while Query and Explain events may be considered more advanced monitoring activities, since they involve formulating one’s own queries and then checking how an answer was generated by tracing through the map. Overall, the LBT and SRL groups were much more active than the ICS group during their learning tasks, and had significantly fewer Off-topic events. The LBT group had the most edit, read, and quiz events, which are good learning behaviors, but the SRL group showed more evidence of advanced monitoring activities (i.e., Query and Explain events). Table 6. Frequency of activities by condition Activity Edit Events Query Events Explain Events Quiz Events Read Events Off-Topic Events Total Events
Frequencies by Condition ICS LBT SRL 92.6 (26.6) 118.3 (38.9) 92.7 (29.9) 12.2 (9.3) 40.4 (20.6) 67.2 (21.3) 2.4 (2.6) 7.1 (8.4) 12.5 (8.0) 17.5 (8.1) 25.9 (15.5) 15.8 (7.5) 33.8 (18.7) 51.9 (29.3) 25.1 (11.9) 21.1 (35.5) 15.2 (28.3) 4.5 (7.3) 179.6 (44.2) 258.7 (64.2) 217.8 (51.8)
The average number of edit, query, quiz, read, and explain events by condition are listed in Table 6. On the whole, the LBT group performed many more actions than the ICS group (F2,45 = 8.41, p < .001, d̂ = 1.44). The other differences in total actions are not statistically significant. The LBT group performed more edit actions than the ICS and SRL groups (LBT > ICS, p < 0.1, d̂ = 0.77; LBT > SRL, p < 0.1, d̂ = 0.74). The LBT
14
Biswas, Jeong, Kinnebrew, Sulcer, & Roscoe
group also requested more quizzes than the SRL group (p < .05, d̂ = 0.82), but when it came to query and explanation actions, the SRL group had many more of these than the ICS and LBT groups (queries: SRL > ICS, p < .001, d̂ = 3.35, and SRL > LBT, p < .001, d̂ = 1.28; explanations: SRL > ICS, p < .001, d̂ = 1.70, and SRL > LBT, p < 0.1, d̂ = 0.66). The LBT group, on the other hand, had many more Read events (LBT > SRL, p < .002, d̂ = 1.20; LBT > ICS, p < .05, d̂ = 0.74). 3.2.2. Analyzing the Relevance and Coherence of Student Activities Although students had access to the same features (e.g., queries and explanations), not all of them used these features effectively. For example, some students used queries to check whether recent revisions to the map were correct. In other cases, students probed Betty with specific questions in an attempt to locate errors in their concept maps. These examples describe effective use of queries in support of the learning task. On the other hand, some students asked questions simply to make Betty speak, so they could make fun of her mechanical, computer-generated voice. This is clearly an ineffective use of queries for the learning task. Some students asked queries that were not related to parts of the map that they had worked on recently. In such instances, it is difficult to determine whether these querying activities can be associated with effective learning. In this section, we develop a measure based on the relevance of recent actions to estimate the effectiveness of individual student activities in their learning tasks. We assume students’ learning activities can be categorized as: (1) map building activities, which include addition, removal, and revision of concepts and links in the map; or (2) map monitoring activities, which include reading, querying, explanation, and quizzing tasks. This implies a simplified student activity model illustrated in Figure 3.
Map Building
Map Monitoring
Figure 3. Student Activity Model Each student action is assigned a relevance score that depends on the number of relevant previous actions within a pre-specified window. This score provides a measure of informedness for map building actions and, similarly, a measure of diagnosticity for map monitoring activities. Overall, the relevance score may provide a rough measure of strategy consistency or coherence over a sequence of actions. In this analysis, a prior action is considered relevant to the current action if it is related to, or operates on, one of the same map concepts or links. For example, if a student edits a link that is part of a causal chain used to answer a recent query, the query action is counted in the edit’s relevance score. The increased relevance score suggests a more informed edit because it was related to a recent query. Similarly, if a student asks a
Measuring SRL Skills through Social Interactions in a Teachable Agent Environment
15
query including a recently edited link, the edit action is counted toward the relevance score of the query, implying the student’s use of the query was diagnostic of the edited link. Because it was not clear from the trace data whether read actions were relevant, we give the student the benefit of the doubt and assume all reads are relevant. All other actions were only counted if they were related to the same portion of the concept map as the current action. For example, if a recent edit action is not part of the causal chain in a requested explanation, it is not counted toward the explain activity’s relevance score, suggesting that the student is now considering a different portion of the concept map. Frequent unrelated actions, and consequently lower relevance scores, suggest that a student may not be systematically employing map building and monitoring activities in a coherent strategy, but rather editing and testing the concept map inconsistently or at random. We employed a variety of “recent” action window sizes in analyzing the relevance of actions in this analysis. The data was analyzed for each window size from 3 to 10 actions, and all analyses showed the same statistically-significant differences between groups. Here we present the specific relevance scores for the smallest tested window size of three (i.e., the relevance score for an action is the number of relevant actions out of the previous three actions performed), which corresponds to a median time of 146 seconds between the current action and the earliest “recent” action in the window. Table 7 lists the average relevance scores for each type of action across the three groups of students. This analysis shows a number of statistically-significant differences between the groups of students. In particular, the SRL and LBT groups both had higher scores for query events than the ICS group (both, p < 0.001, d̂ = 0.36). Further, the SRL group had a higher score for explain events than the LBT group (p < .01, d̂ = 0.38). The action frequency counts in Section 3.2.1 illustrated that the groups that taught (LBT, SRL) used more probing and checking activities (primarily query actions) than the group that learned for themselves (ICS). The relevance score results in Table 7 further indicate that the LBT and SRL groups more consistently applied relevant query actions, suggesting more systematic and coherent strategies in map probing and checking than displayed by the ICS group. Moreover, the SRL group was also more focused in their use of the explanation feature than the LBT group. On the other hand, the SRL group had a lower relevance score for edit actions than the LBT group (p < 0.001, d̂ = 0.15) and the ICS group (p < 0.05, d̂ = 0.09), although the effect sizes are low. Given the SRL group’s higher map scores and more relevant probing/checking activities, it is not clear why their edit actions would be less relevant than the other two groups. Possibly the SRL group did not have to correct inconsistencies in their concept maps as frequently, resulting in more moves to a new area of the concept map when making an edit, thereby slightly lowering their relevance score.
16
Biswas, Jeong, Kinnebrew, Sulcer, & Roscoe
Table 7. Action relevance scores by group Relevance Score Edit Actions Query Actions Explain Actions Quiz Actions
ICS 1.55 (1.15) 0.96 (1.22) 2.08 (0.92) 1.76 (1.27)
Group LBT 1.62 (1.15) 1.40 (1.20) 1.77 (1.12) 1.48 (1.31)
SRL 1.45 (1.15) 1.40 (1.21) 2.15 (0.88) 1.93 (1.26)
3.2.3. Analyzing Aggregated Behaviors as Strategies using hidden Markov Models Although frequency and relevance of activities are useful measures for exploring student learning and interaction with the system, they can only capture limited, indirect information about learning strategies and internal state. We believe that employing a direct representation of internal states and related learning strategies can provide additional information useful in analyzing student learning performance. One way of representing internal states and their interactions is a hidden Markov model (HMM) (Rabiner, 1989). An HMM is a probabilistic automaton, which is made up of a set of states and probabilistic transitions (i.e., more likely transitions are assigned higher probabilities) between those states. In an HMM, the states of the model are hidden, meaning that they cannot be directly observed in the environment. Instead, they produce outputs (e.g., actions in the Betty’s Brain environment) that can be observed. Another important aspect of a probabilistic automaton like an HMM is the likelihood of starting in a given state. Together, three sets of probabilities form a complete model: (1) transition probabilities, which determine the likelihood of going from one state to another at each step; (2) state output probabilities, which define the likelihood of observing different outputs from each state; and (3) state initial probabilities, which define the likelihood that a state will be the starting state for an output sequence. Figure 4 shows a hypothetical student’s learning behaviors represented as a threestate HMM. While the three states cannot be directly observed, they can be inferred from the students’ activity sequences. We can then examine the probabilities of producing each action in a state in order to interpret the meaning of that state. For example, the information gathering state derives its name and meaning from the activities produced in that state (i.e., the state’s output), such as reading resources and taking notes. Similarly, the map building state is associated with activities that include editing concepts and links in the concept map. The monitoring state is defined by actions like making queries and taking the quiz. The transitions in the example model indicate likely sequences of actions. For example, a student will likely perform a map building action after an information gathering action with a probability of 0.6. On the other hand, the student might next perform another information gathering action (with a probability of 0.3), or, even less likely, a monitoring action (with a probability of 0.1).
Measuring SRL Skills through Social Interactions in a Teachable Agent Environment
17
30% Info Gathering
[Initial state: 80%] •Read (80%) •Take Notes (20%)
60% 10% 70%
Map Building
[Initial state: 20%] •Edit Link (85%) •Edit Concept (15%)
10% 20%
40%
20% Monitoring
[Initial state: 0%] •Query (75%) •Quiz (25%)
40%
Figure 4. Example Student HMM By providing a concise representation of student learning strategies and behaviors, HMMs have the potential of providing a higher-level view (e.g., strategies and their relationships, as opposed to simple action or sequence frequencies) of how students approach their learning tasks (Jeong and Biswas, 2008). Algorithms for learning an HMM from output sequences are well-known but require appropriate configuration/initialization parameters for effective use (Rabiner, 1989). Specifically,
Figure 5. HMMs Derived for ICS and LBT Groups
18
Biswas, Jeong, Kinnebrew, Sulcer, & Roscoe
HMM learning algorithms require an initial HMM whose parameters are then modified to maximize the likelihood of producing observed output sequences. In particular, the number of states in the HMM and their initial output probabilities can have a profound effect on the resulting, learned HMM. We have developed an algorithm that addresses these concerns in the construction of HMMs from a set of student activity sequences (Li and Biswas, 2000; 2002; Jeong and Biswas, 2008). To determine the appropriate number of states for the HMM, our algorithm employs the Bayesian information criterion (BIC) (Heckerman, Geiger, and Chickering, 1995). While using more states allows the HMM to better fit the observed activity sequences, this can also result in over-fitting the data, producing a model that does not robustly capture the student strategies and cannot generalize to future activity sequences. Moreover, larger, more complex models are more difficult to interpret in terms of the limited number of learning strategies likely to be employed by K-12 students. Therefore, the BIC balances a preference for concise models (i.e., fewer states) with a preference for better-fitting models (i.e., a greater likelihood of the model producing the observed activity sequences). This criterion may be compared to the Occam’s razor principle (simpler explanations are preferable) and allows our algorithm to strike a reasonable balance between high likelihood and low complexity of the derived HMMs (Li and Biswas, 2000; 2002). We extend the processes described in our previous
Figure 6. HMMs Derived for SRL group
Measuring SRL Skills through Social Interactions in a Teachable Agent Environment
19
work to analyze student activity trace data with HMMs in 3 steps: (1) Model Initialization: We employ a clustering algorithm to provide a set of state outputs for the initial HMM model (Li and Biswas, 2002). The model derivation algorithms are expectation-maximization algorithms, which have a tendency to converge to local maxima. Therefore, starting from a good initial model increases the chance that the algorithm will converge to the best model description. This problem is often resolved by repeatedly randomizing the initial model and then choosing the best-fitting model in an attempt to find a global maximum. However, finding the best-fitting model from the entire possible model space also runs the risk of overfitting the data and reducing the robustness of the resulting model. Rather than repeatedly randomizing initial state outputs and choosing the best-fit model generated, the clustering for initial state productions allows the model generation algorithm to explore a targeted portion of the possible model space. In particular we cluster vectors of student activities (from each step in the student activity sequences), to find similar sets of activities at different points in the sequences. The resulting clusters of activities form the initial output probabilities for each state. (2) Model Generation: This is the core step in generating an HMM, where the parameter optimization algorithms and the Baum-Welch criterion (Baum et al., 1970) are applied to the initial model to derive the optimal HMM, using the sequence data. (3) Model Interpretation: The most difficult and subjective step in the process of analyzing student activity data is interpreting the resulting HMM. In this step, we assign meaning to the derived states of the model, and generate behavior descriptions in terms of the interpreted states. We employ this method to analyze student activity sequences with HMMs for each group of students in the study. An activity sequence is generated for each student by extracting all of their activities for the five sessions from the log files. Each element of the activity sequence is labeled as one of the five primary activity types: READ (read the resources), QUER (query Betty on a portion of the map), EXPL (ask Betty to explain her answer to a query), QUIZ (ask Betty to take a quiz), and EDIT (perform an edit action). Additionally, the differences in action relevance and consistency between groups, presented in Section 3.2.2, suggest a further refinement in action labeling based on relevance score. Each of the actions is assigned a label, H (high) or L (low), from their relevance score, in order to maintain the context of the actions in sequence. For example, a QUER-H activity implies that the query the student asked is related to other activities recently performed, while a QUER-L implies that the query activity is unrelated to the students’ recent activities. The HMM models derived for the ICS, LBT, and SRL groups are shown in Figure 5 and Figure 6. The possible transitions between states are shown by arrows, and the transition probabilities are expressed as percentages. For example, the ICS behavior model indicates that there is an 84% likelihood that a student who just performed an applied reading action will next perform another applied reading action, but there is a 13% chance that the student will perform an informed editing action next. States in the models are named based on an interpretation of their outputs (activities) illustrated in Figure 7 and Figure 8. The models for the ICS and LBT groups each have three states,
20
Biswas, Jeong, Kinnebrew, Sulcer, & Roscoe
but the activities associated with some of those states differ significantly. The states are interpreted based on the activities associated with the state, and, therefore, named differently for those groups. The derived model for the SRL group has five states instead of three, and the actions associated with some of the states are quite different from the ICS and LBT states. These differences provide an interesting framework for comparing the learning behaviors between the different conditions.
Figure 7. Activities in Reading and Editing States To interpret the HMM states in each model, and differentiate among the behaviors of the three groups, we categorize states into seven different groups based on their associated activities. This categorization combines information from the basic metacognitive model in Figure 2 with the observed frequencies of actions illustrated in Figure 7 and Figure 8. The seven groups are: (1) Applied Reading – students are primarily engaged in reading the resources and applying the knowledge gained from reading to editing their maps. This state combines the information-seeking behavior of reading with some informed editing of the maps. (2) Uninformed editing – students are primarily making uninformed changes to their map, indicating the use of trial-and-error or guessing strategies. Students may spend
Measuring SRL Skills through Social Interactions in a Teachable Agent Environment
(3)
(4)
(5)
(6)
21
some time asking queries, but these activities generally do not relate directly to their editing activities. Informed editing – students are primarily making informed changes to their map based on relevant queries or quizzes. As opposed to uninformed editing, the students are using queries and quizzes to guide their edits. Uninformed and informed editing – students are primarily making changes to their map, some of which are based on relevant queries or quizzes. This state is primarily a combination of the uninformed editing and informed editing states, including situations where students are making edits relevant to recent queries and quizzes, as well as situations in which students are making edits without focusing on a single area of the map. It does not necessarily imply different ratios or patterns of informed and uninformed edits than the two separate states. Checking – students are querying and quizzing Betty to check the correctness of their concept maps. However, the queries and quizzes are unfocused, rather than relating directly to recently edited areas of the map. Therefore, this state corresponds to a weak monitoring strategy. Probing – students combine querying and quizzing with the explanation feature, which provides a trace or the chain of links that were followed to generate an answer to a question. Further, the queries, explanations, and quizzes are focused on a particular area of the map, such that their results inform map editing. This combination implies a stronger, more focused monitoring strategy than the checking state and may be evidence of metacognitive reflection on the quality of the student’s map/knowledge.
Figure 8. Activities in Checking and Probing States
22
Biswas, Jeong, Kinnebrew, Sulcer, & Roscoe
(7) Transitional probing – students perform activities similar to the probing state, but generally with lower relevance scores, suggesting that they may be transitioning to probing a different area of the concept map. In order to determine the prevalence of individual states suggested by a generated HMM, we calculate the proportion of expected state occurrences for the three groups of students. This metric employs the generated HMMs to calculate an expected value for the proportion of individual state occurrences. To simplify the calculation and maintain its relevance to the trace data, the expected value calculation is based on the length of the student activity traces. We calculate the number of state occurrences for a given HMM and activity sequence length, n, by starting with the initial state probability matrix, π, and repeatedly applying the state transition probability matrix, Λ, as shown in Equation 1. For example, for a sequence of length 1, the expected number of state occurrences are equal to the initial probabilities for the individual states. Applying the transition probability matrix once gives the expected number of state occurrences for the second step in a sequence. Applying the transition probability matrix a second time gives the expected number of state occurrences for the third step in a sequence, and so on.
Equation 1. Expected State Occurrences for Sequences of Length n The proportion of expected state occurrences is then calculated by computing this value for each sequence length observed in the student activity traces, summing the resulting values, and normalizing across the expected number of occurrences for all states, as presented in Equation 2. Note that α is the normalizing constant, T is the total number of activity traces, and lengtht is the length of activity trace t.
Equation 2. Proportion of Expected State Occurrences for an Activity Trace Table 8 presents the proportion of expected state occurrences for the three conditions, which was produced by applying Equation 2 to the generated HMMs in Figure 5 and Figure 6. Although states corresponding to editing behaviors account for a significant percentage of behaviors in all groups, the HMMs for LBT and SRL groups also show significant use of monitoring strategies. Further, the initial state probabilities of the derived HMMs indicate that only the ICS group was most likely to start their learning
Measuring SRL Skills through Social Interactions in a Teachable Agent Environment
23
activities in an editing state, while the LBT and SRL groups generally started their learning activities in the applied reading state. Another difference between groups is that the SRL HMM includes more states (based on the BIC), suggesting a greater number (and possibly greater complexity) in the set of strategies employed. Further, the activities involved in these additional states suggest use of the more advanced monitoring behavior of probing that is absent from the ICS and LBT HMMs. Section 3.2.1 noted that another clear difference between the SRL group and the others is in the greater number of explanations requested. These explanations are evident in the probing states, which likely helped the students with the SRL feedback to perform better in their learning tasks. The lack of even weak monitoring strategies apparent in the ICS HMM may explain their smaller learning gains, as evidenced by their pre- and posttest scores. Moreover, while 60% of SRL students completed their concept maps during the five sessions, only 44% of LBT students and 31% of ICS students were able to complete their concept maps. These results suggest that learning by teaching, especially with self-regulated learning and metacognitive strategy feedback, helped students learn their science content better. However, the effects of prior knowledge and determination of the most effective strategy feedback will have to be studied further. Table 8. Proportion of expected state occurrences by condition Behaviors Applied Reading Uninformed Editing Informed Editing Uninformed and Informed Editing Checking Probing Transitional Probing
ICS Proportion (%) 33 36 31 -
LBT Proportion (%) 30 60 10 -
SRL Proportion (%) 17 34 13 29 7
4. Discussion and Conclusions The Betty’s Brain system is designed to leverage the benefits of learning by teaching and causal reasoning to facilitate students’ science learning. We have hypothesized that working with Betty is helpful because it supports students’ engagement and promotes educationally-productive cognitive and metacognitive processes. The results reported here, along with prior research (e.g., Biswas, et al,, 2005; Leelawong and Biswas, 2008; Schwartz, et al., 2007), support this hypothesis. The combination of analyses provided a more complete understanding of student performance, learning, and metacognition. Overall, the ICS group showed the lowest level of concept map performance and learning gains for complex themes like interdependence and causal reasoning. They showed little evidence of metacognitive monitoring techniques or coherent focus on one topic at a time. The LBT group had higher performance and learning gains, but only employed
24
Biswas, Jeong, Kinnebrew, Sulcer, & Roscoe
limited metacognitive monitoring in the form of checking activities that relied heavily on quizzes. Finally, students’ learning and performance were strongest when the system explicitly supported their use of self-regulated learning strategies. The SRL group had the highest performance on their concept maps and the greatest learning gains on complex themes. Analysis of their behavior indicated more advanced monitoring, with probing activities including queries and explanations focused on concepts and links relevant to their recent reading and editing activities.Although assessments of learning outcomes were in agreement with our hypotheses, we used additional analyses to explore students’ actual behaviors during the teaching and learning process. In particular, patterns of student actions can elucidate the reasons that one group performed better than another and may suggest future system refinements or provide the basis for adaptive metacognitive support. Therefore, we employed three different forms of student behavior analysis using activity trace data: (1) comparing the frequency of individual activities as students worked with the system, (2) assessing the focus and coherence of student behaviors using action diagnosticity and informedness measures based on the relevance of other recent actions, and (3) a novel method for examining students’ aggregated behaviors and strategies using HMMs. Each form of analysis provides different information about students' learning strategies and requires a different level of interpretation. Frequency analysis provides a very broad view of differences between groups (e.g., students in the ICS group performed more editing and less reading than those in the LBT and SRL groups). Further, in cases where individual activities can be exclusively, or at least predominately, associated with a given learning strategy, this analysis can also illustrate differences in the prevalence of those strategies. For example, monitoring strategies may involve quizzes and queries, but querying may imply more sophisticated monitoring because the student has to formulate a query, whereas a quiz is made up of a set of pre-generated queries. Similarly, guessing strategies relied on excessive quiz taking with a combination of informed and uninformed editing (Tan, Biswas, and Schwartz, 2006, Wagster, et al., 2007). More advanced monitoring strategies (probing) required the use of explanations in combination with queries. The implication here is that the students who employed more explanation actions made attempts to trace through their map using the explanations to discover sources of error. Relevance analysis can extend the results of frequency analysis by providing an indicator of coherence or focus in student strategies. For example, students in the LBT and SRL groups not only showed higher frequency of queries than those in the ICS group, their relevance scores indicated that their queries were more relevant to previous actions, likely indicating a more focused, diagnostic use of queries. However, relevance analysis does not elucidate specific sequences or groupings of actions that could imply particular learning strategies employed under the different experimental conditions. To provide a more detailed level of information about specific learning strategies involving sets of actions, as well as the relationships between those strategies, we used a novel method of HMM generation and analysis. Further, this analysis employs action
Measuring SRL Skills through Social Interactions in a Teachable Agent Environment
25
relevance scoring as a pre-processing step to gain better insight into the manner in which actions were used in sequence. We were able to characterize states of the generated HMMs in terms of learning strategies, including self-regulated learning strategies. In particular, this analysis indicated greater use of advanced strategies by the SRL group, as compared to the LBT and ICS groups. The interpretation of the additional HMM states in the SRL group as probing behaviors also provided tentative confirmation of our hypothesis that the metacognitive feedback provided to the SRL group resulted in the use of effective self-regulated learning strategies. Further, using a measure of relative time spent in each state allowed us to analyze the extent to which a group of students relied on each strategy. It is also important to note that there is some overlap in the information provided by these three forms of analysis. For example, both the relevance analysis and HMM analysis suggested students in the SRL group employed more advanced (e.g., greater diagnosticity) monitoring strategies than the LBT group. Moreover, this overlap can provide some confirmation of the interpretations in two different analyses (e.g., both the frequency analysis and the HMM analysis indicated that students in the LBT and SRL groups relied more on monitoring strategies than the ICS group). Both the overlap and the differences among these forms of analysis suggest that applying them in concert will provide a more comprehensive and fruitful analysis of student learning behaviors than relying on any single form of analysis. In future work, we plan to refine our analyses further in order to gain a better understanding of the different strategies that middle school students employ when learning complex science topics. For example, in analyzing the generated HMMs we employed state transitions to generate an expected state occurrence measure but leave investigation of common patterns involving multiple states as future work. Further, while differences in learning and metacognition between groups are illustrated by these analyses, we leave correlation of select metacognitive measures with individual student performance and learning for future work. One of the most important next steps in this research is exploration of the generality and applicability of the presented analyses to metacognitive analysis in other learning environments. While the relevance measure can be applied to any system where a determination of inter-action relevance (e.g., by acting on the same concept or topic) is possible, and the HMM generation methodology can be applied to any set of student action sequences, the effectiveness of interpretation for other learning environments remains to be seen. Further, in future work we intend to employ clustering of individual student HMMs to improve the accuracy of our HMM analysis and use sequence mining to pre-process the trace data in the HMM analysis to maintain more of the temporal information in the aggregated behaviors of HMM states. We will also continue to enhance and analyze the effects of using behavior feedback and guidance to promote metacognitive strategies and prepare students for future learning.
26
Biswas, Jeong, Kinnebrew, Sulcer, & Roscoe
Acknowledgments This work has been supported by Dept. of ED IES grant #R305H060089, NSF REESE Award #0633856, and NSF IIS Award #0904387. References Aleven, V., McLaren, B., Roll, I., & Koedinger, K. (2006). Toward meta-cognitive tutoring: A model of help seeking with a Cognitive Tutor. International Journal of Artificial Intelligence and Education, 16, 101–128. Artzt, A. F., & Armour-Thomas, E. (1999). Cognitive model for examining teachers’ instructional practice in mathematics: A guild for facilitating teacher reflection. Educational Studies in Mathematics, 40(30), 211−335. Azevedo, R. (2005). Using Hypermedia as a Metacognitive Tool for Enhancing Student Learning? The Role of Self-Regulated Learning. Educational Psychologist, 40(4), 199−209. Azevedo, R., & Witherspoon, A. M. (2009). Self-regulated use of hypermedia. In A. Graesser, J. Dunlosky & D. Hacker (Eds.), Handbook of metacognition in education. Mahwah, NJ: Erlbaum. Bargh, J.A., & Schul, Y. (1980). On the cognitive benefits of teaching. Journal of Educational Psychology, 72(5), 593−604. Baum, L.E., Petrie T., Soules G., & Weiss, N. (1970). A maximization technique occurring in the statistical analysis of probabilistic functions of Markov chains. Ann. Math. Statist. 41(1), 164–171. Biswas, G., Schwartz, D., & Bransford, J. (2001). Technology support for complex problem solving: From SAD environments to AI. In K.D. Forbus and P.J. Feltovich (Eds.), Smart Machines in Education (pp. 71−98). Menlo Park, CA: AAAI Press. Biswas, G., Leelawong, K., Schwartz, D., & Vye, N. (2005). Learning by Teaching: A New Agent Paradigm for Educational Software. Applied Artificial Intelligence, 19, 363−392. Blair, K., Schwartz, D., Biswas, G., & Leelawong, K. (2007). Pedagogical Agents for Learning by Teaching: Teachable Agents. Educational Technology & Society: Special Issue on Pedagogical Agents. Bransford, J. D., & Schwartz, D. L. (1999). Rethinking transfer: A simple proposal with multiple implications. In A. Iran-Nejad & P. D. Pearson (Eds.), Review of Research in Education, 24, 61–101. Washington DC: American Educational Research Association. Bransford, J.D., Brown, A.L., & Cocking, R.R. (Eds.). (2000). How People Learn, expanded edition. Washington, D.C.: National Academy Press. Chi, M. T. H., Siler, S. A., Jeong, H., Yamauchi, T., & Hausmann, R. G (2001). Learning from Human Tutoring. Cognitive Science, 25(4), 471−533. Forbus, K. (1984). Qualitative Process Theory. Artificial Intelligence, 24, 85−168. Hadwin, A. F., Winne, P. H., Stockley, D. B., Nesbit, J. C., & Woszczyna, C. (2001). Context moderates students’ self-reports about how they study. Journal of Educational Psychology, 93, 477–487. Hadwin, A., Nesbit, J., Jamieson-Noel, D., Code, J., & Winne, P. (2007). Examining trace data to explore self-regulated learning. Metacognition and Learning, 2, 107–124. Heckerman, D., Geiger, D., and Chickering, D. M. (1995). A tutorial on learning with bayesian networks. Machine Learning, 20, 197-243.
Measuring SRL Skills through Social Interactions in a Teachable Agent Environment
27
Jeong, H., & Biswas, G. (2008). Mining Student Behavior Models in Learning-by-Teaching Environments. In Proceedings of The First International Conference on Educational Data Mining (pp. 127−136). Montreal, Quebec, Canada. Leelawong, K., & Biswas, G. (2008). Designing Learning by Teaching Systems: The Betty’s Brain System. International Journal of Artificial Intelligence in Education. Li, C., & Biswas, G. (2000). A Bayesian approach to temporal data clustering using hidden Markov models. In Proceedings of The International Conf. on Machine Learning (pp. 543–550). Li, C., & Biswas, G. (2002). A Bayesian Approach for Learning Hidden Markov Models from Data. Special issue on Markov Chain and Hidden Markov Models, Scientific Programming, 10, 201−219. Nicol, D.J. & Macfarlane-Dick, D. (2006). Formative assessment and selfregulated learning: a model and seven principles of good feedback practice, Studies in Higher Education, 31(2), 199–218. Novak, J. D. (1998). Learning, Creating, and Using Knowledge: Concept Maps as Facilitative Tools in Schools and Corporations. Mahwah, NJ: Lawrence Erlbaum Associations. Perry, N., & Winne, P. (2006). Learning from learning kits: Study traces of students’ self-regulated engagements with computerized content. Educational Psychology Review, 18, 211–228. Pintrich, P. R., Smith, D. A. F., Garcia, T., & Mckeachie, W. J. (1993a). Reliability and predictive validity of the Motivated Strategies for Learning Questionnaire (MSLQ). Educational and Psychological Measurement, 53, 801–813. Pintrich, P.R., Marx, R.W., and Boyle, R.A. (1993b). Beyond Cold Conceptual Change: The Role of Motivational Beliefs and Classroom Contextual Factors in the Process of Conceptual Change. Review of Educational Research, 63(2), 167-199. Pintrich, P. (2002). The Role of Metacognitive Knowledge in Learning, Teaching, and Assessing. Theory into Practice: Revising Bloom’s Taxonomy, 41(4), 219−225. Rabiner L. R. (1989). A Tutorial on Hidden Markov Models and Selected Applications in Speech Recognition. Proc. IEEE, 77(2). Roscoe, R. D., & Chi, M. (2007). Understanding tutor learning: Knowledge-building and knowledge-telling in peer tutors’ explanations and questions. Review of Educational Research, 4, 534−574. Roscoe, D., Wagster, J., & Biswas, G. (2008). Using Teachable Agent Feedback to Support Effective Learning by Teaching, In Proceedings of The Cognitive Science Conference. Washington, DC. Schraw, G., Kauffman, D.F., & Lehman, S. (2002). Self-regulated Learning Theory, In L. Nadel (Ed.) The Encyclopedia of Cognitive Science (pp. 1063−1073). London: Nature Publishing Company. Schunk, D. H. & Zimmerman, B. J. (1997).Social origins of self-regulatory competence. Educational Psychologist, 32, 195–208. Schwartz, D. L., & Martin, T. (2004). Inventing to prepare for learning: The hidden efficiency of original student production in statistics instruction. Cognition & Instruction 22, 129–184. Schwartz, D., Blair, K.P., Biswas, G. & Leelawong, K. (2007). Animations of Thought: Interactivity in the Teachable Agent Paradigm. In R. Lowe and W. Schnotz (Eds.), Learning with Animation: Research and Implications for Design (pp. 114-140). UK: Cambridge University Press. Schwartz, D.L., Chase, C., Chin, C., Oppezzo, M., Kwong, H., Okita, S., Biswas, G., Roscoe, R.D., Jeong, H., & Wagster, J.D. (2009). Interactive Metacognition: Monitoring and Regulating a
28
Biswas, Jeong, Kinnebrew, Sulcer, & Roscoe
Teachable Agent. Handbook of Metacognition in Education, Hacker, D.J., Dunlosky, J., Graesser, A.C., Routledge Press. Tan, J., Biswas, G., & Schwartz, D. (2006). Feedback for Metacognitive Support in Learning by Teaching Environments, In The 28th Annual Meeting of the Cognitive Science Society, Vancouver, Canada, 828−833. Wagster, J., Tan, J., Wu, Y., Biswas, G., & Schwartz, D. (2007). Do Learning by Teaching Environments with Metacognitive Support Help Students Develop Better Learning Behaviors? In: The 29th Annual Meeting of the Cognitive Science Society (pp. 695−700). Nashville, TN. Weinstein, C. E., Schulte, A., & Palmer, D. R. (1987). The Learning and Study Strategies Inventory. Clearwater, FL: H & H Publishing. Winne, P. H., & Jamieson-Noel, D. (2002). Exploring students’ calibration of self-reports about study tactics and achievement. Contemporary Educational Psychology, 27, 551–572. Winne, P., & Hadwin, A. (2008). The weave of motivation and self-regulated learning. In D. Schunk & B. Zimmerman (Eds.), Motivation and self-regulated learning: Theory, research, and applications (pp. 297−314). NY: Taylor & Francis. Zimmerman, B. J., and Martinez-Pons, M. (1986). Development of a structured interview for assessing student use of self-regulated learning strategies. Am. Educat. Res. J. 23: 614-628. Zimmerman, B.J. (2001). Theories of self-regulated learning and academic achievement: An overview and analysis. In B. Zimmerman & D. Schunk (Eds.), Self-regulated learning and academic achievement: Theoretical perspectives (pp. 1−37). Mawah, NJ: Erlbaum. Zimmerman, B.J. (2008). Investigating Self-Regulation and Motivation: Historical Background, Methodological Developments, and Future Prospects. American Educational Research Journal, 45(1), 166-183.
Measuring SRL Skills through Social Interactions in a Teachable Agent Environment
29
Appendix A. Selected Excerpts from the Assessment Test As part of the study, students took an assessment test before and after using the Betty’s Brain system (pre- and post-test) that included multiple choice and free response questions. The questions on the test were the same for both the pre- and post- test and were either related to the river ecosystem subject material or to causal reasoning with a concept map. Selected questions that are illustrative of the assessment test are presented below. The first page of the test provided the following introduction: Betty is a seventh grade girl who is concerned about a river near her home. Betty wants to join a science club and test the river for pollution, but first she needs to learn some important information about rivers. We would like to find out what you know about some of the things Betty is about to learn. Please answer the following questions about rivers in the space below each question. Questions 1 and 2 are examples of free response questions. There were four free response questions, and students were allowed to answer in any format by writing in the 3-4 blank lines after each question. 1. Betty's science teacher told her that interdependence among the things in the river is very important for river ecosystems. What is interdependence in a river? Please give examples. 2. The science teacher said that things are always happening in a river and this is called a chain of events. What does he mean by the phrase "chain of events?" Please give examples to show chains of events among things in a river. Questions 3 and 4 are examples of multiple-choice questions. For all of these questions, students were provided with four choices, and they were asked to circle what they thought was the correct choice. 3.
Betty's science teacher said that there are bacteria in a river, because bacteria often live in water. Betty wonders if this is a problem for the living things in the river. Please circle the answer you think is the best idea to teach Betty about bacteria in a river.
a. The bacteria in the river are there, and there is no way to get rid of them. Since algae eat bacteria during photosynthesis, when they make food, it isn't a problem for the living things in the river.
30
Biswas, Jeong, Kinnebrew, Sulcer, & Roscoe
b. The bacteria in the river are there and there is no way to get rid of them. Some bacteria break down waste products and dead organisms and turn these into nutrients that algae use during photosynthesis to make food. So bacteria help living things in the river.
c. The bacteria in the river are there and there is no way to get rid them. Bacteria are food for macroinvertebrates (aquatic insects that live in a river) that live in the river. When macroinvertebrates eat bacteria, this causes the bacteria to release carbon dioxide that algae use during photosynthesis when they make food. So bacteria help the living things in the river.
d. Bacteria are a big problem for river ecosystems. There are many different kinds of bacteria that can get in a river and they can spread disease among the living things in the river. Therefore, it is important to remove as much of the bacteria in the river so it can be clean and healthy and the living things can survive. 4. Betty's science teacher says that macroinvertebrates (aquatic insects that live in a river) are important in the food chain of a river ecosystem. Which of the following is true about macroinvertebrates?
a. They are the top predator in the food chain, so macroinvertebrates keep fish from getting too crowded in the river.
b. They eat bacteria, so macroinvertebrates keep the river clean and free from bacteria.
c. They eat algae, so macroinvertebrates keep algae from growing too crowded in the river.
d. They eat the same food that fish eat. By doing this, they make sure that there is not too much food for fish, so the number of fish does not become too many.