MEASURING SNOW MICROSTRUCTURE AND HARDNESS USING A HIGH RESOLUTION PENETROMETER Martin Schneebelr, Christine Pielmeier Swiss Federal Institute for Snow and Avalanche Research (SLF) Jerome B. Johnson U.S. Army Cold Regions Research and Engineering Laboratory-Alaska
ABSTRACT: Using a high resolution snow penetrometer we are able to measure snow penetration resistance and snow meso- and microstructure. We can show that the variation of the signal is characteristic for different snow types. The penetrometer can be used in the field as well in the laboratory. The range of snow types which can be tested extends from light new snow (50 kg m~ to very dense snow occuring on ski race tracks (500 kg m-~. The displacement resolution of the penetrometer is better than one millimeter to detect significant changes in resistance, the force signal is measured every 0.004 mm. The penetration velocity is between 6-20 mm s". A classification is developed to extract textural information of snow from the force signal. The classification is based on experiments with artifically metamorphosed snow and undisturbed snow from the Alps and Alaska. Two weak layers were identified and compared to surface sections. The new instrument makes the measurement of mechanical and stratigraphic features of a snowpack a more objective and easy task than with other methods. The high displacement resolution promises also a better identification of weak layers. KEYWORDS: snow hardness, metamorphism, snow strength, snow stratigraphy, texture 1. INTRODUCTION
.:c3~. o.
The texture of snow (Arons and Colbeck, 1995) and its associated mechanical and physical parameters are of key importance to most scientific questions dealing with snow. Examples are mechanical properties of ski tracks, avalanche formation and availability of food to animals. However, a quantitative and rapid method for measuring the texture of snow is not currently available. At present, the methods to classify snow rely heavily on the experience of the user. In addition, the discrimination of layers is often very difficult and not without personal bias. Laboratory methods (surface or translucent sections, photography of single grains) give quantitative information. However, they are time consuming and the interpretation of the snow properties is often very difficult to do because stereological methods to characterize the mechanical properties of low density materials with complicated shapes are not well developed. Sieving gives at least a quantitative grain mass distribution, but loses all
information about bonding properties. Schneebeli and Johnson (1998) developed a high resolution penetrometer to measure the stratigraphy and penetration resistance. This penetrometer has a high resolution in penetration resistance, but interpretation methods to obtain structural information were not developed. Schneebeli and Johnson (1998) reviewed also penetrometers previously developed and their shortcomings. In this paper we demonstrate that our high resolution penetrometer, with a higher measurement frequency, can delineate different snow texture types. This should enable us to measure snow texture and its mechanical properties much more objectively and rapidly.
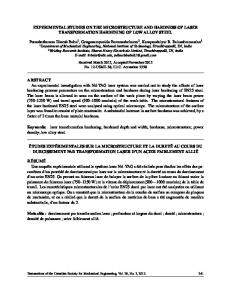
2. CONSTRUCTION The penetrometer (called SnowMicroPen) consists of a small flared measuring tip, 5 mm diameter with a 60° degree included angle (Fig. 1). This tip is connected to a high resolution force trans-
. Corresponding author address.~ Martin Schneebeli, Swiss Federal Institute for Snow and Avalanche Research (SLF), CH-7260 Davos Dorf, Switzerland; tel: +4181 417 111; fax: +41 81 417 110; email:
[email protected]
305
ducer which is housed in a drive cone and rod of 16 mm diameter. The drive rod is geared and driven by a constant speed rotary motor (Johnson and Schneebeli, 1997). The force transducer has a range from 0-500 N and a resolution of 0.01 N. The penetration velocity is 20 mm s·', but can be varied between about 5-30 mm s·'. A force measurement is acquired every 4 Ilm, independent of penetration velocity. At the most often used velocity of 20 mm s·' the sampling frequency is 5000 Hz.
can export the files in ASCII format, which can be read directly by spreadsheet programs.
Figure 1. Construction of the tip section of the penetrometer
.~
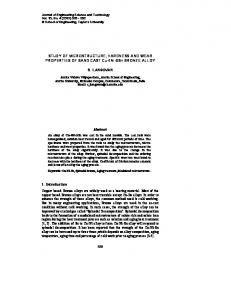
The electronics are housed in a small box. Data tranfer is via the parallel interface to a notebook computer. The data acquisition software runs 0 n the MS-DOS operating system. The motor and the drive cone (length 1.7 m) are mounted on two rods with an included 600 angle (Fig. 2). The total weight of probe and electronic box is 8.5 kg. Measurements are always taken perpendicular to the slope. This is different from the usual measurement practice using the classical rammsonde. Measurements perpendicular to the slope show less error at the interface going from a weak layer to a hard or crusty layer. The reaction force is exerted by leaning on the motor housing. Experience shows that snow layers with a hardness up to knife can be easily measured. Even harder snows can be measured using a fixed frame (laboratory version) or a specially designed sledge, which can be fixed with snow screws. One high resolution force recording of 1.5 m depth has 375'000 readings. Depending on the format of storage, this results in a file size between 750 K Byte to about 2.5 M Byte. To minimize the size of the files the numbers are stored in binary format. A custom program, which can be easily interfaced with the Info-Box program (Russi et aI., 1998) visualizes the data files and
Figure 2. Reid version of the SnowMicroPen. Visible are the motor housing (below the hand of the operator, the drive cone, the mounting rods, the electronics box and the computer (Photo: A. Roth, SLF).
3. DEFINITION OF A TEXTURAL INDEX It is well known that the mechanical properties of snow are not only dependent on density, but also much influenced by its texture. Texture is often described in terms of grain shape. During the evaluation of the penetration measurements we found that grain shape is not ideally suited to parameterize the structural changes occuring in snow. We found that the ratio of mean grain size [Ilm], determined by sieving and calculated after Friedman and Sanders (1983) divided by the density of snow [kg m'3j gives us a good measure. The calculation of the texture index is based on the idea that smaller structural elements have a decreasing ratio between mean grain size and VOlumetric density (see fig. 3). The
306
texture index is also a direct index of the volume density of bonds.
Fig 3 A cube consisting of large grains has fewer contact points than a cube of the same dimension consisting of small grains. Both cubes have the same volumetric density. The texture index (TI) of the left configuration is 3.8, while the cube on the right has a TI of 1.9.
5. CASE STUDIES The SnowMicroPen has been tested on a wide range of snows, from light new snow (50 kg m-3) to very dense snow occuring on ski race tracks (500 kg m~. We will describe in this section several case studies. The texture resolving capabilitiy is demonstrated first on two snows from Fairbanks, Alaska. The snow shown in Fig. 4 was deposited on a wooden table in an open area. Only small and reversing temperature gradients developed due to the access of air to the underside of the table. The density of the snow is 229 kg m-3, and the mean grain size, determined by sieving, is 1.9 mm.
This concept can be well adapted to snow and could be an effective tool to quantitatively measure complex interactions between grain shape and density (e.g. bond sites).
4. CORRELATION OF THE TEXTURAL INDEX TO MEASUREMENTS To correlate the texture index to the force signal of the SnowMicroPen we measured 23 different snow samples. These snow samples cover all 5 major snow classes . The texture index 11 was determined by measuring density and mean grain size by sieving. The penetration force measurements were split in sections of 1000 data points, corresponding to 4 mm of penetreted snow and the coefficient of variation (c.v.) . ' (standard deviation divided by the mean) was -'# calculated on each segment. A linear regression model resulted in the following coefficients: TI
= 1.45 + 5.72 C.v
(1)
The coefficients are highly significant (p