Measuring the Architecture Design Process Alberto Sillitti
Andrea Janes
Giancarlo Succi
Tullio Vernazza
Free University of Bolzano-Bozen Bolzano, Italy
[email protected]
Free University of Bolzano-Bozen Bolzano, Italy
[email protected]
Free University of Bolzano-Bozen Bolzano, Italy
[email protected]
DIST – Università di Genova Genova, Italy
[email protected]
Abstract – Software quality is related to both code and development process. Evaluating the quality, in order to improve it, is rather than simple. Tools for automated collection of code measures are available but the interpretation of the numbers extracted is not easy and further research is required. The evaluation of the process is even more complex due to the lack of tools for automated data collection and generation of the process model. The first phase of software development, regardless of the used methodology, is the architecture definition. The quality of the architecture affects all the subsequent phases and the shipped final product. This paper presents the use of PROM (PRO Metrics) for keeping track of the architecture design process. Keywords: business process modelling, software metrics
I. INTRODUCTION The architecture definition is the first phase of software development, if we exclude the requirements elicitation that does not deal with the low-level construction of the software but with its functional and non-function features. Even if some recent methodologies such as Agile Methodologies (AMs) [1] refuse a large architecture definition phase at the beginning of the project, this activity is spread across the whole development process. Keeping track of the architecture definition is not easy, especially in the case of the AMs due to the overlap of the development phases. Collecting data regarding this activity includes the collection of both product [7] and process metrics [4]. Tools for supporting the architecture definition, such as Rational Rose, Together Central, etc., already support the automated extraction of valuable metrics but they are unable to relate them to the effort required. Moreover, the architecture definition process includes the use of several tools other than architecture definition tools, such as office automation tools, emails, etc. The effort spent in each activity and the usage patterns of the tools are valuable information regarding the architecture definition. Usually, this information is lost due to the difficulty of keeping track of the different activities and the costs of doing that. Manual and automated data collection have both advantages and disadvantages due to their specific features. Data collected manually are always meaningful and describe the performed activities without any misunderstanding, but the grain of the data is quite large and the reliability is often low [3, 5, 6]. Automated data collection is able to produce data at a very fine grain with a high reliability due to the lack of human interaction. On the other hand, the interpretation of such data is not always easy due to the several possible
interpretations of the single piece of data. This paper describes the use of PROM [8, 9], a tool for automated data collection, to trace the architecture design process. The paper is organized as follows: section 2 presents the architecture for non-invasive metrics collection; section 3 describes the usage of the architecture during the design process; finally, section 4 draws the conclusions. II. A NON-INVASIVE METRICS COLLECTION ARCHITECTURE Collecting data in a non-invasive way is nearly impossible because some human effort is required at least in the installation and configuration process of the data collection environment. This kind of human involvement is acceptable since the task is required only ones and can be performed by the system administrator during the installation and maintenance of the regular software tools. PROM includes a set of tools for data collection designed to be non-invasive and easily extensible. To achieve these goals, the architecture includes three main components: 1. 2. 3.
a set of lightweight plug-ins a data manager utility a server
The lightweight plug-ins are simple extensions of the most popular tools such as Microsoft Office, OpenOffice, Eclipse, Visual Studio, Rational Rose, Together Central, Emacs, etc. The main features of the plug-ins are: 1.
2.
3.
Simplicity: the structure is very simple in order make their development easy and allow third parties to develop plug-ins for their favourite tools. Fine grain data collection: the data collection has to be very detailed in order to keep track of the smallest entities in the tools. As instance, the Eclipse Plug-in is able to collect time spent in each file, class, and method. Common file format: all plug-ins collect data using a common file format based on XML. The files generated in this way are stored into the user profile waiting for the transfer to the main server.
Besides, developing plug-ins for all tools available is a huge task and not all tools provide a mechanism for their extension. To address this problem there is a generic plugin able to trace all the windows opened by the operating
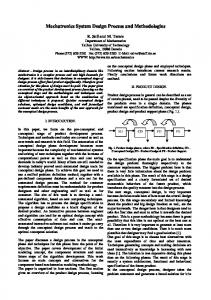
system and storing information regarding the application, the title of the window, and the time spent inside that application. This plug-in is not able to trace activities at the detail level of the specific ones but it is useful to trace application used seldom and provide a big picture. The data manager utility (Fig. 1) is a simple tool able to manage users, settings, and send data to the central server through a scheduled procedure.
Figure 2: Effort summary
Figure 1: Prom Manager
These views are only a subset the available but are enough for many people to understand how they spend their time in order to improve the efficiency of their activities. More advanced analysis such as statistics and comparisons among team members and across projects are also available.
The data manager allows several users to work with a single machine at the same time. That happens in some development techniques, such as in pair programming, and during brain storming activities which are frequent during the architecture definition. The server collects all the data generated by plug-ins and makes them available to users through different views. A customized set of views satisfies the needs of different peoples inside the development team: •
•
Developers: are interested in their own data in order to improve their efficiency, though they are able to look at their own data with a high detail level Manager: are able to access high level data through short and highly aggregated reports which are able to provide a snapshot of the project
Several interactive views are available on data in order to provide the appropriate snapshot of the status of the project for different purposes. Figure 2 shows a very high-level summary of the effort spent for a specified set of team members in a set of projects considering a timeframe. Figure 3 presents a very detailed view of all the data collected using a tree structure in order to identify visually some relations among data such as the use of a specific tool, the effort spent for each tool, and the effort spent for each artifact. PROM is able to collect also product metrics, as shown in Figure 4. The tool can collect product metrics at different stages of the development: architecture design, coding, maintenance, etc. Through this view is possible to understand how these metrics evolve during the whole life of a product.
Figure 3: Detailed effort data
As described, the PROM system is able to collect very detailed data regarding the development process, which includes not only the coding phase but also all the phases in which a computer-based tool is used.
human aid is a key success factor for this kind of data collection. IV. CONCLUSIONS
Figure 4: Product metrics detail
III. COLLECTIONG DATA An automated data collection tool is able to keep track of artifacts in a very detailed way even considering seconds. On the other hand, such data are more difficult to manage compared to manual ones. Even if manual data are less precise an often unreliable, humans are able to trace their activities in a more precise way. Being aware that some data comes from specific tools can help to identity the performed activity. As instance, the use of tools for design such as Rational Rose, Together Central, etc. is an important clue that can identify, with a high level of confidence, the activity performed. Although, in several cases, the collection of data related to a specific tool is not enough to identify the performed activity. As instance, team members can use a word processor to perform different activities; therefore, the information regarding the used tool is not enough. The same problem, but in a different context, is present in many companies: to implement the Activity-based Costing accounting technique [2]. A common way to address this problem is the use of unique and standardized (at company level) codes for activities. This approach also fit the automated data collection tool that is able to identify user-defined codes inside file names or in some document properties. Moreover, the PROM system is designed to collect data regarding the activity performed also using specific document templates. Advanced office automation tools enable users to specify one or more templates for a specific document. A template usually includes predefined layout or it could be only an empty document with some properties. This last case is relevant for the automated data collection due to the possibility of identifying activities easily through this kind of embedded information. In some cases, automated tools can identity activities analyzing artifacts that are compliant with some userdefined standard. As instance, a developer working with a class that includes the substring test in the name is likely to perform some testing activity. As shown, automated systems find the identification of activities a complex task that is hard to perform automatically in every scenario. The use of a limited
This paper presented a way to approach the automated collection of process and product metrics. A complete automated environment is able to collect detailed data but the related meaning is not always easy to find out. A limited human support (using templates or activity codes) highly improve the ability of the system to identify different activities and provide a more reliable snapshot of the status of a project. This paper has shown how to use PROM for keeping track of the architecture design process through the collection of relevant data without any human interaction. Future work includes the comparison of the data collected automatically with data collected manually in order to find out the reliability of the data and their quality. V. ACKNOWLEDGMENTS This work has been co-funded by the Italian Government through the Founds for Basic Research (MAPS project, an Italian acronym for Agile Methodologies for Software Production). We would like to thank out project partners for their stimulating input. VI. REFERENCES [1] K. Beck, M. Beedle, A. Bennekum, A. Cockburn, W. Cunningham, M. Fowler, J. Grenning, J. Highsmith, A. Hunt, R. Jeffries, J. Kern, B. Marick, R. Martin, S. Mellor, K. Schwaber, J. Sutherland, D. Thomas Manifesto for Agile Software Development, 2001, available at http://agilemanifesto.org/ [2] G. Cokins, Activity-based Cost Management: An Executive’s Guide, John Wiley & Sons, 2001. [3] A.M. Disney, P.M. Johnson, “Investigating Data Quality Problems in the PSP”, Sixth International Symposium on the Foundations of Software Engineering (SIGSOFT'98), Orlando, FL, USA, November 1998. [4] W. Humphrey, A Discipline for Software Engineering, Addison-Wesley, 1995. [5] P.M. Johnson, “You can’t even ask them to push a button: Toward ubiquitous, developer-centric, empirical software engineering”, The NSF Workshop for New Visions for Software Design and Productivity: Research and Applications, Nashville, TN, USA, December 2001. [6] P.M. Johnson, A.M. Disney, “A critical analysis of PSP data quality: Results from a case study”, Journal of Empirical Software Engineering, December 1999. [7] N.E. Fenton, S.H. Pfleeger, Software Metrics: a Rigorous and Practical Approach, Thomson Computer Press, 1994. [8] A, Sillitti, A. Janes, G. Succi, T. Vernazza, “Collecting, Integrating and Analyzing Software Metrics and Personal Software Process Data”, EUROMINCRO 2003, Belek-Antalya, Turkey, 1 - 6 September 2003. [9] A. Sillitti, A. Janes, G. Succi, T. Vernazza, “Measures
for Mobile Users: an Architecture”, Journal of System Architectures, to appear in 2004.