tial object: Object-based properties are properties which refer to the object .... rameters are the distances between a vertex and any edge of the polygon, the angles between consecutive edges, the area of the polygon, and the center of gravity.
Measuring the Complexity of Polygonal Objects Thomas Brinkhoff Hans-Peter Kriegel Ralf Schneider Alexander Braun Institute for Computer Science, University of Munich Leopoldstr. 11 B, D-80802 München, Germany e-mail: {brink,kriegel,ralf,braun}@informatik.uni-muenchen.de Abstract Polygonal objects are characterized by the following well-known parameters: number of vertices, area, perimeter and so on. These parameters describe the data sets that are used in benchmarks and experimental as well as analytical performance comparisons of data structures and algorithms in the area of spatial database systems. Also, a spatial query optimizer should be based on a cost model depending on these parameters. The scope of this paper is to demonstrate the importance and usefulness of parameters describing the complexity of a spatial object. Obviously, complexity is an intuitive term. Therefore, we have to ask: What does “complex” mean? Starting with a basic set of parameters describing a polygon and a set of intuitive lingual properties, we develop a complexity model consisting of three quantitative parameters. In a further step, these parameters are condensed into one measure of complexity. Using real cartographical maps, we document the suitability of our approach by three applications. 1. It distinguishes a wider range of more and less complex objects and is more intuitive than the fractal dimension. 2. The cost for answering the point-in-polygon test depends on the degree of complexity and not on the number of vertices of a polygon when the TR*-tree is used as a spatial data structure. 3. Using our complexity parameter, we detected special features in the data sets of the SEQUOIA 2000 storage benchmark.
1 Introduction In the last decade, geographic information systems (GISs) as well as spatial database systems (spatial DBSs) have been gaining increasing importance in research. Therefore, several research groups have developed various concepts, data structures and algorithms for improving the handling and the efficiency of these systems. Examples for such developments are user interfaces, system design, spatial indexing, topological data structures, map overlay algorithms and so on. An important problem for many of the proposed concepts is the evaluation of their performance. Two basic types of performance evaluations can be distinguished: analytical and experimental evaluations. For both approaches the data objects are essential. A meaningful analysis needs assumptions about the data, for instance about the size of the objects, about their complexity, their distribution, their accuracy, etc. Such assumptions are the fundamental basis for a cost model and they essentially determine the results of the analysis. In experimental frameworks, test data are synthetically generated or are taken from real applications. In [KHS 91] and [BKS 93]
for example, we compare different techniques for improving the performance of query processing in spatial DBSs by experiments using real cartographical maps. However, for an assessment of the tests and their results as well as for comparability, a measure is necessary that characterizes the data. For example, some spatial access methods are suitable for uniformly distributed data, but loose their performance for highly correlated data. In this case, a measure for characterizing the distribution of the objects in the data space is needed. For a systematic development of a standardized benchmark ([KSSS 89] or the SEQUOIA 2000 storage benchmark [SFGM 93]), or other experimental or analytical evaluations, it is necessary to present a significant numerical characterization of the investigated data objects. For GIS and spatial DBSs the properties of spatial objects must be formally described. Especially for more complex spatial objects represented by composed objects such as polygons, a short numerical description of their properties is a difficult task. The existing knowledge about the characteristics of spatial data is vague. For example, Crain [Cra 90] gives a quantitative estimation of different spatial databases. A survey on the properties of geographic data can be found in [Fra 91]. The statements of such papers are, however, rather vague in order to include a wide range of data sets. Because suitable descriptions of spatial objects are missing, the statements in the literature are very general (“... most of the rectangles are small, and only a minority are large ...”) or consist of a large set of parameters which are not intuitively comprehensible. A theoretical characterization of polygonal objects is the fractal dimension that describes the self-similarity of objects (see [Man 77]). In this paper, we suggest a model for the description of the complexity of a polygonal object that fundamentally differs from the fractal dimension. For comparability and reproducibility of experimental and analytical results, it is necessary to characterize the complexity of concrete polygons. A measure of complexity could help to answer the following questions: Is the acquisition of a GIS with known performance for specific data sets a good choice in view of the data sets actually used? Are two results of performance tests comparable, even if they do not use the same database? Do variations of the complexity parameter influence the performance of data structures and algorithms? Complexity is an intuitive term. In order to obtain a description of complexity, we have to ask: What does “complex” mean? Our goal is to come up with a small set of quantitative parameters which characterizes the complexity of a polygonal object. In a further step, the obtained parameters are condensed into one parameter which allows a classification of the polygon. The classification facilitates and defines an individual qualitative interpretation of the complexity. There exists a large literature on measuring the complexity of shapes with respect to natural phenomena - see [Bur 86] for an overview. In contrast to those papers, we concentrate on the polygonal representation of a spatial object and neglect the fact that the polygon is only a rough approximation of a real spatial object. This limitation
is motivated by the fact that we want to use the measure for query processing and optimization in spatial databases where the complexity of the natural phenomena is of secondary significance. The paper is organized as follows. First, we generally describe the analysis of spatial objects. In section 3, we propose our model for the description of the complexity of a simple polygon and design our complexity measure. Next, we compute and interpret the complexity parameter for different sets of real-world data and compare it to the fractal dimension. Section 6 will demonstrate the usefulness of our approach by using it for a performance evaluation of spatial data structures and for detecting specific features in the data sets of the SEQUOIA 2000 storage benchmark. The paper concludes with a short summary and some suggestions for future work.
2 Spatial Objects and the Analysis of Intuitive Properties The objects stored in a spatial DBS or GIS are characterized by a spatial and a thematic component. The spatial component describes the spatial locality and the shape of the modeled part of the real world. In the vector model, the spatial component of an object is represented by basic topological elements like point, line, and area. In this paper, we concentrate on areas. Representations for areas are simple polygons where other simple polygons may be cut out. A polygon is simple if there exists no pair of non-consecutive edges sharing a point. The class of simple polygons is well suited for geographic applications and allows areas to be represented with arbitrary precision. We distinguish the object-based and map-based properties of a spatial object: Object-based properties are properties which refer to the object without considering its position in the data space or other objects in the same or in other databases. Object-based properties can be computed by inspecting single objects. They are independent of rotation and translation. Map-based properties consider the spatial location of the object. This allows an expression of the relation to other objects in the same database (map). Typical examples for map-based properties are the number of adjacent polygons and the distribution of the spatial objects in the data space. For computing the complexity of a single spatial object, our investigation only needs to inspect object-based properties. In order to obtain a description of the complexity of a spatial object, we must perform an appropriate analysis. Complexity is an intuitive property. Therefore, lingual descriptions dominate and a wide spectrum of possible and reasonable parameters exists for its description. The goal of our analysis is to get a short and significant description of the complexity by quantitative parameters. For instance, a human being characterizes the shape of a spatial object as the “form of an ellipse”. In order to compute a similar statement, we may calculate the difference between the area of the object and the area of its minimum bounding ellipse and normalize the result to the object area. If the result is smaller than a fixed threshold, we confirm the statement that the object has the shape of an ellipse. For a suitable model of an intuitive property, it is essential to condense the information into one or a few comparable parameters. Therefore, it is important to minimize the redundancy between the parameters. However, it is very difficult to fulfill this demand for the description of real-world objects. As a consequence of the widespread spectrum of possible shapes of real-world objects, different parameters derive nearly equivalent statements, even if the starting points are absolutely different. Our first step will be the derivation of a set of basic parameters from a simple polygon. We will extract this set from the atomic parts of the polygon. Therefore, this basic set will have a fundamental quality. As pointed out before, our goal is to gain a quantitative and qualitative measurement of the complexity of a spatial object. Obviously, there is a big gap between the lingual description and a parameter such as the number of vertices of a polygon. For detect-
ing complex characteristics, we need higher levels of classification and interpretation. Thus, we have to collect and to analyze the attributes of an intuitive description and transform them into a formal system. This second step refines the intuitive lingual attributes into quantifiable attributes which concern disjunct aspects of the objects. This analytical approach ensures the high correlation of the semantic aspect of a parameter with the intuitive analysis. The second step yields quantitative attributes which can be synthesized from the basic set of parameters. By generating these descriptive parameters, we have to perform suitable transformations in order to normalize the parameters to specified ranges. This is necessary for the following qualitative interpretation and the comparability between different objects. Figure 1 depicts this generation process. As a result we obtain the complexity model. intuitive lingual attributes
analysis quantifiable attributes
semantic gap
filled up by the
basic set of descriptive parameters
parameters of the complexity model describing parameters
synthesis
Figure 1: Process of generating the parameters of the complexity
3 The Complexity Model We divide the parameters of our analysis into two classes: 1.) the basic set of descriptive parameters 2.) the parameters of the complexity model In this section, we discuss the derivation of the parameters of the complexity model in detail. The basic set of descriptive parameters is the starting point of the discussion.
3.1 Basic set of descriptive parameters The atomic structure of a simple polygon consists of vertices and edges. A structural description of simple polygons is based on these components. More complex parameters are derived from these descriptive parameters. Structural parameters Structural parameters are independent from the coordinate system of the data space. The most fundamental structural parameter of a polygon is the number of vertices. Additionally, we discuss two other parameters: the number of changes of direction and the number of notches. The order in the sequence of vertices unambiguously determines the successor and the predecessor of a vertex. Considering three consecutive vertices, i.e. two consecutive edges, the second edge is left- or right-directed compared to the first edge. If a left-directed edge follows a right-directed one or vice versa, this situation will be called a change of direction. Figure 2 depicts different situations where changes of directions occur or do not occur. left-right rightdirected
leftdirected
right-left
changes of direction no changes of directions Figure 2: Examples for changes of direction. Let us assume that the vertices are ordered clockwise. In this case, each left-directed edge indicates a part of the polygon which
is not convex. Such a vertex, where the interior angle is larger than π, is called notch. right notch right
left right >π right
right polygon with a notch no notch = convex polygon Figure 3: Example of a notch.
Metric parameters Metric parameters are based on a defined distance between two points of the data space. The length of an edge is the distance between the two affiliated vertices. The sum of the lengths of all polygon edges defines the perimeter of the polygon. Other metric parameters are the distances between a vertex and any edge of the polygon, the angles between consecutive edges, the area of the polygon, and the center of gravity. Statistical parameters In two cases, we can use statistical methods for a further analysis: • If the parameter consists of a set of values, we can derive additional parameters, e.g. the average length of edges. • The parameters discussed above belong to one single object. Analyzing a set of objects (e.g. a special map), we obtain sets of values for each parameter. The goal of an analysis is to concentrate the properties of the objects into one or only few values. Therefore, it is necessary to summarize them by statistical methods such as the computation of the minimum value, the maximum value, the mean value, and the standard deviation.
they will be discussed in more detail. Finally, one single parameter is derived which describes the complexity of a spatial object. Frequency of the vibration Notches describe the non-convex parts of a polygon. The maximum number of notches that occur on a polygon pol depend on its number of vertices. If notches and vertices describe the number of vertices and the number of notches, respectively, the following property will hold: notches (pol) ≤ vertices (pol) - 3 Therefore, the number of notches can be normalized to the interval [0,1] by notches ( pol ) notches norm ( pol ) = -------------------------------------------vertices ( pol ) – 3 The edges of polygons with a high frequency of the vibration change their direction very often. In extreme cases, every edge has a direction different from that of its predecessor. In this case 0.5 ⋅ vertices(pol) notches exist and notchesnorm is about 0.5. The fewer notches that occur, the smoother the boundary is. If notchesnorm is 0, the polygon is convex. Similar to low values of notchesnorm, high values indicate a smooth boundary. These properties of notchesnorm suggest that it is used as a basis for a measure of the frequency of the vibration. Figure 5 depicts polygons with different values of notchesnorm.
notchesnorm = 0
3.2 The derivation of the parameters of the complexity model A human being uses different attributes for describing the size or the shape of a simple polygon. When asking someone you will hear adjectives like “big, small, round” and so on. For the computation of the properties of spatial objects, we have to specify these qualitative and inaccurate terms more precisely. Our question is: “What does ‘complex’ mean?”. In order to answer this question, we will analyze the term ‘complexity’. This analysis is refined step by step until a sufficient formalization is achieved. Two factors are decisive for the intuitive rating of the complexity of a spatial object: the global shape of the object and the (local) vibration of its boundary. Note that the local vibration is independent of the global shape of the object. Figure 4 demonstrates this effect by an example.
object 1a
object 1b
object 2a
object 2b
Figure 4: Global shape and local vibration of objects. The objects 1a and 1b have the form of a rectangle, i.e. their global shape is rather simple. A local consideration, like using a magnifier, shows the differences. Object 1b is dithering, while 1a stays calm. In contrast to the object 1a and 1b, the objects 2a and 2b look much more complex but also differ in the vibration of their boundary. The more complex the global shape and local vibration, the more complex the considered object is. In this section, two measures are distinguished for the vibration: its frequency and its amplitude. In order to describe the global shape of an object, we additionally introduce the deviation of the object from its convex hull. These aspects are the starting point for our investigation. In the following section
14 notchesnorm = --------------- = 0.93 18 – 3 7 notchesnorm = --------------- = 0.63 14 – 3
Figure 5: Polygons with different values of notchesnorm. In order to obtain a parameter with a low frequency of vibration close to 0 and a high frequency close to 1, we have to transform notchesnorm. The polygons show the highest vibration when notchesnorm is about 0.5 and the lowest vibration for values of 0 and 1. The resulting curve should show a smooth behavior between these values. The following definition of freq fulfills these requirements: freq(pol) = 16(notchesnorm(pol)-0.5)4 - 8(notchesnorm(pol)-0.5)2 + 1 Amplitude of the vibration The frequency of the vibration makes no statement with respect to the intensity of the vibration. In order to quantify this amplitude, we investigate the increase of the boundary of the polygon compared to the boundary of its convex hull. Let us motivate this type of measure by considering the possible connections between two points: A straight line is the smoothest and shortest connection. A more complex connection always indicates a longer connection. We define the relative increase of the boundary ampl as follows: boundary ( pol ) – boundary ( convexhull ( pol ) ) ampl ( pol ) = ----------------------------------------------------------------------------------------------------------------boundary ( pol ) If the polygon is convex, ampl will be 0. The higher the amplitude is, the longer the boundary is and the higher ampl is. 1 is the unreachable limit of ampl. The highest value of ampl occurring in our geographic data sets is about 0.8. Figure 6 shows some examples. Föhr Khalkidhiki Isle of Lewis
ampl = 0.02
ampl = 0.50
ampl = 0.60
Figure 6: Geographic objects and their relative increase of boundary.
Deviation from the convex hull The two parameters introduced before describe the local vibration of a spatial object. The global shape of a spatial object is however another aspect that intuitively influences the rating of the complexity of the spatial object. In order to obtain a measure for this type of global complexity, we use the convex hull of the polygon again. From this point of view, a convex polygon has a very simple shape, whereas a polygon which strongly differs from its convex hull is considered to have a complex shape. We measure the convexity of a polygon with the following formula: area ( convexhull ( pol ) ) – area ( pol ) conv ( pol ) = -------------------------------------------------------------------------------------------area ( convexhull ( pol ) )
of this class. In the first row, the objects of the first class are depicted (i.e. objects of the class with the lowest values of compl), in the second row those of the second class, and so on. These examples impressively illustrate the properties of compl class 6:
class 5:
conv is 0 for a convex polygon. The higher the deviation of the polygon from its convex hull, the higher conv is. In extreme cases, conv is close to 1. Figure 7 shows some examples. Föhr
Khalkidhiki
conv = 0.04
conv = 0.47
Isle of Lewis
conv = 0.28
Figure 7: Geographic objects and their convexity.
3.3 The complexity of a spatial object In section 3.2 we suggested three parameters for describing the complexity of a spatial object. The goal of this section is to derive a condensed measure that consists of only one parameter. Such a single value allows us to classify the spatial objects according to a uniform scale. For combining the three parameters freq, ampl, and conv, a weight must be assigned to each of these parameters. According to our observations, the relative increase of the boundary (ampl) has the most significant correlation to an intuitive estimation of the complexity of a polygon. The higher the local vibration and the more complicated the shape of the object, the higher the value of ampl is. A simple meandering or a spiral object, however, also shows a high increase of the boundary. Therefore, we have to combine ampl with freq. Only if both parameters are high, the complexity of the object should be high too. For this purpose, ampl is multiplied by freq. ampl and freq consider the vibration of the boundary but not the global shape of the object. The complexity of the shape is expressed by the parameter conv. Experimental investigations demonstrate that this parameter allows us to distinguish the complexity of objects with similar values of ampl ⋅ freq. Therefore, we use it to refine the results obtained by ampl ⋅ freq and assign a considerably smaller weight to conv than to ampl ⋅ freq. Based on these considerations, we define the complexity of a polygon compl(pol) as follows: compl(pol) = 0.8 ⋅ ampl(pol) ⋅ freq(pol) + 0.2 ⋅ conv(pol) compl is in the interval [0,1]. Values close to 0 indicate a simple convex object whereas values larger than 0.4 occur for very complex objects. Of course, this combination of the parameters freq, ampl, and conv is arbitrary and other arrangements are possible. However, the following sections will demonstrate that this combination is suitable for different applications. Nevertheless, everybody is free to use other combinations which are more suitable for his or her specific requirements. Figure 4 depicts the computed complexity of geographic objects from a map representing the counties of Europe (see Table 1 in section 4). The objects were selected as follows: We computed the complexity compl for all 810 polygons and divided the objects into 6 classes according to compl. Then, for each class, five objects were selected whose complexity values are the closest to the mean value
class 4:
class 3:
class 2:
class 1: 1.0
1.0
1.0
0.9
0.8
0.8
0.6
0.6
0.4
0.4
0.5
0.2
0.2
0.4
0.0
0.0
0.8
1.0 0.8 0.6
0.7 0.6
0.0
0.1
0.2
0.3
0.4
freq
0.5
0.6
ampl
0.4 0.2 0.0
0.1
0.2
ampl
conv
0.3
0.4
0.5
conv
freq
Figure 10: Correlation between the parameters of the complexity model
4.2 Analysing maps Figure 8: Various spatial objects of the map Europe according to compl
4 Investigation of the Complexity Model Now, we start the investigation of the complexity model using real cartographical data. We use maps from different sources with diverse resolutions. The data files contain natural objects such as islands and lakes as well as administrative areas such as counties. Figure 9 depicts the maps and Table 1 lists their main characteristics. N is the number of the polygons in the maps and nØ is the average number of vertices of a polygon. Europe
Africa
min=0,0
BW
max=0,60
Lakes & Islands
subject
0,60
µ=0,18 σ=0,11 0,4
Figure 9: The analysed maps name of the map
In this section, we analyze the complexity of the four maps presented in Figure 9 and Table 1. Figure 11 depicts the computed complexities. The objects are sorted according to the computed value of compl. This type of representation allows us to depict all computed values and gives a good survey of the distribution of compl within one map. Additionally, the minimum value (min), the maximum value (max), the mean value (µ), and the standard deviation (σ) of compl are reported for each map.
N
0,1 n∅
source
30%
percentage of objects
98%
Europe
Europe
counties of Europe
810
84
[Sta 90]
BW
municipalities of Baden1315 Württemberg
572
[Lan 91]
Lakes & Islands
lakes and islands of Africa
1253
120
[GC 87]
Africa
countries of Africa
104
2769
[GC 87]
Table 1: The main characteristics of the analysed maps
4.1 Investigation of correlation In section 2, we postulated to minimize the redundancy between the parameters of the complexity model. Therefore, we first investigate the correlation between these parameters for the map Europe. The left diagram of figure 10 depicts the dependency of freq and conv from ampl and the right diagram the dependency of ampl and freq from conv. Except from low values of ampl and conv (i.e. except from very simple objects), we can observe no correlation between the parameters. This observation is confirmed by low correlation coefficients (0 to 0.3) for maps where the simple objects are omitted. Thus, it is reasonable to use all three parameters in our complexity model
min=0,0 max=0,74 µ=0,09 σ=0,12
0,74
0,4 0,1 percentage of objects
70%
98%
Lakes & Islands
min=0,0 max=0,55 µ=0,25 σ=0,10
0,55
0,4 0,1 10%
percentage of objects
BW
96%
in the following. Figure 12 shows an example for the box-counting technique.
min=1,79*10-2 max=0,51 µ=0,19 σ=0,11
log(N(s)) 0,51 Db = slope of this line
0,4
log(1/s)
0,1 25%
percentage of objects
Figure 12: Example for the box-counting technique.
94%
Africa Figure 11: Computed complexities The investigations show two distinct thresholds: a complexity of 0.1 means the transition from an intuitively simple object to a more complex object and objects with a complexity of more than 0.4 are very complex. Therefore, the percentages of objects with a complexity of less than 0.1 and less than 0.4 are depicted in figure 11. Three of the analyzed maps (Europe, BW, and Africa) consist of administrative areas. Although they differ considerably in other characteristics (e.g. the source and the average number of vertices per polygon), the three corresponding curves demonstrate a similar behavior: Only a small percentage of the objects (between 10 and 30%) can be classified as very simple. Most of the objects (between 68 and 86%) exhibit a complexity of more than 0.1 and less than 0.4. Therefore, the corresponding curves start with middle to high gradients and then grow flatter. Only a small percentage of objects is very complex: between 2 and 6% have a complexity of more than 0.4. These objects are however considerably more complex than the average. Consequently, the curves show very high gradients for these objects. The map Lakes and Islands, which exclusively consists of natural objects, shows a completely different behavior. Because of the high ratio of very small islands and lakes, most of the objects have a simple shape and a low complexity; for 70% of the objects the complexity is less 0.1. Overall, the curve shows an exponential behavior. Another property of this map is remarkable. The maximum complexity is higher than for the other maps. In other words, the range of complexity is higher for natural objects than for artificial ones such as counties and municipalities. Overall, these and other tests confirm the suitability of our complexity model for analyzing spatial data.
5 Comparison between Complexity compl and Fractal Dimension A well-known technique for characterizing natural objects is the fractal dimension [Man 77]. The fractal dimension describes the self-similarity of objects. There are several techniques for estimating the fractal dimension of natural objects. For estimating the fractal dimension of artificial or digitized objects, the box-counting technique is most popular ([PJS 92], [FK 94]): The data space is divided by a regular grid with grid size s. For counting the cells occupied by the polygon, we can use two different approaches: we can count the number of cells containing a vertex of the polygon or the number of cells intersected by an edge of the polygon. In the following, we will use the first approach because it produces better results than the second technique [Rüt 95]. This number depends on the size of the cells. Therefore, it is denoted by N(s). Now, we compute N(s) for different sizes s and plot the results in a log(N(s)) / log(1/s)-diagram. Then, we try to approximate to the plotted points of the diagram by a straight line and measure its slope Db. This number is the box-counting dimension, a special form of Mandelbrot’s fractal dimension. It will be called fractal dimension for short
Investigating real cartographical data, one serious problem occurs when the fractal dimension is computed: for polygons with a small number of vertices, only few plotted points of the diagram can be used to determine Db. In such cases, Db is almost arbitrary and an inaccurate estimate for the complexity of an object. As a consequence, we can postulate that the fractal dimension is not an adequate measure for the complexity of coarsely digitized objects, in contrast to our complexity measure. In order to perform a comparison of the fractal dimension and compl, in the following experiment we restricted the Europe map to objects where at least 5 successive points can be used for computing Db (s is halved in each step). 70 objects (of 810) remain in the map. For these objects, we computed the complexity compl and the fractal dimension Db. Similar to Abschnitt 3.3, we divided the objects into 5 classes according to Db. Each class i contains objects of a higher complexity than the class i – 1 . For each class, four objects were selected whose complexity values are closest to the median of this class. Figure 13 shows the selected objects using Db. In Figure 13, some objects additionally have arrows pointing up or down. An arrow pointing up denotes that the object would be classified one class higher if compl was used to compute the complexity; three arrows pointing down denote that the object would be classified three classes lower and so on. We can observe that most objects are similarly classified using Db or compl. However, some objects extremely deviate in their classification (e.g. the objects 1.4, 3.4, 4.2, 4.3, and 5.3). One major reason is that the global shape has no influence on the fractal dimension. This statement is confirmed by an investigation of the correlation between the fractal dimension and the parameters of compl: the correlation coefficient for Db and ampl⋅freq is 0.63, but for conv (the deviation from the convex hull) it is only 0.19. Overall, we can summarize that the complexity measure compl shows a different behavior than the fractal dimension because it takes the global shape of objects into account. Due to problems of computing the fractal dimension for polygons with a small number of vertices, it is also applicable to a wider range of objects.
class 5:
class 4:
5.1
4.1
5.2
4.2
5.3
4.3
5.4
4.4
.
class 3:
class 2:
class 1:
3.1
2.1
1.1
3.2
2.2
1.2
3.3
3.4
2.3
2.4
1.3
1.4
completely transferred into main memory when the complete polygon is required for a geometric operation. In particular, it is not required to build up the TR*-tree in main memory or to convert its pointers. The height of a TR*-tree grows logarithmically in the number of objects. TR*-trees have to allow overlap in their nonleaf nodes, i.e. rectangles of different entries may have a common intersection. The main characteristic of the structure of the TR*tree is its small maximum number of entries per node which reduces the number of main memory operations. Figure 14 depicts the different levels of a TR*-tree that organizes the trapezoids describing the state of Bavaria.
root level
level 3
level 2
Figure 13: Spatial objects of the restricted map Europe according to the fractal dimension Db.
6 Applications of the Complexity Measure level 4
In this section, we will discuss several applications of the complexity measure compl.
An approved technique for performing geometry tests is based on the following paradigm ([SK 91], [BKSS 94]): In order to support time-intensive spatial queries, time and storage is invested in the representation of the spatial objects in order to shift time requirements from query processing to update and restructuring operations. Due to the complexity of the objects and due to the selectivity of spatial queries, a decomposition representation of the objects is suitable to support efficient spatial query processing [KHS 91]. An approved technique is to decompose the spatial objects into trapezoids [AA 83] (see figure 14). The main advantage of trapezoids is that single trapezoids as well as sets of trapezoids can accurately be approximated by minimum bounding rectangles. Such a decomposition approach consists of a single preprocessing step at object insertion time. This preprocessing simplifies spatial query processing because the decomposition substitutes the execution of one complex computational geometry algorithm by multiple executions of fast algorithms applied to simple trapezoids. Thus, performing a query on a single complex object is replaced by performing the query on a set of simple objects. The success of the decomposition approach depends on the ability to quickly narrow down the set of trapezoids that are affected by spatial queries and operations. In order to decide which trapezoids are relevant for a particular geometric test, we need an efficient data structure that organizes the trapezoids of one object with respect to their location. For spatial database systems, the R*-tree [BKSS 90] is an efficient spatial data structure. However, the R*-tree was designed as a spatial access method for secondary storage. Therefore, we developed the TR*-tree [SK 91] which is designed to reduce main memory operations and to store the trapezoids of one decomposed object. The data structure and the algorithms of the R*-tree and the TR*tree are rather similar: A non-leaf node of a TR*-tree contains entries of the form (rect, ref) where ref is the address of a child node and rect is the minimum bounding rectangle of all trapezoids stored in this child node. A leaf node contains trapezoids (trap) as entries. The TR*-tree is persistently stored on secondary storage and is
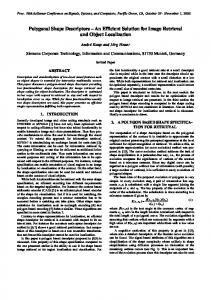
Figure 14: TR*-tree representation of Bavaria Using the TR*-tree the point-in-polygon test is answered by performing a point query on this spatial data structure. A point query on the TR*-tree, i.e. the test whether a query point is contained by a trapezoid or not, determines on the non-leaf node level all rectangles of the node containing the query point (rectangle tests). For each of these rectangles, all corresponding subtrees are recursively tested. If the query accesses a leaf node, the inclusion test is performed for the trapezoids (trapezoid test). The query stops successfully when a trapezoid is found containing the query point. If no trapezoid is found in the TR*-tree, the point query has a negative result. For real geometric objects, the TR*-tree permits nearly logarithmic searching for a point query, but - due to the overlap within its directory - the search is not restricted to one path and thus logarithmic search time cannot be guaranteed. In the worst case, O(n) time is necessary for a point query, where n denotes the number of trapezoids. An experimental investigation of point queries on TR*trees is therefore of special interest. Figure 15 shows the results of an investigation of point queries on the map Europe. 500 successful and 500 unsuccessful point queries were performed for each polygon. In the successful case, the query points are uniformly distributed over the area of the corresponding polygon, in the unsuccessful case, over the area of the minimum bounding rectangle of the polygon, not considering the polygon itself. The maximum node capacity of the TR*-trees is 3. The diagrams depict the number of rectangle tests depending on the number of vertices of the polygons. successful point queries # rectangle tests
6.1 Geometric Algorithms depending on the complexity parameter
level of trapezoids
8000 6000 4000 2000 0
# vertices 0
200
400
600
800
erties. Figure 17 illustrates such an example: On the x-axis, we depict the complexity compl of the polygons and on the y-axis, we depict the number of vertices of the polygons. Only polygons with more than 250 vertices representing forest land are considered.
.
5000 4000 3000
6000
# vertices
# rectangle tests
unsuccessful point queries
2000 1000 0
5000 4000 3000 2000 1000
# vertices 0
200
400
600
800
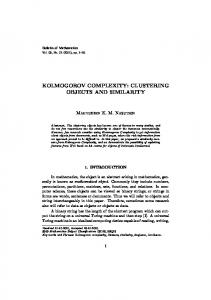
Figure 15: Number of rectangle tests depending on the number on vertices. We can observe a clear logarithmic dependency between the number of vertices and number of rectangle tests for successful point queries, i.e. the height of the TR*-tree determines the cost for this case. We have a restricted dependency on the number of vertices in such a way that the number of vertices is only important when the TR*-tree grows. For unsuccessful point queries, the graph looks different: First, there is a strong variation in the number of rectangle tests. When we neglect this variation, we can observe that the number of rectangle tests is almost constant for polygons with more than 50 vertices. We can postulate that the cost for answering an unsuccessful point query does not depend on the number of vertices when the TR*-tree is used as the spatial data structure.
0 0.0
0.1
0.2
0.3
0.4
0.5
0.6
0.7
compl
Figure 17: Number of vertices depending on the complexity compl. For polygons with a complexity of 0.1 and higher, there seems to exist a dependency (apart from a considerable variation) between the complexity and the number of vertices. However, for polygons with a low complexity, this observation does not hold. What is the reason? In order to investigate this question, we selected the polygons with more than 2,500 vertices and a complexity smaller than 0.1. These 14 polygons are depicted in Figure 18.
# rectangle tests
successful point queries 8000 6000 4000 2000 0
compl
0.0
0.2
0.4
0.6
# rectangle tests
unsuccessful point queries
We can observe that each of these polygons has one or more straight lines in its boundary. These straight lines are not properties of the forests because such lines divide areas of the same type of forest; they are not caused by the political borders of the counties either. They seem to be caused by the surveying process or by the storage system of the GIS where the data were organized first.This example emphasizes that the complexity compl is suitable to detect special features in digitized maps.
5000 4000 3000 2000 1000 0
compl
0.0
0.2
0.4
Figure 18: Forest areas with an abnormal low complexity in the SEQUOIA polygon map.
0.6
Figure 16: Number of rectangle tests depending on the complexity compl. Figure 16 depicts the number of rectangle tests depending on the complexity compl of the polygons. Now, an approximately linear dependency between the complexity and the number of rectangle tests can be observed in both cases. A high complexity of an object causes a higher overlap in the directory and a higher number of rectangle tests for performing a point query. Therefore, compl is not only a good estimation for the complexity of an object but also for the complexity of the directory of a TR*-tree. For unsuccessful point queries, there is now a measure available for estimating their cost. Moreover, this measure has similar properties for successful and unsuccessful point queries in a TR*-tree.
6.2 The Detection of Special Features in Digitized Maps We also analyzed the polygon data from the SEQUOIA 2000 storage benchmark [SFGM 93]. This data set represents the land use and cover of California. Our first results show some abnormal prop-
7 Conclusions In this paper, we suggested a quantitative description of the complexity of spatial objects. This investigation was performed on simple polygons. Complexity is an intuitive term. Therefore, lingual descriptions dominate and a wide spectrum of possible and reasonable parameters for its description exists. The goal of our analysis was to obtain a short and significant description using a few quantitative and non-redundant parameters. The first step was the derivation of a set of basic parameters for a simple polygon. Obviously, there is a big gap between the lingual description of complexity and a parameter such as the number of vertices of a polygon. Hence, we collected and analyzed the attributes of an intuitive description and transformed them into a formal system. This second step turned out quantitative parameters which can be synthesized from the basic set of parameters. The result of this process was a complexity model consisting of three parameters: 1) the frequency of the local vibration (freq), 2) the amplitude of the local vibration (ampl), and 3) the deviation
from the convex hull for describing the complexity of the global shape (conv). These parameters were condensed into one single measure, the complexity of a simple polygon (compl). We showed the advantages of our complexity measure with respect to the fractal dimension and used it to compute the complexity of the objects from different maps. These investigations showed interesting differences and similarities between the maps and confirmed the suitability of our complexity measure. Obviously, the complexity measure of a spatial object cannot be verified by formal methods. Totally different measures may be developed showing similar or dissimilar results. We believe, however, that a suitable measure for complexity is a very important ingredient for performing and assessing experimental or analytical evaluations and analyzing real spatial data. We confirmed this with two concrete applications of our complexity measure. First, the cost for answering the point in polygon test depends on the degree of complexity and not on the number of vertices of the polygon when the TR*-tree is used as a spatial data structure. Second, using our complexity parameter, we detected special features in the data sets of the SEQUOIA 2000 storage benchmark. The complexity parameter allows us to detect objects that are divided by artificial straight lines. In the future, we will adapt the complexity measure to support the similarity search in spatial database systems. We have to work out how the complexity measure can be used to filter out similar spatial objects. Identifying similar objects by describing their contours could be used in areas such as CAD, biology or medicine.
References [AA 83]
Asano Ta., Asano Te.: ‘Minimum Partition of Polygonal Regions into Trapezoids’, Proc. 24th IEEE Annual Symp. on Foundations of Computer Science, 1983, pp. 233-241. [BKS 93] Brinkhoff T., Kriegel H.-P., Schneider R.: ‘Comparison of Approximations of Complex Objects Used for Approximation-based Query Processing in Spatial Database Systems’, Proc. 9th Int. Conf. on Data Engineering, Vienna, Austria, 1993, pp. 40-49. [BKSS 90]Beckmann N., Kriegel H.-P., Schneider R., Seeger B.: ‘The R*-tree: An Efficient and Robust Access Method for Points and Rectangles’, Proc. ACM SIGMOD Int. Conf. on Management of Data, Atlantic City, NJ, 1990, pp. 322-331. [BKSS 94]Brinkhoff T., Kriegel H.-P., Schneider R., Seeger B.: ‘Multi-Step Processing of Spatial Joins’, Proc. ACM SIGMOD Int. Conf. on Management of Data, Minneapolis, MN, 1994, pp. 197-208. [Bur 86] Burrough P. A.: ‘Principles of Geographical Information Systems for Land Resources Assessment’, Oxford University Press, 1986. [Cra 90] Crain I. K.: ‘Extremely Large Spatial Information Systems - A Quantitative Perspective’, Proc. 4th Int. Symp. on Spatial Data Handling, Zurich, Switzerland, 1990, pp. 632-641. [FK 94] Faloutsos C., Kamel I.: ‘Beyond Uniformity and Independence: Analysis of R-trees Using the Concept of Fractal Dimension’, Proc. 13th ACM Symp. on Principles of Database Systems, Minneapolis, MN, 1994, pp. 4-13. [Fra 91] Frank, A. U.: ‘Properties of Geographic Data’, Proc. 2nd Symp. on Large Spatial Databases, Zurich, Switzerland, 1991, in: Lecture Notes in Computer Science, Vol. 525, Springer, 1991, pp. 225-234. [GC 87] Gorny A. J., Carter R.: ‘World Data Bank II: General Users Guide’, Central Intelligence Agency, Washington, DC, 1987.
[KHS 91] Kriegel H.-P., Horn H., Schiwietz M.: ‘The Performance of Object Decomposition Techniques for Spatial Query Processing’, Proc. 2nd Symp. on the Design of Large Spatial Databases, Zurich, Switzerland, 1991, in: Lecture Notes in Computer Science, Vol. 525, Springer, 1991, pp. 257-276. [KSSS 89] Kriegel H.-P., Schiwietz M., Schneider R., Seeger B.: ‘Performance Comparison of Point and Spatial Access Methods’, Proc. 1st Symp. on the Design and Implementation of Large Spatial Databases, Santa Barbara, CA, 1989, in: Lecture Notes in Computer Science, Vol. 409, Springer, 1990, pp. 89-114. [Lan 91] Landesvermessungsamt Baden-Württemberg, Stuttgart, 1991. [Man 77] Mandelbrot, B.B.: ‘The Fractal Geometry of Nature’, W.H. Freeman and Co., 1977. [PJS 92] Peitgen H.-O., Jürgens H., Saupe D.: ‘Chaos and Fractals: New Frontiers of Science’, Springer, 1992. [Rüt 95] Rützel H.: ‘Describing the Complexity of Geometric Objects by Using the Fractal Dimension’ (in German), University of Munich, 1995. [SFGM 93]Stonebraker M., Frew J., Gardels K., Meredith J.: ‘The Sequoia 2000 Storage Benchmark’, Proc. ACM SIGMOD Int. Conf. on Management of Data, Washington, DC, 1993, pp. 2-11. [SK 91] Schneider R., Kriegel H.-P.: ‘The TR*-tree: A New Representation of Polygonal Objects Supporting Spatial Queries and Operations’, Proc. 7th Workshop on Computational Geometry, Bern, Switzerland, 1991, in: Lecture Notes in Computer Science, Vol. 553, Springer, 1991, pp. 249-264. [Sta 90] Statistical Office of the European Communities: ‘Regions’, Luxembourg, 1990.