England, edited by K. Patterson and S.G.B. Henry, Chapman and Hall, London. Hall S.G. and Miles D.K. (1992) An empirical study of recent trends in world bond.
Measuring the Correlation of Shocks Between the UK And The Core of Europe by
S.G. Hall Imperial College and NIESR and
B. Yhap Imperial College
Abstract This paper considers the question of the symmetry of inflation and GDP shocks between the UK and the three major European EMU countries. It applies a relatively new technique, the orthogonal GARCH model, which allows us to calculate a complete time varying correlation matrix for these four countries. We can then examine the way the conditional correlation of shocks between the UK and the other European countries ahs been evolving over time. Our overall results are that the shocks, which hit the UK, are now broadly symmetrical with France and Italy but that German seems to exhibit very low correlation with any of the other three countries.
Acknowledgements: Financial Support from ESRC grant No L138250122 is gratefully acknowledged.
1. Introduction Recent years have seen considerable interest in the optimal currency area literature for obvious reasons, given developments in Europe with Monetary Union. Following the seminal early work of Mundell (1961) and McKinnon (1963) a small selection of the vast recent literature would include Alesina and Barro (2002), Artis (2002), Buiter (1999), Frankel and Rose (1997), McCallum (1999), Mckinon (1994) and Rogoff (2001). One theme common to this literature is that a key criterion for the success of a monetary union is that the shocks which hit the economies should be reasonably common and well correlated. Artis(2002) for example in his table 2 asses the appropriateness of a number of countries joining a monetary union based on a number of criteria including the symmetry of shocks and concludes that on this criteria the UK should not join EMU. The purpose of this paper is to examine the question of the correlation of inflation and output shocks between the four large European countries (UK, Germany, France and Italy). A key aspect of this analysis however is that conventional correlations measure something which is true on average over a particular historical period but which may not be true of the future. A more appropriate measure is a conditional correlation based on a good time series model of the series under examination. In effect a system GARCH model, which would allow us to properly examine the changing conditional correlation in the shocks affecting these countries. System GARCH however is difficult to apply to even fairly small systems of equations as the number of parameters quickly expands as the number of variables in the system increases. Here we propose to use a relatively new model, the orthogonal GARCH model to calculate the conditional covariance matrix of shocks and to examine the pattern of developments in these correlations from the early 1970’s to the early 2000’s. The plan of the paper is as follows, Section 2 outlines the basic problem of system GARCH estimation and the usefulness of the orthogonal GARCH model. Section 3 then applies this model to the series for inflation and GDP for the four main European countries. Section 4 then draws some conclusions.
2
2. SYSTEM GARCH The standard univariate GARCH model is now very well known but this model suffers from the obvious drawback that it can only be used to produce a measure of the conditional variance of a process. If we are interested in understanding the complete conditional distribution of a group of variables then we need to extend the basic GARCH framework to a multivariate context so that we may consider complete conditional covariance matrices. A number of studies have already used this extension and a number of alternative specifications exist in the literature, Kraft and Engle(1982), Bollerslev, Engle and Wooldridge(1988), Hall Miles and Taylor( 1990), Hall and Miles(1992), Engle and Kroner(1995). Essentially we are interested in building a model of a complete conditional covariance structure of a set of variables. So consider a set of n variables Y that may be considered to be generated by the following VAR process. A( L)Yt = et This varies from a conventional VAR model as we assume that E ( et ) = 0 and E ( et e' t ) = Ω t So that the covariance matrix is time varying. We then make the standard ARCH assumption that this covariance matrix follows an autoregressive structure. Estimation of such a model is, in principle, quite straightforward, as the log likelihood is proportional to the following expression. T
l = ∑ ln | Ω t | + e' t Ω t et −1
(1.)
t =1
and so standard maximum likelihood (or quasi maximum likelihood) procedures may be applied. The only real difficulty comes in the parameterization of the process generating Ω t ; the natural extension of the standard GARCH formulation very quickly begins to generate huge numbers of parameters. If we define the VECH operator in the usual way
3
as a stacked vector of the lower triangle of a symmetric matrix then we can represent the standard generalization of the univariate GARCH model as VECH (Ω t ) = C + A( L)VECH ( et et ' ) + B( L)VECH (Ω t −1 )
(2.)
where C is an (N(N+1)/2) vector and Ai and Bi are (N(N+1)/2)x(N(N+1)/2) matrices. This general formulation rapidly produces huge numbers of parameters as N rises (for just 1 lag in A and B and a 5 variable system we generate 465 parameters to be estimated) so for anything beyond the simplest system this will almost certainly be intractable. A second problem with this model is that without fairly complex restrictions on the system the conditional covariance matrix cannot be guaranteed to be positive semi definite. So much of the literature in this area has focused on trying to find a parameterization which is both flexible enough to be useful and yet is also reasonably tractable. One of the most popular formulations was first proposed by Baba, Engle, Kraft and Kroner, sometimes referred to as the BEKK (see Engle and Kroner (1993)) representation, this takes the following form q
p
i =1
j =1
Ω t = C ' C + ∑ A' i et −i e' t −i Ai + ∑ B' j Ω t − j Bt − j
(3.)
This formulation guarantees positive semi definiteness of the covariance matrix almost surely and reduces the number of parameters considerably. However even this model can give rise to a very large number of parameters and further simplifications are often applied in terms of making A and B symmetric or diagonal. Orthogonal GARCH Any of the multivariate GARCH models listed above is severely limited in the size of model, which is tractable. Even a restricted BEKK model becomes largely unmanageable for a system above 4 or 5 variables. An alternative approach, however which can be applied, potentially to a system of any size rests on the use of principal components and
4
is sometimes referred to as orthogonal GARCH. This technique seems to be first referred to by Ding (1994) in his PhD thesis and he ascribes it to Ron Kahn who suggested it to him in a conversation. Consider a set of n stochastic variables X, which have a covariance structure V. Principal components then produces a set of n variables (P), which contain all the variation of X but are also orthogonal to each other. The standard principal component representation can be written as follows. n
X i = µ i + ∑ ω ij p j
i=1…n
(4.)
j =1
so if all n principal components are used each xi can be exactly reproduced by weighting the principal components together with the correct loading weights. Now by simply taking the variance of both sides of this equation we can see that
VAR ( X ) = V = W (VAR ( P ))W ' = WΨW '
(5.)
The advantage of this is of course that as the principal components are orthogonal Ψ will be a diagonal matrix with zeros on all non diagonal elements. From applying principal components we know W; we then simply have to derive a set of univariate GARCH models to each principal component to derive estimates of the conditional variance at each point in time and apply the above formulae to derive an estimate of the complete covariance matrix V. The conditional variance may be obtained from any chosen procedure (GARCH, EGARCH or even an EWMA model of the squared errors) There are however two further issues here; i)
as the principal components are ordered by their explanatory power we often find that a subset of them produces a very high degree of explanatory power. It may then only be deemed necessary to use the first k principal components. It is even suggested that this helps to remove noise from the system as the minor principal components may be reflecting pure random movements. This can easily be done but it introduces an error term into the principal
5
components representation above and the resulting covariance matrix may no longer be positive definite. ii)
Equation (5) above is true exactly for the whole period the principal components are calculated for but it does not necessarily hold at each point in the sample. So this is really only delivering an approximation. It may then be useful to apply the procedure to a moving window of observations so that the W matrix also effectively becomes time varying.
Yhap (2003) has conducted an extensive Monte Carlo study of the properties of the orthogonal GARCH model and one of his findings is that the model performs well for samples of less than 500 observations but that its ability to accurately track conditional covariances deteriorates substantially as the sample increases beyond this number of observation. 3. Orthogonal GARCH estimation for European Shocks In this section we undertake two experiments to calculate the complete conditional correlation matrix first for CPI inflation and then for real GDP for the UK, Germany, France and Italy. The data we are using are quarterly and start in 1972 and continue until 2002. We turn first to the inflation example. We begin by presenting the simple correlation matrix of inflation over the full period. UK
Germany
France
Italy
UK
1.0000
0.5807
0.7385
0.7444
Germany
0.5807
1.0000
0.5879
0.5960
France
0.7385
0.5879
1.0000
0.9172
Italy
0.7444
0.5960
0.9172
1.0000
6
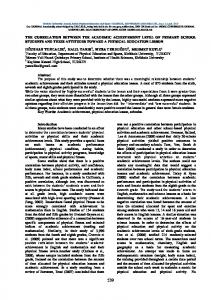
It is interesting that the simple correlation coefficient between Germany and the other three countries is almost identical and quite low. The correlation between France and Italy is very high and that between the UK and Italy and France nearly exactly halfway between. We then derive the principal components for these series. The first principal component explains 77% of the variation in the data, the second 13%, the third 8% and the final one just 2%. Univariate GARCH models were then estimated for each of the components; we found a third order autoregression was adequate to capture the time series properties of each component and a GARCH (1,1) specification was an adequate description of the conditional volatility. We will not report each of these models in detail as they have only limited interest. Finally using equation 5 and the principal component loading matrix we construct the full conditional covariance and conditional correlation matrix. The full set of 6 conditional correlations are presented in figures 1 and 2. Figure 1 focuses on the correlations with the UK while figure 2 focuses on the correlations between France Germany and Italy. The first thing to be said is that there is clearly considerable and systematic variation in the correlation. This emphasizes the need to calculate a true conditional correlation rather than a sample average. Many of the individual spikes are also quite easily interpreted. For example there is a spike increase after the 1973 oil price rise in all series. Apart from this however there was clearly almost no correlation between the UK and the rest of Europe in inflationary shocks in the 1970s. But since the early 1980s there has been a very steady trend rise in the correlation, especially with respect to France and Italy although much less so with respect to Germany. In Figure 2 we see that the correlation between France and Italy is very high and stable, close to 0.9 while the correlation of both countries with Germany is almost zero. Only at the very end of the sample is there any sign of inflation correlation and this is still very small. So by the end of the sample the UK, France and Italy all exhibit conditional correlations around 0.8 with respect to inflationary shocks. Germany has a very low conditional
7
correlation with each of them. While this picture is much richer than the simple correlation matrix above, it certainly confirms the basic picture presented there. In terms of inflationary shocks the UK is now highly correlated with France and Italy, only Germany seems to be an outlier. We now turn to the GDP results; here again we begin by presenting the simple correlation matrix for the growth rate in real GDP for each country. UK UK Germany France Italy
1.0000 0.3396 0.3188 0.1100
Germany
France
0.3396 1.0000 0.4555 0.2923
0.3188 0.4555 1.0000 0.5352
Italy 0.1100 0.2923 0.5352 1.0000
Here the correlation between France and Italy is again very high while that between Germany and the other three countries is much lower The UK lies somewhere between with a very low correlation with Italy but slightly higher with France and Germany. Following the same procedure we again begin by calculating the principal components of these 4 series. The first principal component now explains 51% of the variation, the second 23%, the third 15% and the final one 11%. So there is clearly much more diversity in growth rates than inflation rates over the whole period. Following the same procedure outlined above we estimate univariate GARCH models for each component and construct the conditional correlation matrix. The resulting correlations are shown in Figures 3 and 4. Figure 3 again considers the correlations with the UK. During the 1970’s France and Italy were almost completely uncorrelated with the UK in terms of GDP shocks after the middle 1980s however this changed and a gradual increase in symmetry emerged until by the end of the sample the conditional correlation between the UK and France and Italy was close to 0.5 and quite stable. The correlation between the UK and Germany has again behaved quite differently with an almost constant average conditional correlation around 0.2 with no sign of any trend. The correlation between France and Italy has been fairly
8
stable around 0.5 with a small rise in their correlation with Germany towards the end of the period. Again by the end of the period the UK seems to be very similar to France and Italy. It is Germany, which has a lower conditional correlation in its shocks with the rest of Europe. 4. Conclusion We have applied a sophisticated technique to calculate a GARCH based conditional correlation matrix for shocks to inflation and real GDP growth for the UK, France, Germany and Italy. In both cases we find important trends in the UK's conditional correlation with France and Italy so that by the end of our period (2002) the UK is in a very similar position to France and Italy. In both cases however we find no strong evidence of systematic change in the relationship between Germany and the rest of Europe. Based on this element of the optimal currency area criteria therefore it would seem that the UK is fully able to take part in a currency union. If anything it is Germany, which would find life more difficult in a European currency union than outside it.
9
Figure 1. Conditional Correlation of the inflation shocks between the UK and Germany France and Italy 1
0.8
0.6
0.4
0.2
0
-0.2
-0.4 1973Q2
1978Q2
1983Q2
1988Q2 ug
uf
1993Q2
1998Q2
ui
Figure 2. Conditional Correlation for inflation shocks between Germany France and Italy 1
0.8
0.6
0.4
0.2
0
-0.2
-0.4
-0.6 1973Q2
1978Q2
1983Q2
1988Q2 gf
gi
10
1993Q2 fi
1998Q2
Figure 3. Condition Correlation of GDP shocks between the UK and Germany, France and Italy 0.8
0.6
0.4
0.2
0
-0.2
-0.4
-0.6
-0.8 1973Q2
1978Q2
1983Q2
1988Q2 ug
uf
1993Q2
1998Q2
ui
Figure 4. Conditional Correlation of GDP Shocks between Germany, France and Italy 0.7
0.6
0.5
0.4
0.3
0.2
0.1
0
-0.1
-0.2
-0.3 1973Q2
1978Q2
1983Q2
1988Q2 gf
gi
11
1993Q2 fi
1998Q2
References Alesina A. and Barro R.J. (2002) ‘Currency Unions’ Quarterly Journal of Economics 117, 409-436 Artis M.J. (2002)’ Reflections on the Optimal Currency Area (OCA) Criteria in the Light of EMU’ Osterreichische Nationalbank Working paper No 69. Bollerslev T. Engle R.F. and Wooldridge J.M. (1988) ‘A capital asset pricing model with time varying covariances’ Journal of Political economy, 96 116-131 Buiter W. (1999) ‘Optimal Currency Areas: Why does the exchange rate regime matter? (with an application to UK membership of EMU)’ Sixth Royal Bank of Scotland lecture at the Scottish Economic Society annual conference. Ding Z. (1994) ‘Time series analysis of Speculative returns’ PhD thesis UCSD Engle R.F. and Kroner K.F. (1995) Multivariate simultaneous generalized ARCH, Econometric Theory 11(1) 122-50 Frankel J. and Rose A. (1997) ‘Is EMU more justifiable ex-post than ex-anti?’ European Economic Review, 41, 753-760 Hall S.G. Miles D.K. and Taylor M.P. (1990) A Multivariate GARCH in mean Estimation of the Capital Asset Pricing Model, in Economic Modelling at the Bank of England, edited by K. Patterson and S.G.B. Henry, Chapman and Hall, London. Hall S.G. and Miles D.K. (1992) An empirical study of recent trends in world bond markets, Oxford Economic Papers 44, 599-625 Kraft D.F and Engle R.F. (1982) Autoregressive Conditional Heteroskedasticity in Multiple Time Series, UCSD manuscript McCallum B. T. (1999) ‘Theoretical Issues pertaining to Monetary Unions’ NBER working paper No 7393. McKinnon R.I. (1963) ‘Optimum Currency Areas’ American Economic Review, 53, 717725. McKinnon R.I. (1994) ‘A Common Monetary standard or a common currency for Europe’ Fiscal Lessons from the United States’ Scottish Journal of Political Economy 41, 337-357. Mundell R.A. (1961) ‘A Theory of Optimal Currency Areas’ American Economic Review, 51, 657-665
12
Rogoff K. (2001) ‘On why not a global currency’ American Economic Review, 91 243247. Yhap B (2003) ‘The analysis of Principal Component GARCH models in Value-at-Risk calculations’ London University PhD thesis.
13