Phil. Trans. R. Soc. B (2005) 360, 443–455 doi:10.1098/rstb.2004.1592 Published online 28 February 2005
Measuring the extent and effectiveness of protected areas as an indicator for meeting global biodiversity targets S. Chape*, J. Harrison, M. Spalding and I. Lysenko UNEP World Conservation Monitoring Centre, Cambridge, UK There are now over 100 000 protected areas worldwide, covering over 12% of the Earth’s land surface. These areas represent one of the most significant human resource use allocations on the planet. The importance of protected areas is reflected in their widely accepted role as an indicator for global targets and environmental assessments. However, measuring the number and extent of protected areas only provides a unidimensional indicator of political commitment to biodiversity conservation. Data on the geographic location and spatial extent of protected areas will not provide information on a key determinant for meeting global biodiversity targets: ‘effectiveness’ in conserving biodiversity. Although tools are being devised to assess management effectiveness, there is no globally accepted metric. Nevertheless, the numerical, spatial and geographic attributes of protected areas can be further enhanced by investigation of the biodiversity coverage of these protected areas, using species, habitats or biogeographic classifications. This paper reviews the current global extent of protected areas in terms of geopolitical and habitat coverage, and considers their value as a global indicator of conservation action or response. The paper discusses the role of the World Database on Protected Areas and collection and quality control issues, and identifies areas for improvement, including how conservation effectiveness indicators may be included in the database to improve the value of protected areas data as an indicator for meeting global biodiversity targets. Keywords: protected areas; biodiversity indicators; measurement; effectiveness 1. INTRODUCTION Protected areas are recognized as the most important core ‘units’ for in situ conservation. The information contained in the World Database on Protected Areas (WDPA) records the numerical and spatial attributes of over 100 000 sites, covering more than 12% of the Earth’s land area. These data provide a basis for assessing the extent of formal protection of global biodiversity, and a measure of conservation commitment at the global scale. Protected area coverage was endorsed by the seventh Conference of the Parties (CoP7) of the Convention on Biological Diversity (CBD) as an indicator for immediate testing in relation to the adopted target of significantly reducing the rate of biodiversity loss by 2010. Additionally, CoP7 set a target that “at least 10% of each of the world’s ecological regions [should be] effectively conserved” (SCBD 2004; p. 383). Protected areas are also indicators for success in achieving the Millennium Development Goal 7 (ensuring environmental sustainability), Target 9 (integrate the principles of sustainable development into country policies and programmes and reverse the loss of environmental
resources) and Indicator 26 (land area protected to maintain biological diversity). In both cases, the indicator is defined in terms of areal extent: ‘coverage’ and ‘land area protected’, respectively. Provision of data to measure this indicator, it can be argued, is both essential and straightforward and therefore we can maintain the current set of measurable parameters (numerical, spatial and geographic data). However, neither the indicator of areal extent, nor the current global protected area dataset, tells us if protected areas are ‘achieving’ their conservation objectives. Therefore, it is proposed that two inter-related types of measurement are needed to assess real progress in meeting the 2010 targets: 1. Effectiveness of coverage: how much and what biodiversity is included within protected areas? 2. Effectiveness in achieving conservation objectives: are protected areas being managed effectively? In reviewing these two issues this paper will discuss the role and value of using protected areas as indicators for meeting global biodiversity targets. It will also: (i) review current global protected area numbers and extent; (ii) describe and review the current state of knowledge of the global extent of protected areas in relation to biomes and habitat types; (iii) discuss current protected area management
* Author for correspondence (
[email protected])
One contribution of 19 to a Discussion Meeting Issue ‘Beyond extinction rates: monitoring wild nature for the 2010 target’.
443
q 2005 The Royal Society
444
S. Chape and others
Extent and effectiveness of protected areas
effectiveness initiatives that can contribute to the role of protected areas as indicators for achieving global biodiversity targets; and (iv) evaluate shortcomings in current data and evaluation methods, and propose improvements to ensure that protected areas are an effective indicator for achieving global biodiversity targets. 2. WHAT DO WE MEAN BY ‘PROTECTED AREAS’? Setting aside natural areas to maintain their intrinsic values is not a recent phenomenon in human history. It has been part of human endeavour for millennia, occurring in all regions of the planet where humans have settled. Historically, the motivation for protecting natural areas has ranged from the religious to resource or species management, including initiatives such as designating sacred groves and limiting or prohibiting the exploitation of particular species in certain areas. For example, those areas set aside by Pacific Islanders; European hunting reserves; and the forest, elephant, fish and wildlife reserves established by the Mauryan kings of India in the second and third centuries BC (Grove 1995). As McNeely (1998, p. 189) has noted, “protected areas are a cultural response to perceived threats to nature. Because society is constantly changing, so too are social perspectives on protected areas and the values that they are established to conserve”. By the nineteenth century, human impact on the planet’s natural ecosystems, especially through European colonial expansion and commercial enterprise in the Americas, Australasia, Asia and Africa, led to the establishment of the first modern national parks and reserves, as understood in the initial western paradigm of protected areas. However, since the establishment of Yellowstone National Park in the United States in 1872, often cited as the start of the modern era of protected areas, the global loss of natural habitats and species has continued unabated. In the face of this ongoing loss, our ‘cultural response’ has been to establish more and more protected areas to conserve the Earth’s vanishing biological diversity. Protected areas now represent one of the most significant forms of human land use on the planet— although the commitment to marine protection, at 0.5% of the Earth’s oceans, remains completely inadequate. Since the 1960s, conservation science and principles for establishing and managing protected areas have developed enormously. International conservation organizations and academic institutions have helped this development, but primarily the growth of protected area knowledge has resulted from the work commenced by the International Union for Conservation Nature (IUCN) and the original National Parks Commission (NPC) in the late 1950s (now the World Commission on Protected Areas; WPCA) and strengthened over the past four decades. In particular, the early 1960s were a benchmark period in the global approach to protected areas. The First World Conference on National Parks was convened by the IUCN, the NPC and other partners in 1962, and in the Phil. Trans. R. Soc. B (2005)
same year the UN General Assembly endorsed the importance of periodically reviewing the number and extent of the world’s ‘national parks and reserves’ by establishing the ‘UN list’ reporting process. The thirteenth edition of the UN List of Protected Areas was released in 2003 (Chape et al. 2003), the latest edition of one of the world’s longest running environmental reporting processes. Over the past 40 years, there has also been a paradigm shift (Phillips 2003) in the role of protected areas—in fact, the term protected areas was a relatively recent addition to the conservation lexicon in the latter half of the twentieth century. We have moved from the nineteenth to mid-twentieth century national parks and reserves paradigm to a broader conceptual and practical approach that includes: (i) the formulation of specific protected area management categories that recognize the scope and values of different management objectives in the conservation of natural areas; (ii) the ‘mainstreaming’ of conservation concerns into development agendas, rethinking the role of protected areas vis-a`-vis conservation and sustainable human use (e.g. Pierce et al. 2002); Dudley & Stolton 2003); (iii) recognition of the importance of cultural and social values; and (iv) recognition of the role of protected areas as key indicators for assessing the achievement of global biodiversity and sustainable development objectives. The IUCN and the WCPA have been instrumental in guiding this paradigm shift, and have defined (IUCN 1994) a protected area as: an area of land and/or sea especially dedicated to the protection and maintenance of biological diversity, and of natural and associated cultural resources, and managed through legal or other effective means. The IUCN definition is widely adopted and is used, for example, by the United Nations Environment Programme World Conservation Monitoring Centre (UNEP-WCMC) as a basis for recording protected area information in WDPA. Also adopted at the global level—at least by the 188 countries currently party to the Convention—is the protected area definition of the CBD: A geographically defined area which is designated or regulated and managed to achieve specific conservation objectives. Other international conventions and agreements have definitions of specific types of protected areas, and some definitions have been developed for particular regions. For example: World Heritage Sites, Ramsar Sites, Biosphere Reserves, ASEAN Heritage Sites, the European Natura 2000 network and the Ministerial Conference on the Protection of Forests in Europe. Despite the growth in global agreements on nature conservation and the establishment of protected areas,
Extent and effectiveness of protected areas
S. Chape and others 445
Table 1. definitions of the IUCN protected area management categories (IUCN 1994). Category Ia strict nature reserve: protected area managed mainly for science area of land and/or sea possessing some outstanding or representative ecosystems, geological or physiological features and/or species, available primarily for scientific research and/or environmental monitoring Category Ib wilderness area: protected area managed mainly for wilderness protection large area of unmodified or slightly modified land, and/or sea, retaining its natural character and influence, without permanent or significant habitation, which is protected and managed so as to preserve its natural condition Category II national park: protected area managed mainly for ecosystem protection and recreation natural area of land and/or sea, designated to (i) protect the ecological integrity of one or more ecosystems for present and future generations, (ii) exclude exploitation or occupation inimical to the purposes of designation of the area and (iii) provide a foundation for spiritual, scientific, educational, recreational and visitor opportunities, all of which must be environmentally and culturally compatible Category III natural monument: protected area managed mainly for conservation of specific natural features area containing one or more, specific natural or natural/cultural feature which is of outstanding or unique value because of its inherent rarity, representative or aesthetic qualities or cultural significance Category IV habitat/species management area: protected area managed mainly for conservation through management intervention area of land and/or sea subject to active intervention for management purposes so as to ensure the maintenance of habitats and/ or to meet the requirements of specific species Category V protected landscape/seascape: protected area managed mainly for landscape/seascape conservation and recreation area of land, with coast and sea as appropriate, where the interaction of people and nature over time has produced an area of distinct character with significant aesthetic, ecological and/or cultural value, and often with high biological diversity. Safeguarding the integrity of this traditional interaction is vital to the protection, maintenance and evolution of such an area Category VI managed resource protected area: protected area managed mainly for the sustainable use of natural ecosystems area containing predominantly unmodified natural systems, managed to ensure long-term protection and maintenance of biological diversity, while providing at the same time a sustainable flow of natural products and services to meet community needs
the protected area designations used by countries are not necessarily directly comparable across countries because of potentially different legislative regimes. Over 1000 different terms are known to be used around the world to designate protected areas. These terms are often defined within national legislation in relation to objectives and legal protection for individual areas. The need for internationally standardized protected area nomenclature and definitions was raised at the First World Conference on National Parks in 1962 (Adams 1964). It was noted that “an effort should be made to standardize the nomenclature for various types of specifically reserved areas or.to properly relate these terms so that similar objectives of differently designated areas will be readily recognizable” (Brockman & Curry-Lindahl 1964; p. 366). In 1994, agreement was reached on a managementobjective-based category system (see table 1) of six categories. A number of countries have now formally adopted the IUCN management categories as the basis for planning and managing their national protected area systems, and in July 2003 the system was formally adopted in the revised African Convention on the Conservation of Nature and Natural Resources approved by the Assembly of the African Union. The international credibility of the categories was further strengthened by the endorsement of the category approach at the CBD CoP7. However, there is a substantial amount of work to be done and the Phil. Trans. R. Soc. B (2005)
University of Cardiff, IUCN and the UNEP–WCMC have been implementing a research project to assess the ways in which the management categories can be used to further conservation action on the ground (see www.cardiff.ac.uk/cplan/sacl). 3. THE WORLD DATABASE ON PROTECTED AREAS AND ITS ROLE IN MEASURING THE EXTENT OF THE GLOBAL PROTECTED AREAS ESTATE The WDPA provides the only comprehensive global inventory of the world’s protected areas. First established in 1981 and managed since that time by the IUCN Conservation Monitoring Centre, now UNEPWCMC, this database represents a unique and important resource. Since 2002, protected areas information from the WDPA has provided regular statistical and analytical information for the Millennium Development Goals (MDG), Millennium Ecosystem Assessment and CBD processes. For example, the WDPA provided global data for the preparation of technical reports to the ninth meeting of the CBD Subsidiary Body on Scientific, Technical and Technological Advice (SBSTTA) in 2003 (SCBD 2003) and CBD CoP7 in 2004 (Mulongoy & Chape 2004), thereby contributing to the key decisions of CoP7 on protected areas. The data-holdings within the WDPA have been gathered from a broad range of sources, with major
446
S. Chape and others
Extent and effectiveness of protected areas
updates undertaken every 3–5 years in preparation for the publication of the ‘United Nations List of Protected Areas’. Critical sources have included government agencies with direct responsibility for protected areas. However, other sources have generally included NGOs and published materials, particularly for those areas where formal government responses were unobtainable. In 2002, the WDPA was considerably strengthened through the establishment of a consortium of international conservation organizations. Founding members of the consortium were the American Museum of Natural History, BirdLife International, Conservation International, Fauna and Flora International, IUCN—The World Conservation Union, The Nature Conservancy, UNEP-WCMC, Wildlife Conservation Society, World Resources Institute and WWF. Consortium members are pooling their information resources for inclusion in the WDPA and collaborating on the improvement of the structure of the WDPA, as well as the quality and quantity of the core data that it contains. A broad range of data is held within the WDPA for each site including site name, national designation, location, size, IUCN management category, date of designation, whether it is marine or coastal and a biogeographic code (Udvardy 1975). Further fields allow for the tracking of a site’s designation history (proposed, gazetted and changes in boundaries), the annotation of habitat fields, its relationship to other sites (adjacent, overlapping, etc.), and its ownership and administration. There remain fields available for the annotation of management information, staffing, budgets and visitor statistics; however, these are largely unused at the present time. Integral to the database is a geographical information system (GIS). This includes polygon boundary information for sites. As with the aspatial data, GIS data are derived from a broad range of sources, including official government systems and reliable secondary sources, including NGOs working on sites or in particular countries. The scale, resolution and reliability of the source material vary considerably. The WDPA provides a unique tool to investigate progress in the development of the global network of protected areas. Using both the database and the GIS, it is possible to provide summary information at global, regional and national levels, while the GIS makes it possible to undertake spatial assessments, combining the protected areas information with other data layers, such as species or habitats. In this way, it is possible to summarize the ‘effectiveness’ of the protected areas network in covering particular places, habitats or species. IUCN management categories have been applied to about 60% of sites and these provide some indication of the expected level of management intervention and human influence within sites. 4. ANALYSIS OF THE GLOBAL NETWORK OF PROTECTED AREAS IN 2004 For the present discussion, we present a summary of the current holdings of the WDPA from a geopolitical perspective, and also a new analysis looking at the Phil. Trans. R. Soc. B (2005)
habitat coverage of the protected areas network. These represent part of a larger synthesis of protected areas information currently under development (Spalding et al. in preparation). (a) Methodology (i) Aspatial attribute information At the time of writing the WDPA contains information on some 104 791 protected areas worldwide, with information on all countries. However, not all datafields are complete for all of these sites and so subsequent analyses have to take these deficiencies into account. The current total figure represents only those sites that are known to have been designated— there is further information on the WDPA regarding degazetted, proposed and recommended sites which is not considered further in this study. Size. Information is available for 86% of the sites in the database. The largest protected areas tend to be the best documented and so, although it cannot be shown definitively, it is likely that those sites for which no size has been provided are small. IUCN protected area management categories. Historically, this information was completed, where possible, by national agencies. However, if such information was not forthcoming, it was assigned by other expert bodies including the WCPA or by staff at UNEP-WCMC, using legislative or other sources wherever possible. In 2002, a decision was made to only assign IUCN categories when these were supplied by the relevant national agency and otherwise to leave this information blank. The result is that, at the present time, the IUCN category information includes both nationally ‘approved’ information and non-official interpretations. Sites listed as ‘no category’ meet the IUCN definition of a protected area. Date of designation. Available for 66 573 sites (64% of the total). (ii) Geographic and boundary information Boundary information is held in the GIS for some 39 194 sites (37%). For a further 36 550 sites (35%), information is available describing the geographic coordinates of the central point, and there is also information on the size of the site. With this information, it is possible to create buffered points (circles of the correct size centred on the known central point). The combined layer of polygons and buffered points therefore represents 72% of the total sites in the database. However, these include most of the largest sites and account for 95% of the total known area of protected areas. In addition, it is known in which country every protected area lies. In many countries, there may be overlaps between protected areas, with strict nature reserves lying within the boundaries of national parks or other categories. A simple summation of the area statistics would thus produce an inflated estimate of total coverage. Using a GIS-based approach, it is possible, within the limitations of the accuracy of the source polygon information, to reduce this error and limit double counting. In fact, this approach introduced a secondary error for those sites where buffered points have been used.
Extent and effectiveness of protected areas
In these cases, it is possible that adjacent sites could be falsely presented as overlapping. In the current study, this error was assumed to be smaller than the potential error of double counting, although further work may be needed to address the scale of this problem. For the statistics presented in the following analysis, GIS figures were calculated for all sites with available locational information, while sites without such geographic pointers were simply added to the totals so derived. The sources for the information within the database are highly varied, and it must be assumed that the spatial accuracy of the information contains similar variation. Errors are likely to arise both from inaccuracy (points are simply wrong, with errors potentially varying from tens of metres to tens of kilometres), to issues of resolution (with effectively the same results— maps prepared for low resolution use may show increasing levels of spatial misplacement associated with ‘pushing’ them beyond their true resolution). At the present time, it is not possible to provide an assessment of the level of these errors within the database. (iii) Habitat analysis Four broad sources of information were used in separate analyses to look at the habitat coverage of the global protected areas network. Land versus sea area. The Digital Chart of the World (DCW; rasterized to 1 km resolution grid) was used to determine the proportion of the global protected areas estate which was terrestrial rather than marine. Terrestrial habitats. The Global Land Cover 2000 (GLC2000) dataset was taken as a starting point. Unlike earlier global land cover assessments, considerable regional expertise was used in the development of this map layer. It uses a globally consistent legend based on the FAO Land Cover Classification System (FAO 2000) and is based on 1 km resolution SPOT imagery, although information from other sensors has been used to refine particular elements (Bartholome et al. 2002). Various alterations were made in this base-map, notably subdividing a number of classes on broadly latitudinal bands, enabling the discernment of major forest and desert classes (tropical, temperate and boreal for forests; warm, cold and polar for deserts). Further refinements were made to fill some gaps in the GLC2000 coverage, notably for the far northern parts of Eurasia and also some of the island groups, using data of the 1 km land cover classification derived from AVHRR (Hansen et al. 1998, 2000). Mountains. In 2000, UNEP-WCMC developed the global mountains map, with data improved in 2002 (Blyth et al. 2002). This layer was analysed separately from the land cover information described above. Marine and coastal habitats. Two further habitat layers developed at UNEP-WCMC were also used for a separate analysis of coral reefs and mangrove forests (Spalding et al. 1997, 2001). It should be noted that each of these layers will include inaccuracies, which may be compounded where information is also out of date. For example, Phil. Trans. R. Soc. B (2005)
S. Chape and others 447
in the GLC2000 there are problems of interpretation, with some areas simply being misidentified. The resolution of the source data may compound such errors as boundary areas and patchwork landscapes are summarized into single square kilometre pixels. There may also be errors of spatial location, which will be particularly noticeable when any single layer is combined with another, and when buffered-point and point-only data are used. This can result in errors of ‘omission’, when habitats are ‘incorrectly not included’ in a protected area; and ‘commission’, when habitats are ‘incorrectly included’ within a protected area. In the present study, the mismatch between the GLC2000 and the higher resolution ocean layer held at UNEP-WCMC led to the occurrence of a considerable area of ‘no-data’ along the coastline in many areas. The relatively low resolution of the GLC2000 data-layer means that fine-scale habitats, such as riparian and coastal habitats, are generally missed or under-represented; for example, although it includes a mangrove class (no. 23), it missed information for particular areas and it was necessary to incorporate additional data from the UNEP-WCMC data set. Similarly, there is still no accurate or commonly agreed layer of wetlands (GLC2000 no. 22) worldwide, partly due to the finescale nature of many of these, but also because many wetlands are seasonal or sporadic and the vegetation present in many wetlands may lead to their being classed into other forest, grassland or shrub categories. In combining any two spatial layers, further inaccuracies may accrue due to mismatch between the layers. These inaccuracies may affect the precision of habitat extent or protection estimates for habitats that are naturally fragmented and narrow (such as coastal features) and does not allow a precise assessment of habitat distribution within separate sites. However, at the regional or global scale, these problems do not distort statistical outputs and the methods applied provide the best currently achievable estimates. (b) Results (i) Numbers and extent of protected areas The 104 791 protected areas in the WDPA cover a total surface of over 20 million km2. The majority of this represents terrestrial surfaces and they cover a total of 12.2% of the world land surface. By contrast, less than 2 million km2 of ocean are protected, a figure representing about 0.5% of the total ocean surface or about 1.4% of the coastal shelf areas. Table 2 provides a summary of the protected areas of the world based on geopolitical regions as defined by the WCPA. From this, it can be seen that there is considerable variation in the total area protected between regions. In fact, the very low level of protection provided for the Antarctic region is somewhat misleading as the entire continent is given a considerable level of protection by the Antarctic Treaty and its Protocol on Environmental Protection (Anon. 1991) and is considered by some to be a protected area in its entirety. If the Antarctic is excluded, then some 13.5% of the world’s land surface is protected. As might be expected, there is considerable variance in both the average size and the total number of
448
S. Chape and others
Extent and effectiveness of protected areas
Table 2. Distribution of protected areas by WCPA region. region
total sites
Central America South America North Americaa East Asia South East Asia Eastern and Southern Africa Caribbean South America (Brazil) Europe Australia/New Zealand Western and Central Africa Pacific North Africa and Middle East North Eurasia South Asia Antarctic
677 151 058 1507 2 217 725 13 414 4 450 119 3265 1 930 651 2674 791 681 4117 1 838 144 973 80 770 1280 1 321 751 43 837 699 761 9550 1 400 292 2583 1 302 812 404 418 641 1247 1 251 034 17 719 2 006 914 1478 344 248 66 70 233 104 791 20 275 834
a
total protected area
total protected land area
total no. marine sites
total protected marine area
total land area
percentage land area protected
133 731 2 056 559 4 231 839 1 904 342 715 218 1 825 918 36 469 1 305 864 634 248 831 420 1 293 206 54 949 1 226 928 1 789 006 339 058 3470 18 382 225
103 114 754 285 390 155 370 88 829 422 43 240 136 82 184 59 4254
17 327 161 166 218 280 26 309 76 463 12 226 44 301 15 887 65 513 568 872 9606 363 692 24 106 217 908 5190 66 763 1 893 609
521 600 9 306 560 23 724 226 11 799 212 4 480 990 11 487 920 234 840 8 547 400 5 119 172 8 011 930 12 804 860 553 058 12 954 170 22 110 050 4 487 510 14 024 832 150 168 330
25.6 22.1 17.8 16.1 16.0 15.9 15.5 15.3 12.4 10.4 10.1 9.9 9.5 8.1 7.6 0.0 12.2
North America here includes Greenland, but excludes the US state of Hawaii.
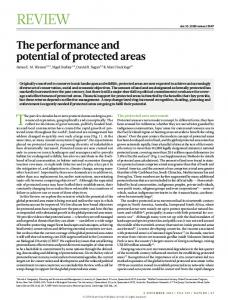
protected areas declared under each of the IUCN management categories. Category Ia and Ib sites are generally few in number and of average size, Category III sites are numerous but make up only 1% of the total protected areas coverage, while both Category II and VI cover very large areas but make up only 4% of the total number of sites each. These figures become more instructive at the level of individual regions, as shown in table 3. For example, in many regions it is one category that dominates the regional statistics, such as Category II in North America, Category IV in South Asia and North Eurasia, Category V in Europe and Category VI in North Africa–Middle East and Australia–New Zealand. In some cases, the regional dominance of particular categories is explained by single large protected areas, such as the Category VI Ar-Rub’al-Khali Wildlife Management Area (640 000 km2) in Saudi Arabia. The extensive global coverage of protected areas is a relatively recent phenomenon and figure 1 provides an illustration of the growth of the protected areas network over time. (ii) Biome and habitat coverage Earlier studies such as this one looked at biogeographic provinces developed by Udvardy (1975) and, while this is still a valid and interesting approach, it is important to point out that this is a biogeographic analysis. Owing to the extent of environmental change and widespread biodiversity loss, the boundaries of most biomes or ecological regions now define hypothetical zones of applicability, and their usefulness as biodiversity indicators is limited. However, biome- and ecoregionbased analyses do provide a theoretical framework that can function as a baseline for determining the extent of global change. We therefore present here a current Phil. Trans. R. Soc. B (2005)
analysis of the Udvardy biomes, supplemented with additional biome-level data derived by UNEP-WCMC for the Caspian Sea and the world’s oceans (table 4— except for oceans, owing to the large area relative to other biomes). The global coverage of different habitat types, total areas and percentages protected are shown in table 5 (in all sites including IUCN categories I–VI and those with no category assigned). The numbered habitats are those derived from the GLC2000 data layer, although it should be noted that not all of these are presented here as some were considered to be too unreliable for further investigation, including 22 (wetlands) and 23 (mangroves), as noted above. The findings from the separate studies on mountains, mangroves and coral reefs are also presented in table 5. These results clearly show a marked variation in the level of protection being offered to different habitats. However, by looking at actual habitat cover, it is particularly important to note that such statistics no longer represent the original vegetation cover—percentage protection may appear elevated as a result of widespread habitat loss and these figures should be read as ‘percentage of remaining habitat protected’. The theoretical biome approach and actual habitat/ land cover mapping are not directly comparable for all classes due to the different criteria used. However, the difference between the two approaches caused by habitat loss is illustrated by there being 16% of the remaining temperate grassland (as assessed by GLCC2000) protected, whereas only 5.95% of the extent of the Udvardy biome is protected. This is based on a total theoretically available Udvardy biome area of just over 9 million km2, compared with an estimated actual remaining habitat area of around 6.4 million km2—as well as differences in the resolution of the two methods of analysis.
Phil. Trans. R. Soc. B (2005)
Antarctic
Australia/ New Zealand Pacific
South East Asia
East Asia
South Asia
Western and Central Africa Eastern and Southern Africa North Africa and Middle East North Eurasia
South America (Brazil) South America (Hispanic) Europe
Central America
Caribbean
80 469 845 168 11 9180 16 82 769 180 11 833 58 56 331 1465 17 801 19 2946 22 6652 29 350 676 195 2672 31 63 908 43 25 072 287 216 679 2137 3524 27 67 735 88
North America
area no. of sites area no. of sites area no. of sites area no. of sites area no. of sites area no. of sites area no. of sites area no. of sites area no. of sites area no. of sites area no. of sites area no. of sites area no. of sites area no. of sites area no. of sites area no. of sites
Ia
region 478 492 701 90 18 165 1 — — 1925 28 37 146 508 11 384 7 1260 7 48 2 24 — 201 1 46 449 34 25 343 12 39 383 38 576 — — —
Ib 1 681 824 1362 24 087 164 31 180 95 159 742 177 520 550 222 101 043 265 342 195 90 509 651 218 229 808 72 95 471 66 72 294 139 105 900 78 205 195 254 309 644 681 6837 31 599 3
II 73 688 595 460 38 5475 49 2809 5 110 389 80 4344 3444 4 393 5 155 24 12 448 50 29 028 11 324 — — 20 323 34 4035 68 33 152 3948 723 24 — 2
III
Table 3. Distribution of protected areas by IUCN protected area management category in WCPA regions.
647 266 1338 31 221 284 13 628 198 5091 259 89 661 154 74 994 15 310 379 902 124 272 038 481 101 624 274 1 056 633 5 267 179 368 658 5938 121 138 877 199 251 100 1653 4368 77 365 23
IV 144 212 2082 3711 38 1462 5 134 233 115 113 405 164 293 411 3010 214 1 15 558 29 108 881 157 15 054 407 4608 11 1 631 329 2146 26 806 169 21 662 216 11 089 20 — 5
V 1 131 604 1287 24 005 192 43 532 100 183 251 67 536 993 254 21 924 203 106 705 46 530 362 224 776 049 28 95 724 54 24 244 11 58 660 77 197 908 830 593 162 489 346 600 54 — 1
VI
670 609 5204 4666 228 48 293 213 866 172 477 1 020 111 691 148 673 19 453 489 254 2291 620 976 3087 67 537 635 391 712 406 73 924 627 30 643 732 203 584 833 2864 388 45 553 193 1534 4
no category
Extent and effectiveness of protected areas S. Chape and others 449
450
S. Chape and others
Extent and effectiveness of protected areas
20 000 000 100 000 cumulative area sites of known date
18 000 000
cumulative no. of sites of known date
16 000 000
80 000
12 000 000
60 000
10 000 000
area in km2
number of sites
14 000 000
8 000 000
40 000
6 000 000 4 000 000
20 000
2 000 000
2003
1998
1993
1988
1983
1978
1973
1968
1963
1958
1953
1948
1943
1938
1933
1928
1923
1918
1913
1908
1903
1898
1893
1888
1883
1878
0 1873
0
year Figure 1. Growth of global protected areas over time. (Note: 38 427 PAs covering approximately 4 million km2 have no date and are not included in the cumulative graph.)
5. CAN WE USE PROTECTED AREAS AS INDICATORS FOR BIODIVERSITY TARGETS? All types of protected areas have a role in global in situ biodiversity conservation to a greater or lesser extent, whether they are managed as strict nature reserves, national parks, community conserved areas or managed resource areas. In the face of increasing human pressure on the planet’s resources, an effective global protected area system is the best hope for conserving viable, representative areas of natural ecosystems and their habitats and species. Therefore, protected areas are a valid, measurable indicator of progress in conserving the world’s remaining biodiversity, or at least slowing the rate
of loss. That, at least, is the theory. However, it must be understood that measurements of the number and extent of protected areas, at least at the formal governmental level, may only provide a superficial indication of the political commitment to conserving biodiversity. Based on a comprehensive global gap analysis undertaken by Conservation International in 2003, Rodrigues et al. (2004; p. 641) have concluded that “the degree to which biodiversity is represented within the existing network of protected areas is unknown”. Two factors are fundamental to understanding the issues associated with using protected areas as global biodiversity indicators: protected area location and design, and
Table 4. Protected area extent by Udvardy biome. Udvardy biomes
biome (km2)
extent of PAs (km2)
% biome protected
tropical humid forests sub-tropical/temperate rain forests/woodlands temperate needle-leaf forests/woodlands tropical dry forests/woodlands temperate broad-leaf forests evergreen sclerophyllous forests warm deserts/semideserts cold-winter deserts tundra communities tropical grasslands/savannas temperate grasslands mixed mountain systems mixed island systems mixed island systems (additional terr. 2004) lake systems Antarctic glaciers/tundra Caspian sea (added 2004) ocean (added 2004)
10 553 490 3 961 627 17 032 915 17 316 029 11 278 456 3 720 843 24 247 134 9 282 478 9 479 571 4 265 293 9 009 157 10 631 877 3 292 175 10 533 537 961 12 440 785 373 248 362 630 384
1 991 052 539 155 1 424 311 2 302 192 1 159 314 327 696 2 681 875 1 340 329 2 093 468 564 061 536 405 1 721 892 402 432 391 14 270 795 3934 2 099 456
18.87 13.61 8.36 13.30 10.28 8.81 11.06 14.44 22.08 13.22 5.95 16.20 12.22 3.71 2.65 0.01 1.05 0.58
Phil. Trans. R. Soc. B (2005)
Extent and effectiveness of protected areas
S. Chape and others 451
Table 5. Major habitat types—global coverage and the area protected. habitat name
1 2 3 4 5 6 7 8 9 10 11 12 13 14 15 16 17 18 19 20 21 24 25 26 29
tropical moist forest tropical dry broadleaf forest tropical and subtropical needle-leaf forest temperate and boreal broadleaf forest temperate and boreal mixed forest temperate and boreal needle-leaf forest temperate and boreal sparse forest savannah, tree cover mosaic savannah, tropical shrubland tropical grassland, savannahs shrubland, subtropical temperate grassland shrubland, subboreal warm semidesert warm desert cold semidesert cold desert shrubland, boreal and sub-polar tundra polar and high-altitude desert snow and ice cropland and natural vegetation mosaic cropland urban and built-up no data
total habitat area (1000 km2)
total area protected (1000 km2)
proportion protected (%)
9306 2830 2044 3965 3057 9210 1359 1850 5562 5795 2480 6376 1276 6274 10 769 5676 3259 2299 3972 739 14 275 6388 16 523 257 338
2798 342 304 577 376 1539 219 386 890 763 254 1175 301 617 1458 304 309 359 710 161 1130 535 866 12 91
23 11 13 13 11 14 14 17 14 12 9 16 19 9 12 5 9 14 15 18 7 8 5 5 21
mountains
39 433 364
5 996 622
15
mangrove coral reefs
233 588 255 339
44 002 53 632
19 21
the effectiveness of protected areas in achieving conservation objectives. (a) Protected area location and design issues Although a number of countries have designed and implemented protected area system plans (Davey 1998), studies have confirmed (e.g. Margules & Pressey 2000; Pressey et al. 2002; Rodrigues et al. 2003) that protected area establishment frequently does not correlate with identified conservation priorities. In particular, our global analysis (table 4) reveals a considerable mismatch in levels of protection between terrestrial and marine areas. The task of setting aside areas of ocean has barely begun, while the price already being paid for this shortfall can be measured in collapsing fish stocks and growing levels of pollution. Aside from the gross difference between the level of protection for terrestrial and marine realms, we know that even terrestrial protected area systems are inadequate. This inadequacy is confirmed by the Conservation International study which concluded that 12% of the species assessed were unrepresented in protected areas and that 25% were not present in any protected area larger than 1000 ha or in categories I–IV (Rodrigues et al. 2004). Protected area data, in combination with habitat and species information, can provide a basis for determining gaps in the extent of biodiversity protection, and thereby inform decision-makers and stakeholders about priorities for conservation action. However, the Phil. Trans. R. Soc. B (2005)
quality and relevance of the analysis clearly depends on the accuracy and resolution of the protected area boundary, habitat and species data and, as we have noted, there is considerable variation in the data currently available. On a related issue, the setting of minimum percentage targets for conservation of biomes or ecological regions (e.g. the 10% target agreed by contracting parties at CoP7) may create political comfort but does not provide a basis for realistic assessments. However, it is important that consistent indicators are set that are useful at sub-national, national, regional and global levels (Reid et al. 1993) and biomes/ecological regions continue to provide the baseline framework in which more detailed habitat, community and species level monitoring can occur. (b) Effectiveness of protected areas in achieving conservation objectives Throughout the world, but especially in the tropics, established protected areas are under severe threat (Brandon et al. 1998; Oates 1999; Carey et al. 2000; Bruner et al. 2001; MacKinnon in press). Carey et al. (2000; p. 18) have summarized significant threats to protected areas, in increasing order of importance, as: (i) Individual elements removed from the protected area without alteration to the overall structure (e.g. animal species used as bushmeat, exotic plants or over-fishing of specific species). (ii) Overall impoverishment of the ecology of the
452
S. Chape and others
Extent and effectiveness of protected areas
protected area (e.g. through encroachment, longterm air pollution damage or persistent poaching pressure). (iii) Major conversion and degradation (e.g. through the removal of vegetation cover, driving roads through the protected area, major settlements or mining). (iv) Isolation of protected areas (e.g. through major conversion of surrounding land). In the face of widespread threats to protected areas and their conservation values, it is essential that we understand and measure the dimensions of the problem; that is, to bring together information about protected area numbers, extent and ecological composition with assessments of conservation effectiveness of the existing network. By doing so, we can develop a set of sound indicators that can provide meaningful assessments of whether or not biodiversity targets are met. Unfortunately, existing protected area data held in the WDPA do not indicate if protected areas (as individual sites, national systems and global networks) are actually effective in achieving identified biodiversity conservation objectives. Existing numerical, spatial and geographic data therefore needs to be supplemented with relevant information that enables an assessment of conservation effectiveness. The achievement of conservation objectives is part of the assessment of overall management effectiveness of protected areas. Considerable work is being undertaken globally in this area, notably by the IUCN, WCPA (Hockings et al. 2000) and The Nature Conservancy (TNC 2003). The WCPA framework aims to provide overall guidance in the development of assessment systems, and to encourage standards for assessment and reporting. The framework is based on the principle that good protected area management follows a process that has six distinct stages: 1. it begins with understanding the context of existing values and threats, 2. progresses through planning, and 3. allocation of resources (inputs), and 4. as a result of management actions (processes), 5. eventually produces products and services (outputs), 6. that result in impacts or outcomes. Based on the IUCN framework, several other tools have been developed for assessing management effectiveness in individual protected areas and at the level of the protected area system. These include the WWF Rapid Assessment and Prioritization of Protected Areas Management (RAPPAM) methodology (Ervin 2003). Since 2001, assessments have been completed in a number of countries including Russia (Tyrlyshkin et al. 2003), China (Li et al. 2003) and Bhutan (Tshering 2003). In KwaZulu–Natal in South Africa (Goodman 2003), the RAPPAM methodology was used to prioritize budget allocations across the protected area system, based on management needs. In order to monitor the progress towards meeting its effectiveness target, the World Bank/WWF Alliance for Phil. Trans. R. Soc. B (2005)
Forest Conservation and Sustainable Use has published (Stolton et al. 2003) a simple site-level tracking tool to facilitate reporting on management effectiveness of protected areas within WWF and World Bank projects. The tracking tool has been built around the WCPA framework and has been adopted by the GEF and other agencies. The methodology can be modified to fit local needs to: (i) Identify the strengths and weaknesses of a protected area system. (ii) Analyse and compare a variety of pressures and threats across all protected areas within a system. (iii) Identify areas with high ecological and social importance, and determine conservation priorities. (iv) Develop and prioritize policy interventions and follow-up steps. (v) Complement more detailed, site-level assessments. WWF International is setting up a database to compile the results of interventions at WWF- and World Bank-assisted sites, although the primary beneficiaries and users of the results are protected area staff. The tool has been translated into French and Spanish as well as Chinese, Lao, Khmer, Vietnamese, Mongolian and Indonesian and tested at more than 200 sites worldwide. The original tracking tool was developed for forested protected areas but has also been adapted for use in marine protected areas, where it is currently being field-tested (Staub & Hatziolos 2004). However, there is as yet no globally accepted measure for assessing management effectiveness and the sheer number of protected areas means that a full assessment of management effectiveness for all sites worldwide remains unlikely in the short term. Even so, the CBD CoP7 endorsed a protected areas programme of work, which included under Goal 4.2 the following ambitious activities by states parties: 4.2.1 Develop and adopt, by 2006, appropriate methods, standards, criteria and indicators for evaluating the effectiveness of protected area management and governance and set up a related database, taking into account the IUCN-WCPA framework for evaluating management effectiveness, and other relevant methodologies, which should be adapted to local conditions. 4.2.2 Implement management effectiveness evaluations of at least 30 per cent of each Party’s protected areas by 2010 and of national protected area systems and, as appropriate, ecological networks (SCBD 2004). Both IUCN and WWF approaches to evaluating management effectiveness include measuring the achievement of protected area conservation objectives and the assessment of threats and vulnerability. However, for the purposes of assessing achievement of biodiversity targets, it may be more efficacious to adopt a separate set of simple measures that can be applied at national levels and collated at regional and
Extent and effectiveness of protected areas
S. Chape and others 453
Table 6. Parks Canada ecological integrity monitoring framework (Parks Canada 2004). biodiversity (characteristic of region)
ecosystem functions (resilient, evolutionary potential)
stressors (unimpaired system)
species richness change in species richness numbers and extent of exotics
succession/retrogression disturbance frequencies and size (fire, insects, flooding) vegetation age class distributions
human land-use patterns land use maps, road densities, population densities
population dynamics productivity mortality/natality rates of indicator remote or by site species immigration/emigration of indicator decomposition species by site population viability of indicator species
habitat fragmentation patch size, inter-patch distance, forest interior pollutants sewage, petrochemicals, etc. long-range transport of toxins
trophic structure size class distribution of all taxa predation levels
climate weather data frequency of extreme events
nutrient retention Ca, N per site
other park specific issues
global levels within the WDPA. Parks Canada (2004), for example, has successfully adopted a process of measuring ecological integrity (table 6) of its protected area system to assess the effectiveness of management actions, increase understanding of ecosystem change, find areas where further research is needed and serve as an ‘ecological baseline’ to which non-protected landscapes can be compared. Another national example of protected area monitoring is being applied in the Philippines for improving the conservation and management of coral reef protected areas (CCEF/CRMP 2002). Measured indicators include human activities and natural disturbances: fishing, tourism, population and land use impacts, climatic factors (typhoons, coral bleaching), condition of habitat and causes of coral damage, status of fish and other species and community perceptions of the marine protected area. 6. DELIVERING ACCURATE AND MEANINGFUL PROTECTED AREA INDICATORS FOR ASSESSING GLOBAL BIODIVERSITY TARGETS There are two fundamental actions (with associated information needs) required to achieve the 2010 biodiversity target, and the 2012 target for establishing an effective, globally representative marine protected areas system: (i) completing protected area systems and (ii) ensuring the biodiversity effectiveness of protected areas. (a) Completing protected area systems There is a need to improve the accuracy of data on the spatial distribution of protected areas within a timebased framework to enable equally accurate, and comprehensive, assessment of the conservation status of ecosystems/habitats and species. This requires: 1. Database. Improvements to the structure, content quality and access of the WDPA, continuing the global collaboration with international conservation organizations and improving interaction with Phil. Trans. R. Soc. B (2005)
national agencies and regional bodies responsible for protected area data collection. The relay of highquality protected areas’ numerical, areal and geographic data from countries to the WDPA on a regular basis—especially accurate polygon boundary information—linking to effective quality control mechanisms. 2. Analyses. Regular habitat and species gap analyses relative to assess the efficacy of protected area networks at national, regional and global levels. 3. Communicating results. Publication and wide dissemination of annual analytical status reports on protected areas data—including reports on the conservation effectiveness issues discussed below. (b) Ensuring the biodiversity conservation effectiveness of protected areas Conservation effectiveness is the key to achieving and sustaining global biodiversity targets, and appropriate measures need to be incorporated into monitoring and reporting processes as soon as possible. Although work still needs to be done to improve the accuracy of measurements of the extent of protected areas, there is a level of urgency in the need to measure conservation effectiveness within the short time-frame available before 2010. As we have seen, the tools have been developed—it is a question of agreeing on an appropriate standard set of indicators that can be recorded and compared for global analyses. The following actions need to be taken. (i) Ensure a global approach to assessment Develop a global approach to the design and application of conservation effectiveness indicators. The necessary design work could be undertaken by the Ongoing Ad Hoc Technical Working Group on Protected Areas established at the CBD CoP7 and the international specialist organizations assigned as partners in the implementation of the CBD Programme of Work on Protected Areas (IUCN WCPA, UNEP-WCMC, WWF, etc.).
454
S. Chape and others
Extent and effectiveness of protected areas
(ii) Measure biodiversity conservation effectiveness Develop and implement a global protected areas monitoring project to measure baseline and ongoing conservation effectiveness over a minimum 5–10 year period—potentially expressed through measures of ecological integrity. Ideally, such a project should include every country but would at least need to include a representative sample of protected areas in all biomes/ecoregions. (iii) Incorporate new data layers Improve the capacity of the WDPA to incorporate relevant key data on habitats and species and to correlate with other global environmental and biodiversity databases, and also other factors that contribute to an understanding of key management effectiveness issues: for example, budgets (as a proportion of GDP), staffing, or visitor numbers. As management effectiveness measures become more widely available, they will improve the resolution of the WDPA to provide indicators of progress towards achieving targets. An ‘indicator subset’ of the WDPA should be created specifically to assist the indicator biodiversity reporting process. (iv) More effective application of IUCN protected area management categories IUCN management categories also have a potentially important role in regional and global analyses because they provide a common language and enable the comparison and summation of protected areas on the basis of management objectives. If uniformly adopted and properly applied, the categories provide another layer of useful information that can be used in the evaluation of management and conservation effectiveness, and action needs to be taken at all levels to improve their use.
7. CONCLUSION This paper has stressed the importance of a comprehensive approach to the use of protected areas as an indicator for meeting global biodiversity targets. Measurements of numbers and extent must be combined with assessments of conservation effectiveness to achieve meaningful results. Monitoring methodologies are being applied by different organizations and national agencies in a number of the world’s protected areas that have the potential for use in measuring the status of protected areas at the global level. The challenge is to define a standard methodology and apply it consistently in countries so that meaningful results can be derived. This would allow examination of whether global biodiversity targets are being met. As indicated in this review, there are significant inaccuracies in the current spatial data on the world’s protected areas, which in turn means there is imprecision in identifying conservation gaps and defining priorities. Yet these inaccuracies can be addressed in a relatively straightforward manner, given sufficient technical and financial resources and concerted action. Above all, national governments need to progress the protected areas agenda adopted at the CBD CoP7—including the endorsed outcomes of the Fifth World Parks Congress held in 2004—to provide effective protection regimes to conserve the world’s remaining biodiversity. The application of such effectiveness is the test of real political will, expressed through good governance, enforcement of legal protection and provision of resources necessary for protected area management. The authors are grateful for the valuable comments and contributions of Dr Kathy MacKinnon, Lead Biodiversity Specialist, World Bank and Cambridge Biodiversity Group visiting scholar.
REFERENCES (c) Use of remote sensing technology More widespread and better use needs to be made of remote sensing technology. For example, the NASA ASTER (Advanced Spaceborne Thermal Emission and Reflection Radiometer) remote sensing system was launched in 1999 with an expected life of more than 6 years, and clearly has great potential to support protected areas monitoring from national to global scales. ASTER is recording 600 high-resolution images a day, each one covering an area of 60 km2, with a pixel size of 15 m. NASA is using the system to compile a prototype ‘protected areas archive’ with a simple set of effective tools available for field level use by protected area managers (NASA 2004). Such linkages with high-resolution remote sensing data could assist in developing more complex GIS models to look at a range of measures of ‘conservation effectiveness’. It would be possible, for example, to investigate critical issues such as connectivity and potential for ecological networks, boundary length and threats (such as population densities within threshold distances from park boundaries and adjacent land/resource uses). Phil. Trans. R. Soc. B (2005)
Adams, A. B., 1964 Proceedings of the First World Conference on National Parks. Washington, DC: National Parks Service, US Department of the Interior. Anon. 1991 Protocol on Environmental Protection to the Antarctic Treaty (1991). See British Antarctic Survey: www.antarctica.ac.uk/About_Antarctica/Treaty/protocol. html. Bartholome, E. et al. 2002 GLC 2000—global land cover mapping for the year 2000. Project status report. November 2002. Italy: European Communities. Blyth, S., Groombridge, B., Lysenko, I., Miles, L. & Newton, A. 2002 Mountain watch: environmental change & sustainable development in mountains. Cambridge, UK: UNEP World Conservation Monitoring Centre. Brandon, K., Redford, K. H. & Sanderson, S. E., 1998 Parks in peril: people, politics and protected areas. Washington, DC: The Nature Conservancy and Island Press. Brockman, C. F. & Curry-Lindahl, K. 1964 Problems of nomenclature: the need for definitions. Proceedings of the First World Conference on National Parks, pp. 366–367. Washington, DC: National Park Service, US Department of Interior. Bruner, A. G., Gullison, R. E., Rice, R. E. & Fonseca, G. A. B. 2001 Effectiveness of parks in protecting tropical biodiversity. Science 291, 125–128.
Extent and effectiveness of protected areas
Carey, C., Dudley, N. & Stolton, S. 2000. Squandering paradise?. Gland, Switzerland: WWF International. Chape, S., Blyth, S., Fish, L., Fox, P. & Spalding, M. 2003. United Nations list of protected areas. Cambridge, UK/Gland, Switzerland: UNEP-World Conservation Monitoring Centre/IUCN–The World Conservation Union. Coastal Conservation and Education Foundation Inc. and Coastal Resource Management Project (CCEF/CRMP). 2002. Marine protected area report guide: improving coral reef marine protected area management in the Philippines. See www.coast.ph/projects.html. Davey, A. G. 1998. National system planning for protected areas. Gland, Switzerland: IUCN. Dudley, N. & Stolton, S. 2003 Running pure: the importance of forest protected areas to drinking water.. A Research report for the World Bank/WWF alliance for forest conservation and sustainable use. Gland, Switzerland: WWF International. Ervin, J. 2003 WWF: rapid assessment and prioritization of protected area management (RAPPAM) methodology. Gland, Switzerland: WWF International. FAO 2000 Land cover classification system—LCCS. Rome, Italy: Food and Agriculture Organization of the United Nations. Goodman, P. S. 2003 South Africa: management effectiveness assessment of protected areas in KwaZulu-Natal using WWF’s RAPPAM methodology. Gland, Switzerland: WWF. Grove, R. H. 1995 Green imperialism: colonial expansion, tropical island Edens and the origins of environmentalism, pp. 1600-1860. Cambridge, UK: Cambridge University Press. Hansen, M., DeFries, R., Townshend, J. R. G. & Sohlberg, R. 1998 Land cover classification derived from AVHRR. College Park, MD: The Global Land Cover Facility. Hansen, M., DeFries, R., Townshend, J. R. G. & Sohlberg, R. 2000 Global land cover classification at 1 km resolution using a decision tree classifier. Int. J. Remote Sensing 21, 1331–1365. Hockings, M., Stolton, S. & Dudley, N. 2000 Assessing effectiveness—a framework for assessing management effectiveness of protected areas. Switzerland: University of Cardiff/ IUCN. IUCN—The World Conservation Union 1994 Guidelines for protected area management categories. Gland, Switzerland: IUCN. Li, D., Zhou, J., Dong, K., Wu, B. & Zhu, C. 2003 China: management effectiveness assessment of protected areas in the Upper Yangtze ecoregion using WWF’s RAPPAM methodology. Gland, Switzerland: WWF. MacKinnon, K. In press Megadiversity in crisis: politics, policies and governance in Indonesia’s forests. In Emerging threats to tropical forests (ed. W. Laurance & C. Peres). Chicago: University of Chicago Press. Margules, C. R. & Pressey, R. L. 2000 Systematic conservation planning. Nature 405, 243–253. McNeely, J. A. 1998 How protected areas can respond to the changing nature of society. In Protected areas in the 21st century: from islands to networks. pp. 189–202, Gland, Switzerland: IUCN. Mulongoy, K. J. & Chape, S., 2004 Protected areas and biodiversity: an overview of key issues Secretariat of the convention on biological diversity and UNEP-WCMC. Biodiversity series no. 21. Cambridge, UK: UNEP-World Conservation Monitoring Centre. National Aeronautic and Space Administration (NASA). 2004 ASTER Protected Area Archive. See http://asterweb. jpl.nasa.gov/APAA/concept.htm.
Phil. Trans. R. Soc. B (2005)
S. Chape and others 455
Oates, J. 1999 Myth and reality in the rain forest: how conservation strategies are failing in West Africa. Berkeley: University of California Press. Parks Canada. 2004 The EI monitoring framework. See www. pc.gc.ca/progs/np-pn/ecosystem/ecosystem3_e.asp. Phillips, A. 2003 A modern paradigm. World Conservation, 2/2003, pp. 6–7. Gland, Switzerland: IUCN—The World Conservation Union. Pierce, S., Cowling, R., Sandwith, T. & MacKinnon, K., 2002 Mainstreaming biodiversity in development: case studies from South Africa. Washington, DC: World Bank. Pressey, R. L., Whish, G. L., Barrett, T. W. & Watts, M. E. 2002 Effectiveness of protected areas in north-eastern New South Wales: recent trends in six measures. Biol. Conserv. 106, 57–69. Reid, W. V., McNeely, J. A., Tunstall, D. B., Bryant, D. A. & Winograd, M. 1993 Biodiversity indicators for policy makers. Contribution to the WRI/IUCN/UNEP global biodiversity strategy. Washington/Gland, Switzerland: World Resources Institute/IUCN—The World Conservation Union. Rodrigues, A. S. L. et al. 2003 Global gap analysis: towards a representative network of protected areas. Advances in applied biodiversity science 5. Washington, DC: Conservation International. Rodrigues, A. S. L. et al. 2004 Effectiveness of the global protected area network in representing species diversity. Nature 428(8), 640–643. Secretariat of the Convention on Biological Diversity (SCBD) 2003 Status and trends of, and threats to, protected areas. UNEP/CBD/SBSTTA/9/5/Rev.1. Montreal: SCBD. Secretariat of the Convention on Biological Diversity (SCBD) 2004 Decisions adopted by the Conference of the Parties to the Convention on Biological Diversity at its Seventh Meeting. UNEP/CBD/COP/7/21. Montreal: SCBD. Spalding, M. D., Blasco, F. & Field, C. D., 1997 World mangrove atlas. Okinawa, Japan: International Society for Mangrove Ecosystems. Spalding, M. D., Ravilious, C. & Green, E. P. 2001 World atlas of coral reefs. Berkeley: University of California Press. Spalding, M. D., Jenkins, M. & Chape, S. (eds) In preparation The World’s Protected Areas. Cambridge, UK: UNEP World Conservation Monitoring Centre. Staub, F. & Hatziolos, M. 2004 Score card to assess progress in achieving management effectiveness goals for marine protected areas. Washington, DC: World Bank. Stolton, S., Hockings, M., Dudley, N., MacKinnon, K. & Whitten, T. 2003 Reporting progress in protected areas. A sitelevel management effectiveness tracking tool. Washington, DC: World Bank, WWF Alliance. The Nature Conservancy (TNC) 2003 The 5S framework for site conservation: a practioner’s handbook for site conservation planning. Washington, DC: TNC. Tshering, K. 2003 Bhutan: management effectiveness assessment of four protected areas using WWF’s RAPPAM methodology. Gland, Switzerland: WWF. Tyrlyshkin, V., Blagovidov, A. & Belokurov, A. 2003 Russia: management effectiveness assessment of protected areas using WWF’s RAPPAM methodology. Gland, Switzerland: WWF. Udvardy, M. 1975 A classification of the biogeographical provinces of the world Prepared as a contribution to UNESCO’s Man and the Biosphere Programme Project No. 18. Morges, Switzerland: IUCN.