elab.vanderbilt.edu
Measuring the Flow Construct in Online Environments: A Structural Modeling Approach
Thomas P. Novak
[email protected]
Donna L. Hoffman
[email protected]
Owen Graduate School of Management, Vanderbilt University
Yiu-Fai Yung
[email protected]
L.L. Thurstone Psychometric Laboratory, University of North Carolina, Chapel Hill
May 1998
This is a working paper.
Measuring the Flow Construct in Online Environments: A Structural Modeling Approach ABSTRACT
Though marketers have made great strides in understanding the Internet, they still understand little about what makes for a compelling consumer experience online. Recently, the flow construct has been proposed as important for understanding consumer behavior on the World Wide Web. Although widely studied over the past twenty years, quantitative modeling efforts of the flow construct have been neither systematic nor comprehensive. In large parts, these efforts have been hampered by considerable confusion regarding the exact conceptual definition of flow. Lacking precise definition, it has been difficult to measure flow empirically, let alone apply the concept in practice. Following the conceptual model of flow proposed by Hoffman and Novak (1996), we conceptualize flow as a complex multidimensional construct characterized by directed relationships among a set of unidimensional constructs, most of which have previously been incorporated in various definitions of flow. In a quantitative modeling framework, we use data collected from a large-sample Web-based consumer survey to measure this set of constructs, and fit a series of structural equation models that test Hoffman and Novak’s (1996) theory. The conceptual model is largely supported and the improved fit offered by the revised model provides additional insights into the antecedents and consequences of flow. A key insight from the paper is that the degree to which the online experience is compelling can be defined and measured. As such, our flow model may be useful both theoretically and in practice as marketers strive to decipher the secrets of commercial success in interactive online environments.
1
1. INTRODUCTION Though marketers are beginning to gain an understanding of the marketing strategies that will attract visitors to Web sites (Hoffman, Novak, and Chatterjee 1995; Morr 1997; Schwartz 1996; Tchong 1998), very little is known about how to entertain and retain customers once they arrive. Among marketing academics and Internet practitioners alike, there is a lack of genuine knowledge about what makes for effective interactions with online customers, although intuition suggests that creating a compelling online environment for Web consumers will have numerous positive consequences for commercial Web providers. Hoffman and Novak (1996) recently proposed that repeat visits to Web sites depends on facilitating flow (Csikszentmihalyi 1977), and suggest that the marketing objective during the trial of an online environment should be directed toward providing for these “flow opportunities” (Hoffman and Novak 1996, page 66). Previous researchers (e.g. Csikszentmihalyi 1990; Ghani, Supnick and Rooney 1991; Trevino and Webster 1992; Webster, Trevino and Ryan 1993) have noted that flow is a useful construct for describing more general human-computer interactions. Hoffman and Novak extended the idea to encompass consumer navigation behavior in online environments such as the World Wide Web, and defined flow as “the state occurring during network navigation which is: (1) characterized by a seamless sequence of responses facilitated by machine interactivity, (2) intrinsically enjoyable, (3) accompanied by a loss of self-consciousness, and (4) self-reinforcing.” To experience flow while engaged in an online activity, consumers must perceive a balance between their skills and the challenges of the activity, and both their skills and challenges must be above a critical threshold. Hoffman and Novak (1996) provided a conceptual model of flow that detailed its antecedents and consequences. They proposed that flow has a number of positive marketing consequences, including increased consumer learning, exploratory behavior, and positive affect, but did not test the model. In this paper, we present the results of an extensive empirical test of Hoffman and Novak’s conceptual model. Using a rigorous, quantitative approach to theory development and testing, we 1) identify and develop a set
2
of scales for measuring the constructs proposed in Hoffman and Novak’s conceptual model; 2) evaluate the conceptual model using structural equation methodology, and; 3) revise the model based upon empirical data from a large-sample Web-based consumer survey. We begin by describing the flow construct and models of flow that have been proposed. In the second section, we discuss the set of constructs we use to evaluate Hoffman and Novak’s conceptual model of flow, and the hypotheses which follow from the model. Section three describes our instrumentation, data collection and sample splitting procedures. The results of our empirical analysis are contained in sections four through six. We test the conceptual model using structural equation modeling techniques and provide evidence of construct reliability. A series of model modifications applied to our calibration sample produces a revised conceptual model, which we cross-validate using a new sample. We introduce a new, straightforward approach for assessing the degree to which various aspects of the structural equation model cross-validate. We conclude with a discussion of the theoretical and managerial implications of our research. While we model the flow construct in the context of Web usage and provide a comprehensive test of Hoffman and Novak’s (1996) conceptual model, we also view our research as a test of flow theory itself. Our research represents the most comprehensive attempt to date to bring quantitative modeling to bear upon the measurement of constructs that together constitute what has been called flow.
1.1. The flow construct Despite its relevance to computer-mediated environments, flow has proven to be an elusive construct to define. What is flow? Table 1 provides definitions and descriptions of flow from 16 key studies. As one reads through this list, the phrases listed seem to make intuitive sense. For example, flow is "the holistic sensation that people feel when they act with total involvement,” (Csikszentimihalyi 1977), or “a state of mind sometimes experienced by people who are deeply involved in some event, object or
3
activity” (Ghani and Deshpande 1994). However, the exercise of reading through these phrases in an attempt to create an operational definition of flow can be frustrating. One is not left with a central definition of flow, but instead a wide variety of constructs which tend to be experienced when one experiences flow. Some of these constructs define or cause flow, and some of these are experienced as a result of being in the flow state. Hoffman and Novak (1996) propose, for example, that centering of attention is a necessary condition for achieving flow, as are congruent skills and challenges that are above a critical level.
Table 1 - Definitions of Flow Reference:
Conceptual or Operational Definition:
Csikszentmihalyi (1977)
"the holistic sensation that people feel when they act with total involvement" (p36) when in the flow state "players shift into a common mode of experience when they become absorbed in their activity. This mode is characterized by a narrowing of the focus of awareness, so that irrelevant perceptions and thoughts are filtered out; by loss of self-consciousness; by a responsiveness to clear goals and unambiguous feedback; and by a sense of control over the environment...it is this common flow experience that people adduce as the main reason for performing the activity" (p72)
Privette and Bundrick (1987)
"Flow..., defined as an intrinsically enjoyable experience, is similar to both peak experience and peak performance, as it shares the enjoyment of valuing of peak experience and the behavior of peak performance. Flow per se does not imply optimal joy or performance but may include either or both." [p316]
Csikszentmihalyi and Csikszentmihalyi (1988)
"The flow experience begins only when challenges and skills are above a certain level, and are in balance." [p260]
Mannell, Zuzanek, and Larson (1988)
"Csikszentmihalyi (1975) describes the flow experience as 'one of complete involvement of the actor with his activity' (p. 36), and he has identified a number of elements that are indicators of its occurrence and intensity. These indicators include: the perception that personal skills and the challenges provided by an activity are imbalance, centering of attention, loss of self-consciousness, unambiguous feedback to a person's actions, feelings of control over actions and environment, and momentary loss of anxiety and constraint, and enjoyment or pleasure." [p291] "Flow was operationalized by measuring the affect, potency, concentration, and the perception of a skill/challenge balance ." [p292]¨
Massimini and Carli (1988)
congruent skills and challenges that are above each subject's average weekly levels
LeFevre (1988)
"a balanced ratio of challenges to skills above average weekly levels" (p307)
Csikszentmihalyi and LeFevre (1989)
"When both challenges and skills are high, the person is not only enjoying the moment, but is also stretching his or her capabilities with the likelihood of learning new skills and increasing selfesteem and personal complexity. This process of optimal experience has been called flow."
Csikszentmihalyi
we feel "in control of our actions, masters of our own fate...we feel a sense of exhilaration, a deep sense of enjoyment" (p3)
4
(1990) "the state in which people are so intensely involved in an activity that nothing else seems to matter; the experience itself is so enjoyable that people will do it even at great cost, for the sheer sake of doing it." Ghani, Supnick and Rooney (1991)
"two key characteristics of flow: the total concentration in an activity and the enjoyment which one derives from an activity...the precondition for flow is a balance between the challenges perceived in a given situation and skills a person brings to it" (p230) "a related factor is the sense of control over one's environment" (p231)
Trevino and Webster (1992)
"flow characterizes the perceived interaction with CMC technologies as more or less playful and exploratory"..Flow theory suggests that involvement in a playful, exploratory experience - the flow state - is self-motivating because it is pleasurable and encourages repetition. Flow is a continuous variable ranging from none to intense." [p540] "Flow represents the extent to which (a) the user perceives a sense of control over the computer interaction, (b) the user perceives that his or her attention is focused on the interaction, (c) the user's curiosity is aroused during the interaction, and (d) the user finds the interaction intrinsically interesting.." [p542]
Webster, Trevino and Ryan (1993)
"the flow state is characterized by four dimensions...(a) the user perceives a sense of control over the computer interaction, (b) the user perceives that his or her attention is focused on the interaction, (c) the user's curiosity is aroused during the interaction, and (d) the user finds the interaction intrinsically interesting. [p413]
Clarke and Haworth (1994)
"the subjective experience that accompanies performance in a situation where the challenges are matched by the person's skills. Descriptions of the feeling of 'flow' indicate an experience that is totally satisfying beyond a sense of having fun." [p511]
Ellis, Voelkl and Morris (1994)
"..an optimal experience that stems from peoples' perceptions of challenges and skills in given situations. Situations in which challenges and skills are perceived to be equivalent are thought to facilitate the emergence of such indicators of flow as positive affect and high levels of arousal, intrinsic motivation, and perceived freedom" [p337]
Ghani and Deshpande (1994)
"The two key characteristics of flow are (a) total concentration in an activity and (b) the enjoyment which one derives from an activity...There is an optimum level of challenge relative to a certain skill level. ...A second factor affecting the experience of flow is a sense of control over one's environment." [p383]
Lutz and Guiry (1994)
"Psychologists use the term 'flow' to describe a state of mind sometimes experienced by people who are deeply involved in some event, object or activity...they are completely and totally immersed in it...Indeed, time may seem to stand still and nothing else seems to matter while engaged in the consumption event." [from respondent instructions]
Hoffman and Novak (1996)
"the state occurring during network navigation which is 1) characterized by a seamless sequence of responses facilitated by machine interactivity, 2) intrinsically enjoyable, 3) accompanied by a loss of self-consciousness, and 4) self-reinforcing... [and] extends a sense of playfulness. ... Consumers must focus their attention on the interaction...and they must perceive a balance between their skills and challenges....two additional antecedents - interactivity and teleprescence - enhance flow"
Consider two definitions that have been proposed by Trevino & Webster (1992) and by Csikszentmihalyi & Csikszentmihalyi (1988). Trevino and Webster (1992) operationally define flow as the linear combination of four characteristics: control, attention, curiosity, and intrinsic interest. But it is not
5
clear why these four characteristics should be used. Do they define flow, or are they better thought of as antecedents, or consequences, of flow? The other definition, from Csikszentmihalyi & Csikszentmihalyi (1988) is quite different, focusing upon the congruence of a person's skills in a given activity, and their perceptions of the challenges of the activity. The definition also states that there is a critical value that skills and challenges must be above. Thus, it is not simply the fact that skills and challenges are congruent, they must also be high. This is different from many early definitions of flow in terms of skill/challenge congruence, which considered low skill and low challenge activities (take chewing bubble gum as an extreme example) to also produce flow (Csikszentmihalyi 1977). A critical analysis of the descriptions of the flow construct that have appeared in the literature is provided by Marr (1998):
In lieu of defining and investigating a single dependent measure for flow that could be a critical aspect of the phenomenon, Csikszentmihalyi instead hypothesizes a cloud of mental events that in sum constitute flow. Flow becomes an epiphenomenon like consciousness, an emergent phenomenon that is greater than the sum of its parts. Thus Csikszentmihalyi defines flow as a ‘holistic’ experience that emerges from an array of simple physiological and mental events that are integrated with one another. Flow represents the voluntary investment of attention that occurs during the perception of a matching of demand and skill that produces a sense of self control, a state of joy or ecstasy, with possible outcomes including a reduction in ‘ontological anxiety’, a feeling of well being, and a heightened sense of awareness, playfulness, and creativity. All of these mental events were hypothesized as integral to the experience, and were further expanded through the profuse number of literary and metaphorical descriptions that were layered onto the flow experience...This layer cake of interpretations has resulted in the massive obfuscation of the essential dependent variables that constitute flow.
6
While Marr then offers the construct of “relaxation” as a substitute for “flow,” we take a different approach. We agree that the wide range of descriptions of flow provided in the literature, as evidence in Table 1, make it impossible to specify a simple unidimensional conceptual definition of flow. However, following Hoffman and Novak (1996), we believe that the constructs represented in Table 1 can be neatly categorized into sets of antecedents and consequences of what has been called flow. We consider flow to be a complex multidimensional construct, characterized by relationships among a large set of unidimensional constructs that have been proposed as components of flow by various researchers.
1.2. Models of flow Our conceptual model of flow in computer-mediated environments is described in detail in Hoffman and Novak (1996) and later in this paper. While many of the constructs in our model have been tested alone or in limited combinations in previous research, the model we propose and test in this paper is considerably more comprehensive than any previous empirical model of the flow construct. Previous simpler structural models of flow (e.g., Trevino & Webster 1992; Webster, Trevino & Ryan 1993; Ghani, Supnick & Rooney 1991; Ghani & Deshpande 1994), have generally supported prior theory. Consider the model fit by Ghani, Supnick & Rooney (1991). Control and challenges were found to predict flow, which was operationalized as four items for enjoyment and four for concentration. Control and flow predicted exploratory use, which in turn predicted extent of use. In a later study, Ghani and Deshpande (1994) included skill as well as challenge. The resulting model is simple, but quite interesting, in that skill leads to control which leads to flow. Skill also directly affects flow, as does perceived challenge. This model provides empirical support for definitions of flow that specify that flow occurs when challenges and flow are both high, since skill and challenges independently contribute to flow. Another structural equation model was fit by Trevino and Webster (1992). A different operational definition of flow is used in this research, consisting of four items measuring control, attention focus, curiosity, and
7
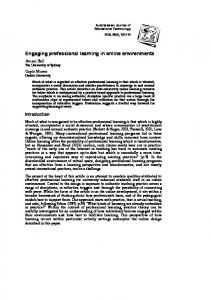
intrinsic interest). Skill was measured, but not challenges. Ease of use was identified as an intermediate variable between skill and flow. One difficulty with previous structural modeling research has been the operational definition of flow. Constructs of enjoyment, concentration, control, attention focus, curiosity and intrinsic interest are used to define flow, rather than being considered as potential antecedents or consequences of flow. “Flow channel segmentation models,” based upon Csikszentmihalyi's definition of flow in terms of congruence of skills and challenges, provide a simpler alternative to structural modeling (e.g., Ellis, Voelkl & Morris 1994; LeFevre 1988; Nakamura 1988; and Wells 1988). These segmentation models attempt to account for all possible combinations (channels) of high/low skills and challenges. Early channel models used three or four channels to identify flow in terms of congruent (high or low) skills and challenges. The eight channel model (Massimini & Carli 1988; Ellis, Voelkl & Morris 1994) naturally extends these earlier models by allowing for intermediate (moderate) levels of skills and challenges. Figure 1 shows our conceptualization of the eight-channel model, superimposing dimensions of skills and challenges. The horizontal direction corresponds to the sum of skills plus challenges (apathy vs. flow), while the vertical direction corresponds to the difference of skills minus challenges (boredom vs. anxiety). The southwest to northeast direction corresponds to skills (control vs. worry), while the northwest to southeast direction corresponds to challenges (arousal vs. relaxation). The eight channel model thus proposes four bipolar constructs which lie in a two dimensional space, and where the space is spanned by orthogonal vectors for skills and challenges.
8
S k ills - C h a l l e n g e s
Sk
ill
s
BOREDOM
CONTROL
RELAXATION
APATHY
S k ills + C h a llenges
FLOW
AROUSAL
WORRY
C ANXIETY
ha
lle
ng
es
Figure 1 - Eight Channel Flow Model
2. MODEL HYPOTHESES A set of 13 constructs appearing in the 16 definitions of flow in Table 1 are identified in Table 2. These 13 constructs, when organized into sets of antecedents and consequences, underlie our conceptual model of flow. Refer to Hoffman and Novak (1996) for a theoretical discussion of these constructs.
9
X
Csikszentmihalyi & Csikszentmihalyi (1988)
X
Mannell, Zuzanek, and Larson (1988) Massimini and Carli (1988) LeFevre (1988) Csikszentmihalyi and LeFevre (1989)
X
X
X
X
X
X X
X
X
X
X X
Webster, Trevino and Ryan (1993)
X
X
time distortion
X X
X
X
X
X
X
X X
X X
X
X
X
Clarke and Haworth (1994)
X
X
Trevino and Webster (1992)
X
X X
X
X
X
X
Lutz and Guiry (1994) Hoffman and Novak (1996)
X
X X
X
Ghani, Supnick and Rooney (1991)
X
X
Csikszentmihalyi (1990)
Ghani and Deshpande (1994)
telepresence
X
Privette and Bundrick (1987)
Ellis, Voelkl and Morris (1994)
skill
X
positive affect
X
playfullness
invovlement
X
OSL
interactivity
X
Csikszentmihalyi (1977)
focused attention
exploratory behavior
control
challenge
arousal
Table 2 - Flow Constructs
X
X
X X
X
X
X
X
While Hoffman and Novak (1996) discussed skill and challenge as antecedents of flow, here we draw from the 8 channel flow segmentation model shown in Figure 1, and incorporate additional intermediate constructs. Thus, we consider skill as an antecedent of control, which is an antecedent of flow. While Hoffman and Novak (1996) considered perceived behavioral control to be an outcome of flow, most previous research, and the flow channel segmentation models, assumes control is an antecedent; thus, our theoretical model makes this assumption as well. Similarly, challenge is considered to be an antecedent of arousal, which was not explicitly considered by Hoffman and Novak. Arousal, in turn, is an antecedent of flow. We further extend the conceptualization developed by Hoffman and Novak (1996) by
10
incorporating the playfulness construct as an additional measure of flow. We expect that the antecedents and consequences of what has been called flow will also be the antecedents and consequences of playfulness. We believe that the unidimensional playfulness construct is a central component of flow, and will relate to constructs such as skill, challenge, and exploratory behavior in the same way that researchers have suggested flow relates to these constructs (e.g. Webster and Ho, 1997; Webster and Martocchio, 1995; Webster, Trevino and Ryan, 1993; Starbuck and Webster, 1991). Our hypotheses are specified in the complete theory-based structural equation model shown in Figure 2 (please look ahead to page 17). With the exceptions of the hypotheses involving arousal, control, and playfulness, these derive directly from Hoffman and Novak (1996). Table 3 organizes 13 constructs, plus three measured variables for Web usage, according to their hypothesized temporal position in the sequence of antecedents and consequences of flow. This organization was also used to help ensure that modifications made to our theoretical model were driven by prior theory. The column numbers in Table 3 correspond to the order in the hypothesized causal sequence. That is, a construct in column (1) could predict one in column (3) which could predict one in column (5), or a construct in column (3) could predict another in column (3). But we would not predict that a construct in column (3) would predict one in column (2). From Table 3 and Figure 2, the time the respondent uses the Web per week, plus the time the respondent started using the Web, are Web usage variables hypothesized to predict the respondent’s skill, which is one of the primary antecedents of flow from the flow channel segmentation model. As noted, skill in turn predicts control. We hypothesize that both skill and control predict playfulness. Similarly, challenge predicts arousal, and both predict play. The background variable Optimum Stimulation Level (OSL) is hypothesized to predict both playfulness (Hoffman and Novak 1996) and exploratory behavior. Interactivity is a content characteristic (i.e. a characteristic inherent to the Web medium), which predicts both playfulness as well as the secondary antecedents of focused attention and telepresence. Both of these secondary antecedents in turn predict playfulness. Finally, we hypothesize that four consequences of flow
11
will be predicted from playfulness, including the Web usage variable measuring how much the respondent expects to use the Web in the coming year. In sum, our theory argues that flow, represented by the structural model in Figure 2, is a complex multidimensional construct that consists of directed relationships among a set of thirteen unidimensional constructs and three key Web usage variables.
Table 3 - Antecedents, Correlates, and Consequences of Flow
time use Web start use Web involvement OSL interactivity skill challenge control arousal focused attention telepresence playfulness expect use Web positive affect explore time distortion
(1) (2) Background Content Variables Characteristi c X X X X X
(3) Primary antecedents
(4) Secondary antecedents
(5) Flow correlates
(6) Flow consequences
X X X X X X X X X X X
12
3. INSTRUMENTATION AND DATA COLLECTION 3.1 Survey Items The 13 constructs that comprise flow are operationalized as 9-point rating or semantic differential scales. In addition, the three Web usage variables specify when the respondent started using the Web, how much time per day the respondent spends using the Web, and how much time the respondent expects to use the Web in the future. Appendix A describes a series of four small-scale, and one large-scale, pilot tests used to develop our final survey instrument. Appendix B lists the 66 items corresponding to the 13 constructs and three background variables used in our final survey. Items that were reverse-scaled are indicated with (R) in Appendix B. The first three items deal with Web usage, two of which are antecedents of flow (startuse and timeuse) and one which is a consequence (exuse). Six sets of items - skill, challenge, playfulness, focused attention, importance and interactivitywere essentially identical to the items used in the large-scale pilot. The four-item scales for skill and challenge were developed over the series of pilot tests, beginning with a set of 15 items for each construct. In the large-scale pilot, the four skill items had a coefficient alpha of .864 and the four challenge items had a coefficient alpha of .876. The seven item playfulness scale is from Webster and Martocchio (1992) (alpha = .782 in the large-scale pilot ). The four item focused attention scale is from Ghani and Deshpande (1994) (alpha = .638 in the large-scale pilot ). We included McQuarrie and Munson’s (1991) five item importance subscale for the involvement construct (alpha = .876 in large-scale pilot). Last, the interactivity scale is based upon Steuer’s (1992) three-part conceptualization of interactivity. Thus, I1 and I2 correspond to the speed of the interaction; I3 and I4 to the mapping of the interaction (i.e., how natural and intuitive the interaction is perceived to be by the user; and I5 and I6 correspond to the range of the interaction (i.e., the number of possibilities for action at a given time). Items I1 through I5 were included in the large-scale pilot, with an alpha in the pilot study of .613).
13
Two sets of items, time distortion and telepresence, were modified somewhat from the items used in the large-scale pilot, so we do not report coefficient alphas from the pilot study. Telepresence, described as “the compelling sense of being present in a mediated virtual environment” (Held and Durlach, 1992; Kim and Biocca, 1997; Steuer, 1995) is treated as a separate construct from time distortion, the perception of time passing rapidly when engaged in an activity. Three constructs in the final survey - arousal, control, and positive affect - each consist of the four item scales used by Havlena and Holbrook (1986), based upon Mehrabian and Russell’s (1974) longer original six original versions of these three scales. Different measures of these constructs were used in the pilot studies, so we do not report coefficient alphas from the pilot. Two sets of items correspond to constructs that were not included in the pilot tests. The eight item exploratory behavior scale is modified from Baumgartner and Steenkamp (1996)’s 20 item EBBT scale. Items E1 through E8 were obtained by rewording items 8, 9, 1, 4, 11, 12, 16 and 20, so they are applicable to exploratory behavior on the Web. The seven item scale for OSL is Steenkamp and Baumgartner’s (1995) short-form of the “Change Seeker Index.”
3.2. Data Collection Our final instrument consisted of 75 items, of which 66 were used in the present research, and was administered as a Web fillout form which was posted from October 10 to November 17, 1997 in conjunction with the 8th WWW User Survey fielded by the Graphic, Visualization, and Usability Center (GVU) at the Georgia Institute of Technology. Respondents who registered to participate in the 8th WWW User Survey were given a unique identifying code, and were presented with an online list of 11 different surveys, including our survey, which they could potentially fill out. As the GVU WWW User Survey employs non-probabilistic sampling and self-selection (GVU 1997), it is not representative of the general population of Web users. Comparison with population
14
projectable surveys of Web Usage (e.g. Hoffman, Kalsbeek and Novak 1996) shows the GVU User Survey sample to contain more long-term, sophisticated Web users than the general population. However, our primary objective is theory testing and development, so this difference is not an issue. Participants were solicited by announcements placed on Internet-related newsgroups, banner ads placed on specific pages on high exposure sites (e.g. Yahoo, Netscape, etc.), banner ads randomly rotated through high exposure sites (e.g. Webcrawler, etc.), announcements made to the www-surveying mailing list maintained by GVU, and announcements made in the popular media. In five weeks, over 10,000 respondents filled out at least one of the 11 surveys that comprised the 8th WWW User Survey, and 2206 respondents completed our survey. The number of responses to our final survey was less than our large scale pilot study fielded with the 7th GVU survey, because of increased difficulty in obtaining free banner advertising on major Web sites to promote the survey.
We eliminated
148 respondents who had missing data on any of the items in the survey. As respondents were automatically shown all items they did not complete, and given the opportunity to complete them, 93.3% of respondents provided complete data on all survey items, and 95.1% of respondents left three or less items missing. We eliminated an additional 21 respondents who replied with essentially the same scale value to all items on the survey. This produced a final analysis sample of 2037 respondents, with no missing data. Following Cudeck and Browne (1983), we used a cross-validation procedure to assess model fit. To minimize capitalizing on chance when applying model modification procedures to the calibration sample, the sample of 2037 respondents was randomly split in uneven fashion, as recommended by Wickens (1989). The majority of respondents were randomly assigned into a calibration sample of 1500 respondents, and the remainder into a validation sample of 537 respondents.
15
4. PRELIMINARY ASSESSMENT OF MEASURE RELIABILITY The 1500 observations in the calibration sample were used for a preliminary assessment of measure reliability and intercorrelations among summed scales. Table 4 provides coefficient alphas for summed scales for each of the 13 constructs, where the individual items for each construct are shown in Appendix A. In three cases (exploratory behavior, interactivity, and telepresence), alpha statistics could be improved by eliminating items. In addition, principal components analysis found 10 of the 13 constructs had only one component with an eigenvalue greater than one (the exceptions were interactivity, exploratory behavior, and playfulness). Based upon these results, in all subsequent analyses we modified several of the scales, as follows. First, we used a two item scale, comprised of I1 and I2, to measure interactivity1. We also reduced the number of items for the exploratory behavior scale, since items E2 and E3 (alpha = .535 for this item pair) loaded on a separate component from the remaining items. Eliminating these two items, along with E7, improved coefficient alpha; thus we used the remaining five items as our scale for subsequent analyses. Last, since eliminating two items greatly improved the reliability of telepresence, a two item scale consisting of T2 and T3 was used. While PCA identified two components with eigenvalues over one for playfulness, this appeared to be an artifact of the reverse-scaled items (P1, P3, P4) loading on a separate component; thus all seven items were retained.
1
As noted, the six interactivity items were designed according to Steuer’s (1992) three-part model of interactivity. In the PCA, I1 and I2 (the speed of the interaction) loaded on one component (alpha = .688); while the remaining items loaded on a second component (alpha = .514). As the pairs of items I3 and I4 (mapping of the interaction, alpha = .516) and I5 and I6 (range of the interaction, alpha = .377) exhibited poor reliabilities, we simplified our Interactivity construct to capture only the speed of interaction.
16
Table 4 - Coefficient Alpha for Summed Scales (1) Scale (items)
arousal (A1-A4) challenge (C1-C4) control (CO1-CO4) exploratory behavior (E1-E8) focused attention (FA1-FA4) interactivity (I1-I6) involvement (IM1-IM5) optimum stimulation level (O1-O7) playfulness (P1-P7) positive affect (PA1-PA4) skill (S1-S4) telepresence (T1-T4) time distortion (TD1-TD2)
(2) alpha using all items .650 .799 .685 .788 .830 .627 .923 .850 .828 .861 .858 .697 .703
(3) alpha using reduced item set
(4) items eliminated in (3)
.808
E3, E7, E2
.688
I1, I2, I3, I4
.830
T1, T4
Table 5 presents the correlation matrix of the summed scales for the 13 constructs (with interactivity, exploratory behavior, and telepresence defined as above), plus the three measured variables for Web usage. Inspection of this correlation matrix revealed one problem with the survey instrument: five summed scores - positive affect, arousal, focused attention, control, and importance - all correlated with each other at .300 or higher. This strength of correlation is not predicted by the conceptual model in Figure 2. However, it can be explained by response tendency, as items for all five of these scales appeared in a block at the beginning of the survey, and none of these items were reverse scaled.
17
Table 5 - Correlation Matrix of Summed Scales and Usage Variables
timeuse startuse exuse arousal challenge control explore focused attention interactiv. (speed) involv. (import) OSL playfulness positive affect skill telepresence time distortion
time use 1.000 .184 -.029 .184 .099 .201 .116 .214 .073 .410 .153 .221 .159 .331 .034 .106
start use .184 1.000 -.096 -.029 -.286 .172 -.191 -.060 -.105 .252 .141 -.062 -.075 .561 -.106 -.208
con- exinter pos. tele time exuse arous chall trol plor focus speed invol OSL play affect skill pres dist -.029 .184 .099 .201 .116 .214 .073 .410 .153 .221 .159 .331 .034 .106 -.096 -.029 -.286 .172 -.191 -.060 -.105 .252 .141 -.062 -.075 .561 -.106 -.208 1.000 .148 .254 .044 .143 .162 .072 .118 .102 .143 .134 -.116 .073 .104 .148 1.000 .370 .345 .296 .500 .136 .301 .120 .483 .504 .073 .233 .252 .254 .370 1.000 .124 .396 .387 .246 .197 .047 .529 .390 -.190 .296 .334 .044 .345 .124 1.000 .142 .394 .166 .386 .123 .425 .502 .303 .026 .077 .143 .296 .396 .142 1.000 .367 .216 .203 .171 .486 .414 -.014 .179 .377 .162 .500 .387 .394 .367 1.000 .188 .438 .065 .520 .603 .097 .282 .424 .072 .136 .246 .166 .216 .188 1.000 .146 -.003 .289 .322 .044 .041 .123 .118 .301 .197 .386 .203 .438 .146 1.000 .156 .432 .413 .363 .085 .192 .102 .120 .047 .123 .171 .065 -.003 .156 1.000 .144 .075 .198 .007 .004 .143 .483 .529 .425 .486 .520 .289 .432 .144 1.000 .598 .166 .204 .347 .134 .504 .390 .502 .414 .603 .322 .413 .075 .598 1.000 .129 .143 .305 -.116 .073 -.190 .303 -.014 .097 .044 .363 .198 .166 .129 1.000 -.085 -.058 .073 .233 .296 .026 .179 .282 .041 .085 .007 .204 .143 -.085 1.000 .463 .104 .252 .334 .077 .377 .424 .123 .192 .004 .347 .305 -.058 .463 1.000
We performed a PCA on the items for these five scales to investigate the severity of the response tendency problem. Five components had eigenvalues greater than one. The items with the highest loadings on each of the five components were: (1) IM1-IM5; (2) PA1-PA4, A3, A4; (3) FA1-FA4; (4) CO1-CO4; and (5) A1, A2 (note A3 loads .388 and A4 loads .344 on the fifth component). Thus, while the response tendency inflates the correlations among the summed scales for these five items, there is evidence for the distinctiveness of the five constructs. We account for this response tendency in our structural modeling by introducing path coefficients for the regression of each of the above 21 measured variables on a latent factor for response tendency.
5. STRUCTURAL MODELS In this section, we describe a series of structural equation models fit to our calibration sample. EQS for Windows, Version 5.7 (Bentler and Wu, 1995) was used for all model fitting. EQS was chosen
18
over other programs (e.g. LISREL), as the graphically-oriented Diagrammer facility in EQS facilitated the rapid development of, and display of results from, complex structural equation models.
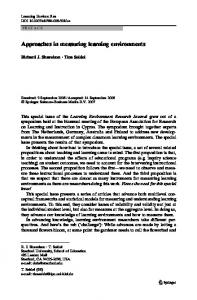
5.1. Test of Hoffman and Novak’s (1996) Conceptual Model Model specification. Figure 2 presents the measurement and latent variable model specification corresponding to Hoffman and Novak’s (1996) conceptual model of flow, which we call our theoretical structural model. Figure 2 shows path coefficients for the indicated regressions among 13 latent factors, and three measured variables (startuse, timeuse, and exuse), and path coefficients for the regressions of 54 measured variables onto the 13 latent factors (for identification, path coefficients for the first measured variable for each latent factor were constrained to one). pa1 s1
startuse
s2
s3
s4
Positive Affect
.54 .44
Skill timeuse
co1 co2 co3 co4
Control
pa2 pa3 pa4
.69 .24 p1 p2 p3 p4 p5 p6 p7
.26
.15 Playfulness
.64
.19
.13 Challenge
c1
c2
c3
.40
Arousal
a1
c4
a2
a3
.50 Time Distortion
.18
.08
i2
td2
.58
.05 Interactive Speed
td1
a4
.43
i1
exuse
.02 (t=.63)
.15
.43
(t=2.17)
ex1 ex4
Telepresence
t2
Exploratory Behavior
ex5 ex6 ex8
t3
.10 o1
Importance
im1 im2 im3 im4 im5
.33
Focused Attention
o2 o3
OSL fa1 fa2 fa3 fa4
o4 o5 o6 o7
Figure 2 - Theoretical Structural Equation Model for Flow In addition, as noted in the previous section, but not shown in Figure 2 to simplify the diagram, we used a 14th latent factor to model the response tendency associated with the 21 measured variables for positive affect, arousal, focused attention, control, and importance. Thus, these 21 measured variables
19
“double-load” on their primary latent factor, plus the latent factor for response tendency. We also estimated covariances for the 10 pairs of independent variables shown in the first column of Table 7, as well as variances for all independent variables (not shown). Assessment of overall model fit. Maximum likelihood estimation was used to fit the model in Figure 2 to the calibration sample of 1500 respondents. Convergence was achieved in 22 iterations, and no estimation problems were encountered. Overall goodness of fit (see Table 6 for a summary of model fit and characteristics statistics) for this initial theoretical model was quite good, with root mean squared error of approximation (RMSEA) equal to .048 ± .001. Browne and Cudeck (1993) suggest that RMSEA values below .05 indicate a close fit of the model in relation to degrees of freedom, and values below .08 indicate a reasonable fit. Our RMSEA is also below .06, the median for 73 integrated measurement/ latent variable models reported in the marketing literature (Baumgartner and Homberg, 1995). We also used Bentler’s (1990) comparative fit index (CFI) to assess overall model fit. CFI was .870 for our initial theoretical model. This is below the minimum value of .9 suggested (Bentler 1990) as indicative of good model fit, and below the median CFI of .95 in 14 marketing studies as summarized by Baumgartner and Homberg (1995). However, Baumgartner and Homberg (1995) note that there is a sizeable negative relationship of model complexity to CFI, whereas RMSEA is unaffected by model complexity. It is important to note that our model is considerably more complex than models that have typically appeared in the marketing literature. Comparing our theoretical model (see Table 6) to median values in 73 studies summarized by Baumgartner and Homberg (1995), we find our initial theoretical model has a much greater number of measured variables (57 vs.11), number of parameters estimated (163 vs. 32), and degrees of freedom (1490 vs 49). Our calibration sample size, at 1500, is much larger than the median of 180. In fact, the largest sample size reported by Baumgartner and Homberg out of 184 marketing studies that used any type of structural equation model was only 305. Thus, due to the negative relationship with model complexity, comparisons of CFI for the complex models fit in the present study with CFI values reported for the 20
considerably simpler models in the published marketing literature must be viewed with caution. While we report CFI as an overall measure of fit, RMSEA is better justified as a basis of comparison.
Table 6 - Summary of model fit and model characteristics statistics Calibration sample: Theoretical Revised Model Model CFI RMSEA (90% confidence interval) Chi-Square d.f. sample size number of measured variables number of latent factors* number of constraints number of free parameters estimated ratio of sample size to free parameters
.870 .048 (.047, .049) 6620.51 1490 1500 57 14 0 163 9.20
.903 .043 (.041, .044) 4604.04 1229 1500 52 13 1 149 10.07
Validation Sample: Revised Model Revised Model (free estimates) (fixed estimates) .894 .857 .046 .049 (.045, .047) (TBA) 2558.6 3176.42 1228 1378 537 537 52 52 13 13 0 n/a 150 0 3.58 n/a
*including a latent factor for response tendency
Assessment of the latent variable model. The standardized path coefficients in Figure 2, with the exception of the path from interactivity/speed to telepresence (t = .63) are all significant at p 2.58 (with 1% chance of false alarm). Although the observed rate of 25% rejections seem to be much higher than the corresponding nominal rate of 5%, it is noted that the estimates obtained within each sample were correlated. Hence, the 150 tests were not independent and the 5% nominal rate, which assumes 150 independent tests, could only serve as a rough benchmark. It is thus more useful to treat these test results as indications of potential model refinement or modification in the future modeling. Of particular interest are the test of differences in path coefficients among latent factors, and the three measured variables startuse, timeuse, and exuse. Table 11 shows the estimated standardized coefficients for the path coefficients which differed with | t | > 1.96. With exceptions for the paths from interactivity (speed) to control, and arousal to play, the differences in terms of the standardized values are on the whole quite unremarkable, suggesting that the revised model in Figure 3 cross-validates well. The paths from interactivity to control and arousal to play may need to be confirmed by future studies.
nv2 sv2 )/( nc + nv ). After simplification, σ d2 is thus estimated by nc sc2 / nv + nv sv2 / nc , the square root of which was used in the denominator of the t-ratio.
28
Table 10 - Pairwise Tests of Parameters in Calibration and Validation Samples
total path coefficients among latent factors, startuse, timeuse, and exuse path coefficients for regression of measured variables onto latent factors (non-response tendency) path coefficients for regression of measured variables onto latent factor for response tendency covariances of independent variables
22
number of parameters where: 1.96 = 1.96 27%
38
27
6
5
29%
20
11
3
6
45%
5
5
0
0
0%
variances of independent variables
65
53
6
6
19%
all parameters
150
112
18
20
25%
Table 11 - Significant Differences in Structural Equation Paths Between Calibration and Validation Samples
Path coefficients between latent factors: timeuse à skill skill à control interactivity (speed) à control challenge à focused attention arousal à playfulness focused attention à playfulness
standardized coefficient (calibration sample) .19 .38 .31 .51 .47 .51
29
standardized coefficient (validation sample) .27 .32 .06 (ns) .65 .18 .75
t-statistic -2.28 2.15 3.72 -2.27 3.67 -2.68
7. DISCUSSION We have demonstrated empirically that flow is a complex, multidimensional construct that can be defined as a set of directed relationships among twelve unidimensional constructs and three Web usage variables. Our research has relevance to both academic marketing scientists and industry practitioners interested in the commercialization of the World Wide Web because the flow model depicted in Figure 3 embodies the components of what makes for a compelling online experience. Theoretically, our empirical results support earlier research hypothesizing the role of skill in Web use (indirectly through control) and the challenges presented by that use (indirectly through arousal) as key antecedents of the flow experience. These results are also consistent with the eight channel flow model (Figure 1) that considers control and arousal as correlates of skill and challenge, and with research by Ghani and Deshpande (1994) which found that skill led to control, which in turn led to flow. Our results also represent a more expansive role of involvement in flow than originally hypothesized in Figure 2. Enduring involvement (measured simply as importance), directly predicts skill, challenge, and focused attention, three antecedents of flow. However, our revised model does not support the original conceptualization of interactivity and telepresence as antecedents of play. While both path coefficients are significant, the standardized coefficients are relatively small. It is important to note that the interactivity construct we use is narrowly defined as speed of interaction. Our revised model omits telepresence and shows that while the speed of the interaction influences the consumer’s perceptions of control, challenge, and focused attention during the interaction, it does not directly lead to playfulness. However, focused attention, hypothesized as a precursor to telepresence, now serves as a primary antecedent of playfulness. Both our theoretical and revised models suggest that playfulness is an important indicator of flow. It is predicted by the antecedents of skill (through control), challenge (through arousal), and focused attention, and leads to the consequences of positive affect, more exploratory behavior on the Web, and
30
greater expected Web use in the future. Note, however, that we originally hypothesized time distortion as an outcome of the flow experience. Instead, the revised model shows that it is predicted from focused attention, and in turn predicts exploratory behavior. This suggests that time distortion actually captures an important additional aspect of the flow experience. While Hoffman and Novak (1996) hypothesized that consumers with a higher optimum stimulation level (OSL) would be more likely to experience flow, we found no relationship of OSL with playfulness. However, we found that OSL led to greater exploratory behavior on the Web, verifying a relationship noted in general by many other researchers (e.g. Raju 1980). The framework we tested and refined in this paper can further managerial understanding of the nature of consumer interaction in computer-mediated environments. Demonstrating that flow can be reliably measured and possesses significant predictive ability is an important first step toward subsequent predictive modeling with critical marketing variables. For example, evidence is emerging that online environments offering full information improve the decision making process for consumers and offer greater benefits to online retailers than environments with less information (Haubl and Trifts 1998; Lynch and Ariely 1998). Though providing full information to consumers may increase the possibility of price competition, providing a compelling online experience may significantly mitigate price sensitivity in such environments (see, for example, Shankar, Rangaswamy, and Pusateri 1998). Additionally, Novak and Hoffman (1997b) have presented preliminary empirical evidence that skill and challenge, two antecedents of flow, predict online consumer search and purchase behavior in a wide range of product categories. Investigating the relationship between the consequences of flow and online consumer outcome variables may also be productive. For example, the model results presented here suggest that the “interactivity metrics” of duration time and browsing depth recently proposed to measured marketing effectiveness on advertising sponsored Web sites (Novak and Hoffman 1997a) will be highly positively correlated with flow. Ultimately, knowledge of the relationship among the flow model constructs and marketing outcome variables can lead to more effective interactions with online customers.
31
Toward these aims, future research should build upon the structural model of flow shown in Figure 3. Improved measurement of telepresence and interactivity is necessary. Also useful would be direct measurement of the flow construct. While we approached the measurement of flow as a complex multidimensional construct, an alternative approach is the narrative methodology used by Privette and Bundrick (1987) and Lutz and Guiry (1994), in which respondents are shown a narrative, overall description of the flow experience, and asked to rate the extent to which they felt this characterized their interactions with the Web. Research effort may also be fruitfully directed at the antecedents of flow. We restricted our investigation of involvement to enduring involvement, as measured by the importance of the Web to the respondent. The role of situational involvement is unexplored in this research, as are distinctions between goal-directed and experiential navigation behavior, and the role of consumer demographic variables. Finally, the present research may be effectively extended beyond a retrospective general evaluation of flow on the Web to the modeling of the flow construct in specific online situations. For example, apart from speed of interaction, the present research has not considered the specific elements of commercial Web site design that facilitate the consumer experience of flow, nor how the flow experience is likely to vary across the wide range of commercial sites found on the Web today. The importance to the global economy of electronic commerce conducted over the Internet is no longer in doubt (Margherio, Henry, Cooke, and Montes 1998). Determining how to create commercial online environments that engage consumers and satisfy important marketing objectives such as extended visit durations, repeat visits, and online purchase are critical marketing tasks. We believe this research represents an important first step on this path.
32
Appendix A - Pilot Tests A series of pilot tests, consisting of four small-scale pretests, and a full-scale pilot field test, were conducted over a six month period from December 1996 to May 1997. The purpose of the pilot tests was to provide input into the development of the series of items used to measure the constructs discussed in the previous section. Construct reliability was assessed with coefficient alpha. For some scales, we used or modified items from scales in the published literature; for other scales, new items we developed. The following summarizes the pilot tests that were conducted prior to the data collected for the present paper in October-November 1997 in the 8th GVU WWW User Survey. Pretest 1) n=49, in-person 22 item written questionnaire administered in person to MBA students at a private business school in the southeastern US, December 1996. Pretest 2) n=108, 59 item Web fillout form4 administered to Project 2000 Pretest Panel, January 1997. Pretest 3) n=86, in-person 59 item written questionnaire administered in person to MBA students at a private business school in the southeastern US, February 1997. Pretest 4) n=146, 78 item Web fillout form5 Project 2000 Pretest Panel, March 1997. 7th GVU Survey)
The final pilot test survey consisted of 77 items, and was administered as a
Web fillout form6 which was posted from April 10 to May 10, 1997 in conjunction with the 7th WWW User Survey fielded by the Graphic, Visualization, and Usability Center (GVU) at the Georgia Institute of Technology7. 19,970 respondents filled out at least one of the 13 surveys that comprised the 7th WWW User Survey, and 4,232 useable responses were obtained for our pilot test survey. The specific items and coefficient alphas used in the 7th GVU Survey are listed in Appendix B of Novak, Hoffman & Yung (1998).
4
http://www2000.ogsm.vanderbilt.edu/cgi-bin/SurveyArchive/pretest.jan97.pl http://www2000.ogsm.vanderbilt.edu/cgi-bin/SurveyArchive/pretest.march97.pl 6 http://www2000.ogsm.vanderbilt.edu/gvusurvey/project2000.gvu.html 7 http://www.gvu.gatech.edu/user_surveys/survey-1997-04/ 5
33
Appendix B - Variables Used in GVU 8 Survey
Construct: web usage
arousal
challenge
control
exploratory behavior
focused attention
interactivity
involvement (importance)
Variable Name: startuse timeuse exuse A1 A2 A3 A4 C1 C2 C3 C4 CO1 CO2 CO3 CO4 E1 E2 E3 E4 E5 E6 E7 E8 FA1 FA2 FA3 FA4 I1 I2 I3 I4 I5 I6 IM1 IM2 IM3 IM4 IM5
Variable Description: When did you start using the Web? (5 categories) How much time would you estimate that you personally use the Web? (6 categories) In the coming year, how much do you expect to use the Web, compared to your current level of usage? (5 categories) stimulated / relaxed excited /calm frenzied / sluggish aroused / unaroused Using the Web challenges me. Using the Web challenges me to perform to the best of my ability. Using the Web provides a good test of my skills. I find that using the Web stretches my capabilities to my limits. controlling / controlled influential / influenced dominant / submissive autonomous / guided I enjoy visiting unfamiliar Web sites just for the sake of variety. I rarely visit Web sites I know nothing about. (R) Even though there are thousands of different kinds of Web sites, I tend to visit the same types of Web sites. (R) When I hear about a new Web site, I'm eager to check it out. Surfing the Web to see what's new is a waste of time. (R) I like to browse the Web and find out about the latest sites. I like to browse shopping sites even if I don't plan to buy anything. I often click on a link just out of curiosity. When I use the Web, I am: deeply engrossed / not deeply engrossed When I use the Web, I am: absorbed intently / not absorbed intently When I use the Web, my attention is: focused / not focused When I use the Web, I: concentrate fully / do not concentrate fully When I use the Web there is very little waiting time between my actions and the computer's response. Interacting with the Web is slow and tedious. (R) Navigating with today's Web browsers is not very intuitive. (R) Today's Web browsers allow me to navigate the Web in a natural and predicatable manner. The range of what can be manipulated on the Web is narrow. At any time, there are many different actions available to me as I navigate the Web. important / unimportant irrelevant / relevant (R) means a lot to me / means nothing to me mattters to me / doesn't matter of no concern / of concern to me (R)
34
optimum stimulation level
playfulness
positive affect
skill
telepresence
O1 O2 O3 O4 O5 O6 O7 P1 P2 P3 P4 P5 P6 P7 PA1 PA2 PA3 PA4 S1 S2 S3 S4 T1 T2 T3 T4
time distortion
TD1 TD2
I like to continue doing the same old things rather than trying new and different things. (R) I like to experience novelty and change in my daily routine. I like a job that offers change, variety, and travel, even if it involves some danger. I am continually seeking new ideas and experiences. I like continually changing activities. When things get boring, I like to find some new and unfamiliar experience. I prefer a routine way of life to an unpredictable one full of change. (R) I feel unimaginative when I use the Web. (R) I feel flexible when I use the Web I feel unoriginal when I use the Web. (R) I feel uninventive when I use the Web. (R) I feel creative when I use the Web. I feel playful when I use the Web. I feel spontaneous when I use the Web. happy / unhappy pleased / annoyed satisfied / unsatisfied contented /melancholic I am extremely skilled at using the Web. I consider myself knowledgeable about good search techniques on the Web. I know somewhat less about using the Web than most users. (R) I know how to find what I am looking for on the Web. I feel I am more in the "computer world" than the "real world" around me when I use the Web. I forget about my immediate surroundings when I use the Web. Using the Web often makes me forget where I am. When I use the Web, I pay more attention to my immediate physical surroundings than to my computer Time seems to go by very quickly when I use the Web. When I use the Web, I tend to lose track of time.
35
REFERENCES Baumgartner Hans and Christian Homberg (1995), “Applications of Structural Equation Modeling in Marketing and Consumer Research: A Review,” International Journal of Research in Marketing, 13, 139-161. Baumgartner, Hans and J.-B. E.M. Steenkamp (1996), “Exploratory Consumer Buying Behavior: Conceptualization and Measurement,” International Journal of Research in Marketing, 13, 121-137. Bentler, Peter M. (1990), “Comparative Fit Indexes in Stuctural Models,” Psychological Bulletin, 107, 238-246. Bentler, Peter M. (1995), EQS Structural Equations Program Manual, Encino, CA: Multivariate Software, Inc. Bentler, Peter M. and T. Dijkstra (1985), “Efficient Estimation Via Linearization in Structural Models,” In P.R. Krishniaih (Ed.), Multivariate Analysis, VI, (pp. 9-42), Amsterdam: North-Holland. Bentler, Peter M. and Eric J.C. Wu (1995), EQS For Windows User’s Guide, Encino, CA: Multivariate Software, Inc. Browne, M.W. and R. Cudeck (1993), “Alternative Ways of Assessing Model Fit,” In: K.A. Bollen and J.S. Long (eds.), Testing Structural Equation Models, 136-162, Newbury Park, CA: Sage. Clarke, Sharon G. and John T. Haworth (1994), “’Flow’ Experience in the Daily Lives of Sixth-Form Collect Students,” British Journal of Psychology, 85, 511-523. Csikszentmihalyi, Mihaly (1977), Beyond Boredom and Anxiety, second printing. San Francisco: Jossey-Bass. Csikszentmihalyi, Mihaly (1990), Flow: The Psychology of Optimal Experience,NY: Harper and Row. Csikszentmihalyi, Mihaly and Isabella Csikszentmihalyi (1988), “Introduction to Part IV” in Optimal Experience: Psychological Studies of Flow in Consciousness, Mihaly Csikszentmihalyi and Isabella Selega Csikszentmihalyi, eds., Cambridge, Cambridge University Press. Csikszentmihalyi, Mihaly and Judith LeFevre (1989), “Optimal Experience in Work and Leisure,” Journal of Personality and Social Psychology,56 (5), 815-822. Cudeck, R., & Browne, M. W. (1983). Cross-validation of covariance structures. Multivariate Behavioral Research, 18, 147-167. Ellis, Gary D., Judith E. Voelkl, and Catherine Morris (1994), “Measurement and Analysis Issues with Explanation of Variance in Daily Experience Using the Flow Model,” Journal of Leisure Research,26(4), 337-356. Ghani, Jawaid A. and Satish P. Deshpande (1994), “Task Characteristics and the Experience of Optimal Flow in Human-Computer Interaction,” The Journal of Psychology, 128(4), 381-391.
36
Ghani, Jawaid A., Roberta Supnick, & Pamela Rooney (1991), “The Experience of Flow in ComputerMediated and in Face-to-Face Groups,” Proceedings of the Twelfth International Conference on Information Systems, DeGross, J.I, I. Benbasat, G. DeSanctis, and C. M. Beath, Eds., New York, New York, December 16-18. GVU (1997), “GVU’s 7th WWW User Survey,” [http://www.gvu.gatech.edu/user_surveys/survey-1997-04/]. Haeubl, Gerald and Valerie Trifts (1998), "Consumer Decision Making in Interactive Online Shopping Environments: The Role of Information Agents and Tools for Organizing Information," paper presented at the INFORMS College on Marketing Mini-Conference "Marketing Science and the Internet," MIT Sloan School, March 6-8. Havlena, William J. and Morris B. Holbrook (1986), “The Varieties of Consumption Experience: Comparing Two Typologies of Emotion in Consumer Behavior,” Journal of Consumer Research, 13 (December), 394-404. Held, R.M. and N.I. Durlach (1992), “Telepresence,” Presence, 1(1), 109-112. Hoffman, Donna L. and Thomas P. Novak (1996), “Marketing in Hypermedia Computer-Mediated Environments: Conceptual Foundations,” Journal of Marketing, 60 (July), 50-68. Hoffman, D.L., W.D. Kalsbeek and T.P. Novak (1996), “Internet and Web Use in the United States: Baselines for Commercial Development,” Special Section on “Internet in the Home,” Communications of the ACM, 39 (December), 36-46. Hoffman, Donna.L., Thomas.P. Novak, and Patrali Chatterjee (1995), “"Commercial Scenarios for the Web: Opportunities and Challenges," Journal of Computer-Mediated Communication, Special Issue on Electronic Commerce, 1(3). Kim, Taoyong and Frank Biocca (1997), “Telepresence via Television: Two Dimensions of Telepresence May Have Different Connections to Memory and Persuasion,” Journal of Computer-Mediated Communication, 3(2), September. [http://www.asusc.org/jcmc/vol3/issue2/kim.html] LeFevre. Judith (1988), “Flow and the Quality of Experience During Work and Leisure.” In M. Csikszentmihalyi and I. Csikszentmihalyi (Eds.), Optimal Experience: Psychological Studies of Flow in Consciousness, New York: Cambridge University Press. Lutz, Richard J. and Michael Guiry (1994), “Intense Consumption Experiences: Peaks, Performances, and Flows,” Winter Marketing Educators’ Conference, St. Petersburg, FL, February. Lynch, John and Dan Ariely (1998), "Interactive Home Shopping: Effects of Cost of Acquiring Price and Quality Information on Consumer Price Sensitivity, Satisfaction with Merchandise Selected, and Retention," paper presented at the INFORMS College on Marketing Mini-Conference "Marketing Science and the Internet," MIT Sloan School, March 6-8. Mannell, Roger C., Jiri Zuzanek, and Reed Larson (1988), “Leisure States and ‘Flow’ Experiences: Testing Perceived Freedom and Intrinsic Motivation Hypotheses,” Journal of Leisure Research, 20 (4), 289- 304.
37
Margherio, Lynn, Dave Henry, Sandra Cooke, and Sabrina Montes (1998), “The Emerging Digital Economy,” Report of the Initiative for the Framework for Global Electronic Commerce. National Technical Information Service (NTIS), United States Department of Commerce, Springfield, Virginia. [http://www.ecommerce.gov/viewhtml.htm] Marr, Arthur J. (1998), “The Flow Experience: Or What Occurs When Bad Science Happens to Good Observations,” working paper (personal communication). Massimini, Fausto and Massimo Carli (1988), “The Systematic Assessment of Flow in Daily Experience.” In M. Csikszentmihalyi and I. Csikszentmihalyi (Eds.), Optimal Experience: Psychological Studies of Flow in Consciousness, (pp. 288-306), New York: Cambridge University Press. Mehrabian, Albert and James Russell (1974), An Approach to Environmental Psychology, Cambridge, MA: The MIT Press. McQuarrie, Edward F. and J. Michael Munson (1991), “A Revised Product Involvement Inventory: Improved Usability and Validity,” Unpublished Working Paper, Santa Clara, CA: Santa Clara, University; Exhibit, p. 19. Morr, Tom (1997), “You Can Build It, But Will They Come Back?,” On The Highway, SEMA News, June. Specialty Equipment Market Association. Nakamura, J. (1988), “Optimal Experience and the Uses of Talent,” In. M. Csikszentmihalyi & I. Csikszentmihalyi (Eds.), Optimal Experience: Psychological Studies of Flow in Consciousness (pp 319-326), New York: Cambridge University Press. Novak, Thomas P. and Donna L. Hoffman (1997a), “New Metrics for New Media: Toward the Development of Web Measurement Standards,” World Wide Web Journal, Winter, 2(1), 213-246. Novak, Thomas P and Donna L. Hoffman (1997b), “Measuring the Flow Experience Among Web Users,” working paper, Vanderbilt University. http://www2000.ogsm.vanderbilt.edu/novak/flow.july.1997/flow.htm] Novak, Thomas P., Donna L. Hoffman and Yiu-FaiYung (1998), “Modeling the Structure of the Flow Experience Among Web Users,” Paper prepared for Marketing Science and the Internet MiniConference, MIT, March. Privette, Gayle and Charles M. Bundrick (1987), “Measurement of Experience: Construct and Content Validity of the Experience Questionnaire,” Perceptual and Motor Skills, 65, 315-332. Raju, P.S. (1980), “Optimum Stimulation Level: Its Relationship to Personality, Demographics, and Exploratory Behavior,” Journal of Consumer Research, 7 (December), 272-282. Schwartz, Evan I. (1996), “Advertising Webonomics 101,” Wired, 4.02, Electrosphere section, February. Shankar, Venkatesh, Arvind Rangaswamy and Michael Pusateri (1998), "The Impact of Internet Marketing on Price Sensitivity and Price Competition," paper presented at the INFORMS College on Marketing Mini-Conference "Marketing Science and the Internet," MIT Sloan School, March 6-8. Steenkamp, J.-B. E.M. and Hans Baumgartner (1995), “Development and Cross-Cultural Validation of a 38
Short Form of CSI as a Measure of Optimum Stimulation Level,” International Journal of Research in Marketing, 12, 97-104. Steuer, Jonathan (1992), “Defining Virtual Reality: Communiation, 42(Autumn), 73-93.
Dimensions Determining Telepresence,” Journal of
Tchong, Michael (1998), “ICONOCAST,” Imagine Media Inc. Http://www.iconocast.com/ Trevino, Linda Klebe and Jane Webster (1992), “Flow in Computer-Mediated Communication,” Communication Research, 19(5), 539-573. Webster, Jane and Hayes Ho (1997), “Audience Engagement in Multimedia Presentations,” The DATA BASE for Advances in Information Systems, 28(2), 63-77. Webster, Jane and Joseph J. Martocchio (1995), “The Differential Effects of Software Training Previews on Training Outcomes,” Journal of Management, 21(4), 757-787. Webster, Jane and Joseph J. Martocchio (1992), “Microcomputer Playfulness: Development of a Measure With Workplace Implications,” MIS Quarterly, 16 (June), 201-226. Webster, J., L.K. Trevino, L. Ryan (1993), “The Dimensionality and Correlates of Flow in Human Computer Interactions,” Computers in Human Behavior, 9(4), Winter, 411-426. Wells, A. (1988), “Self-Esteem and Optimal Experience,” In. M. Csikszentmihalyi & I. Csikszentmihalyi (Eds.), Optimal Experience: Psychological Studies of Flow in Consciousness (pp 319-326), New York: Cambridge University Press. Wickens, T. D. (1989). Multiway Contingency Tables Analysis for the Social Sciences. Hillsdale, NJ: LEA, Associates.
39