METHODS published: 07 June 2016 doi: 10.3389/fpsyg.2016.00823
Measuring the Performance of Attention Networks with the Dalhousie Computerized Attention Battery (DalCAB): Methodology and Reliability in Healthy Adults Stephanie A. H. Jones 1*, Beverly C. Butler 1, 2 , Franziska Kintzel 1 , Anne Johnson 1 , Raymond M. Klein 3 and Gail A. Eskes 1, 4* 1
Cognitive Health and Recovery Research Laboratory, Department of Psychiatry, Dalhousie University, Halifax, NS, Canada, Research Services, Nova Scotia Health Authority, Halifax, NS, Canada, 3 Cognitive Science Laboratory, Department of Psychology and Neuroscience, Dalhousie University, Halifax, NS, Canada, 4 Affiliated Scientist, Medical Staff, Nova Scotia Health Authority, Halifax, NS, Canada 2
Edited by: Andriy Myachykov, Northumbria University, UK Reviewed by: Juan Lupiáñez, University of Granada, Spain Nikolay Novitskiy, National Research University Higher School of Economics, Russia *Correspondence: Stephanie A. H. Jones
[email protected]; Gail A. Eskes
[email protected] Specialty section: This article was submitted to Cognition, a section of the journal Frontiers in Psychology Received: 25 January 2016 Accepted: 17 May 2016 Published: 07 June 2016 Citation: Jones SAH, Butler BC, Kintzel F, Johnson A, Klein RM and Eskes GA (2016) Measuring the Performance of Attention Networks with the Dalhousie Computerized Attention Battery (DalCAB): Methodology and Reliability in Healthy Adults. Front. Psychol. 7:823. doi: 10.3389/fpsyg.2016.00823
Frontiers in Psychology | www.frontiersin.org
Attention is an important, multifaceted cognitive domain that has been linked to three distinct, yet interacting, networks: alerting, orienting, and executive control. The measurement of attention and deficits of attention within these networks is critical to the assessment of many neurological and psychiatric conditions in both research and clinical settings. The Dalhousie Computerized Attention Battery (DalCAB) was created to assess attentional functions related to the three attention networks using a range of tasks including: simple reaction time, go/no-go, choice reaction time, dual task, flanker, item and location working memory, and visual search. The current study provides preliminary normative data, test-retest reliability (intraclass correlations) and practice effects in DalCAB performance 24-h after baseline for healthy young adults (n = 96, 18–31 years). Performance on the DalCAB tasks demonstrated Good to Very Good test-retest reliability for mean reaction time, while accuracy and difference measures (e.g., switch costs, interference effects, and working memory load effects) were most reliable for tasks that require more extensive cognitive processing (e.g., choice reaction time, flanker, dual task, and conjunction search). Practice effects were common and pronounced at the 24-h interval. In addition, performance related to specific within-task parameters of the DalCAB sub-tests provides preliminary support for future formal assessment of the convergent validity of our interpretation of the DalCAB as a potential clinical and research assessment tool for measuring aspects of attention related to the alerting, orienting, and executive control networks. Keywords: computerized assessment, attention, orienting, alerting, executive function
INTRODUCTION Attention is a multifaceted cognitive domain that is required for efficient perception, learning, memory, and reasoning. Different aspects of attention have been conceptualized in a number of models, such as Theory of Visual Attention (TVA, a computational model of selective attention, Bundensen, 1990), Working Memory (Baddeley and Hitch, 1974, updated in Baddeley, 2012),
1
June 2016 | Volume 7 | Article 823
Jones et al.
DalCAB: Methodology and Reliability
healthy normative sample (as well as patient samples), it can be difficult to isolate specific domains of attention as conceptualized in Posner’s model per se (e.g., Chan et al., 2008). Therefore, a supplementary or alternative procedure to standardized neuropsychological testing is necessary to provide reliable and sensitive assessment of attentional function. Computer-based cognitive testing procedures have been developed as one option. The Attention Network Test (ANT; Fan et al., 2002) is one such computerized measure of attention designed to quantify the efficiency of the vigilance, orienting and executive control networks through the combination of a cued reaction time task (Posner, 1980) and a flanker task. Participants are instructed to respond to the direction of an arrow stimulus flanked by congruent, incongruent, or neutral stimuli, following the presentation of one of four cue conditions. Difference values between the various cue and flanker conditions can be used as a quantitative measure of the efficiency of the vigilance, orienting, and executive control attention networks (cf Fan et al., 2002 for a full review). Subsequent versions of the ANT also allow an assessment of the interactions among the attention networks (ANT-Interactions, Callejas et al., 2005; ANTRevised, Fan et al., 2009). The ANT and ANT-I have been used in a variety of populations, including children, healthy adults of varying ages, and a variety of clinical populations and allow for comparisons across attentional networks due to their integrated nature and brevity (Fernandez-Duque and Black, 2006; Adolfsdottir et al., 2008; AhnAllen et al., 2008; Ishigami and Klein, 2010; Ishigami et al., 2016; see review in MacLeod et al., 2010). While use of the ANTs has proved valuable for exploration of attention mechanisms in normal and clinical populations, there are limitations to these tests. In order to limit test time, the assessment of alerting, orienting, and executive control is dependent upon a single difference measure producing a network score, with alerting and orienting network RT scores showing lower than ideal reliability across studies (ranging from 0.20 to 0.61) and the executive network RT score showing better reliability (ranging from 0.65 to 0.81; Fan et al., 2002; MacLeod et al., 2010). In addition, investigations of the validity of the ANT are limited, but Ishigami et al. (2016) found that while the executive network score was a significant predictor of conflict resolution, and verbal memory retrieval, no associations were found between the alerting and orienting network scores and other standardized tests of attention. Likewise, comparisons between the ANT and an assessment based on TVA also yielded no significant correlations (Habekost et al., 2014). Whether this lack of correlation attests to the unique measurement properties of the ANT, or its lack of validity is unknown at this point. Thus, to extend this tri-partite neurocognitive approach and to provide multiple yet integrated measures that can be compared across networks, we developed the Dalhousie Computerized Attention Battery (DalCAB; Butler et al., 2010; Eskes et al., 2013; Rubinfeld et al., 2014; Jones et al., 2015). The DalCAB is a battery of eight computerized reaction time tests, each test previously used individually in cognitive neuroscience research to measure multiple attentional functions within the vigilance, orienting and executive control attention networks. These tasks reflect concepts of attentional functions frequently studied in
Cowan’s information processing model (Cowan, 1988, 1998) and the attentional trace model of auditory selective attention (Naatanen, 1982). These, and other aspects of attention were integrated into a neurocognitive framework of an attention system that involves separate but interacting attentional brain networks underlying the attentional functions of alerting, orienting (selection), and executive control (e.g., Posner and Petersen, 1990; Fan et al., 2002; Petersen and Posner, 2012). Alerting or vigilance refers to the ability to develop and sustain a state of mental readiness, which consequently produces more rapid selection, detection, and responses to relevant stimuli in the environment (Posner and Petersen, 1990). The alerting system has been measured with continuous performance and vigilance tasks in which the participant is asked to continuously respond to sequentially presented stimuli with or without warning signals prior to the target (phasic alertness vs. tonic alertness); these tasks are thought to activate right hemisphere frontal and dorsal parietal regions related to the neuromodulator norepinephrine (c.f. Sturm and Willmes, 2001; Petersen and Posner, 2012 for a full review). The orienting of attention involves the selection of a stimulus or spatial location in the environment in order to process that information more fully. Orienting attention requires that attention be disengaged from its current focus, moved, and then re-engaged on the selected location/stimulus. While Posner’s original orienting system was associated with cholinergic systems involving the frontal lobe, parietal lobe, superior colliculus, and thalamus (Posner et al., 1982; Posner and Petersen, 1990), recent evidence argues for two separate but interacting orienting networks: (1) a bilateral dorsal system including the frontal eye fields and intraparietal sulci related to rapid strategic control over attention and; (2) a strongly right-lateralized ventral system including the temporoparietal junction and ventral frontal cortex related to breaking the focus of attention and allow switching of attention to a new target (Corbetta and Shulman, 2002; Petersen and Posner, 2012). Spatially-cued target detection tasks and visual search tasks are typically used to assess attentional orienting. Finally, in terms of executive control function, evidence indicates the presence of at least two relatively independent executive networks: (1) a fronto-parietal network, distinct from the orienting network, that is thought to relate to task initiation, switching, and trialby-trial adjustments, and; (2) a midline cingulo-opercular and anterior insular network related to maintenance across trials and maintenance of task performance as a whole, i.e., set maintenance, conflict monitoring, and error feedback (Petersen and Posner, 2012, see Figure 2B; Dosenbach et al., 2007, see Figure 4). Given the above framework and the overarching effect that attentional impairment can have on the successful completion of day to day activities and overall quality of life (e.g., Bronnick et al., 2006; Barker-Collo et al., 2010; Cumming et al., 2014; Middleton et al., 2014; Torgalsbøen et al., 2015), valid and reliable measurement of attention is important for addressing attention impairment in both research and clinical care of psychiatric and neurologic patients. While most standardized “paper-andpencil” measures used in the neuropsychological assessment of attention allow comparison of an individual’s performance to a
Frontiers in Psychology | www.frontiersin.org
2
June 2016 | Volume 7 | Article 823
Jones et al.
DalCAB: Methodology and Reliability
disorder, Parkinson’s disease, and other neurological disorders (e.g., Claros-Salinas et al., 2010; Dimoska-Di Marco et al., 2011; Fleck et al., 2011). While sustained attention or vigilance decrements have frequently been studied in sleep disordered breathing (Kim et al., 2007), they have also been shown in Parkinson’s disease (Hart et al., 1998).
normal populations as well as in those affected by psychiatric or neurological disease/injury but, to date, have never been combined and integrated using standardized stimuli1 in a single, computerized battery. The DalCAB includes the following tasks: simple and choice reaction time tasks to measure vigilance, a visual search task to measure orienting, and go/no-go, dual task, flanker, item working memory, and location working memory2 tasks to target executive control functions. The DalCAB emphasizes reaction time and accuracy measures that have been consistently related to attentional functions and can be sensitively and robustly measured (e.g., Sternberg, 1966; Wicklegren, 1977; see below). A description of all DalCAB tasks, the effects of interest within each task and literature relevant to each task are presented in Table 1. We have omitted the description of the location working memory task in the section below 2 .
2-Choice Reaction Time (CRT, Vigilance) Often used to measure decision time and response selection, the CRT task requires different responses for each of two different stimuli presented in a continuous stream (e.g., left button for red stimuli, right button for black stimuli). Errors, reaction time decrements over time and switch costs, calculated as the difference in reaction time between trials that require a switch in response category (switch trials) vs. non-switch trials, are often used to determine deficits in decision and response selection time. CRT responses are slowed in dementia, stroke, multiple sclerosis, and other neurological disorders (e.g., Bailon et al., 2010; Stoquart-Elsankari et al., 2010).
Simple Reaction Time (SRT, Vigilance) SRT is used to measure response readiness and motor reaction time (RT) to the onset of all stimuli presented. Previous research has indicated that the SRT task involves attention-demanding pre-trial vigilance (for stimulus onset and/or response initiation), and performance is affected by transient warning signals and tonic arousal changes (Petersen and Posner, 2012; Steinborn and Langner, 2012). In addition, if the interval between stimuli is varied, faster RTs are observed with longer response-stimulus intervals (RSIs), a phenomenon called the temporal preparation effect or fore-period effect (Vallesi et al., 2013). SRT is slowed in normal aging and in patients with frontal lobe alertness deficits (Godefroy et al., 2002, 2010). When the RSI is variable, older participants have shown a reversal in the fore-period effect related to decreased right prefrontal activation (Vallesi et al., 2009). SRT is also differentially slowed by dividing attention and by neurological disorders such as Parkinson’s disease that affect frontal systems function (c.f. Henderson and Dittrich, 1998 for a full review).
Dual Task (Executive Control) Often used to measure attentional control, attentional load effects, and interference, dual-task paradigms require the participant to perform two tasks simultaneously. By comparing the dual task performance to single task performance the degree of dysfunction related to attentional load or interference by the secondary task (i.e., dual task cost) can be measured (Baddeley and Della Sala, 1996). In dual task studies, addition of a concurrent secondary task greatly reduces primary task performance in many neurological disorders, including Alzheimer’s disease, traumatic brain injury, and Parkinson’s disease (Dalrymple-Alford et al., 1994; Della Sala et al., 1995, 2010).
Flanker (Executive Control) The flanker task is used as a measure of selective attention, filtering, and/or conflict resolution and performance is considered to reflect the executive attention network. In this task a central target stimulus is presented with flanking stimuli (flankers) on two sides that are either the same as (congruent) or different than (incongruent) the central target stimulus. The participant must make a decision and response regarding a feature of the central stimulus (e.g., red or black) while ignoring/filtering the flanking stimuli. In healthy adults, reaction times are slowed and accuracy is lower on trials in which the flankers are incongruent with the target compared to when the flankers are congruent with the target (i.e., the reaction time interference effect), although the effect diminishes with practice (Ishigami and Klein, 2010, 2011). The RT interference effect has also been noted to increase with increasing age (Salthouse, 2010), although accuracy effects in older adults have been shown to be smaller than those of younger adults (D’Aloisio and Klein, 1990), suggesting that the larger RT interference effects in older adults are related to a response bias favoring accuracy over speed on incongruent trials. In patient groups, larger RT interference effects (i.e., impaired conflict resolution) have
Go/No-Go (GNG, Executive Control) Frequently used to measure response inhibition or sustained attention, the GNG task employs a continuous stream of two different stimuli for which a binary decision must be made, such that one stimulus type requires a response (go) and the other stimulus type requires the participant to withhold a response (no-go). Response inhibition performance is measured by the percent of responses on no-go trials (false alarms; commission errors), particularly when go trials are more frequent than nogo trials (Carter et al., 2013). In contrast, sustained attention is measured by response performance on go trials (omission errors and reaction time), particularly when go trials are less frequent compared to no-go trials (also referred to as a vigilance or traditionally formatted task or TFT; Carter et al., 2013). Response inhibition deficits are seen in acquired brain injury, bipolar 1 All tasks contained within the DalCAB employ a variation of playing cards or card suit stimuli, permitting direct comparison of performance across increasingly complex tasks. See (Figure 1). 2 Due to methodological changes that resulted in a small sample size (n = 15), analysis of the location working memory task is not included in the current paper.
Frontiers in Psychology | www.frontiersin.org
3
June 2016 | Volume 7 | Article 823
Jones et al.
DalCAB: Methodology and Reliability
TABLE 1 | DalCAB task descriptions, outcome measures, and task-related variables and effects of interest. Task and description
Outcome measures
Task variable
Effect of interest
Effect obtained
SRT: Respond to each stimulus, with varying response-stimulus intervals.
RTb % correct
Response-stimulus interval (three, between 500 and 1500 ms).
Temporal preparation effect: Faster RTs with longer RSIs (e.g., Henderson and Dittrich, 1998; Vallesi et al., 2013 for review).
Yes
GNG: Respond to single target color, with high (80%) or low (20%) frequency targets.
RTb % correct %FA
Proportion Go Trials (80, 20%).
Response inhibition: Faster RTs and more false alarms (button press on a no-go trial) when go frequency is high (80%). Sustained attention: More omissions when go response is low (20%; e.g., Carter et al., 2013).
Yes
CRT: Indicate the color of each stimulus (2-choice responses; 50% each choice).
RTb % correct
Trial type (switch, no-switch in response).
Switch effect: Slower RTs on trials that require a change in response from the previous trial (e.g., Bailon et al., 2010).
Yes
Dual Task: Complete CRT while silently counting the number of each color of stimuli presented. Count probe for one color at the end of each set.
RTb (CRT) % correct CRT % correct counting
CRT trial type (switch, no-switch); Counting set size (8, 12).
Switch effect in the CRT task: Slower RTs on trials that require a change in response from the previous trial.
Yes
Working memory load effect: Slower choice RTs overall when compared to the single task CRT (Baddeley and Della Sala, 1996; Hommel and Doeller, 2005).
Yes
Flanker: Indicate shape of a central target flanked above and below by same- or different-shaped distractors (50% congruent with flanker shapes).
RTb % correct
Flanker Congruency (Congruent, Incongruent).
Congruency effect: Slower RTs and more errors when flanking stimuli do not match the target (incongruent trials; Eriksen and Eriksen, 1974; Ishigami and Klein, 2010, 2011).
Yes
IM: Indicate whether a probe item was present or absent in a preceding study set of 2–6 items (50% present).
RTb % correct
Set size (three, between 2 and 6); Trial type (present, absent).
Set size effect: Slower RTs for larger set sizes (Sternberg, 1969; Poewe et al., 1991; Ferraro and Balota, 1999).
Yes
LM: Indicate whether a probe location was present or absent in preceding study sets of 2–6 spatial locations (50% present).
RTb % correct
Set size (three, between 2 and 6); Trial type (present, absent).
Set size effect: Slower RTs for larger set sizes (Sternberg, 1969; Poewe et al., 1991; Ferraro and Balota, 1999);1
N/A2
VS: Locate and indicate orientation (upright vs. inverted; 50% each) of a target among different shape distractors that are a different color (feature search) or the same color (conjunction search) as the target.
RTb % correct
Set size (three, between 6 and 18); Search type (feature, conjunction).
Set size effect: Slower RTs for larger set sizes in conjunction search (Treisman and Gelade, 1980; Davis and Palmer, 2004).
Yes
b Reaction
time derived from correct trials only.
been associated with elevated symptom severity in adults with post-traumatic stress disorder (Leskin and White, 2007) and borderline personality disorder (Posner et al., 2002). In addition, while interference effects are significantly large in dementia patients (Fernandez-Duque and Black, 2006; Krueger et al., 2009), across many neurodegenerative diseases, accuracy and reaction time performances on the flanker task are associated with different patterns of regional brain atrophy (Luks et al., 2010).
stimuli to be remembered. This stimulus set is followed after a delay by a probe stimulus. The participants’ task is to indicate whether the probe stimulus was present in the previously viewed set. In healthy individuals, as the number of items in the set increases, decision accuracy decreases, and the time required to make a determination about the probe stimulus increases (Sternberg, 1969). In normal aging, memory scanning slows as evidenced by increases in slope and intercept on this task (i.e., the increase in reaction time for each additional item in the set, representing memory scanning rate, and the point at which the set size regression line crosses the y-axis, representing the speed of combined encoding, decision making and response selection aspects of the task), and these measures increase further in
Item Working Memory (Executive Control) Used to measure working memory capacity and scanning efficiency, the item working memory task presents a set of
Frontiers in Psychology | www.frontiersin.org
4
June 2016 | Volume 7 | Article 823
Jones et al.
DalCAB: Methodology and Reliability
individuals with dementia (Ferraro and Balota, 1999). Compared to healthy controls, patterns of memory scanning speed and decision accuracy differ depending on the neurological disorder and the medication state studied. For example, patients with multiple sclerosis are equally accurate but have slower memory scanning speed (Janculjak et al., 1999), while Parkinson’s patients are less accurate and have “normal” memory scanning speed unless they are on medication (levodopa; Poewe et al., 1991). A description of the location working memory task can be found in Table 1, but will not be discussed here.
TABLE 2 | Participant demographic information for healthy adults completing the DalCAB at the baseline and 24-h testing sessions. Baseline N
96 21.7 (3.1) years
Number female (%)
64 (64%)
60 (62.5%)
Number right-handed (%)
92 (92%)
87 (90.6%)
14.8 (2.4) years
14.8 (2.4) years
Mean education (SD)
through an undergraduate research participant pool at Dalhousie University in exchange for partial course credit or through the use of flyers and notices posted in and around the Dalhousie University community (e.g., library, coffee shops, etc.) in exchange for a per-session dollar amount. All participants provided informed consent following procedures approved by the Capital District Health Authority Research Ethics Board in Halifax, Nova Scotia, Canada. In advance of participation, all participants were screened through self-report for past or current neurological disorders, loss of consciousness for more than 5 min, history of neuropsychiatric disorders and current use of antidepressant or anti-anxiolytic medications known to influence cognitive performance. Two participants were excluded in advance of participation due to their medication use and data from one participant were removed from analysis due to the use of an incorrect testing procedure. Four participants also withdrew or were removed after the baseline session due to noncompliance with the study protocol. Thus, 100 participants completed the DalCAB at baseline and 96 completed the DalCAB at 24 h after baseline (see Table 2 for sample demographic information).
The visual search task has been used to measure spatial orienting and selection. In this task, a target is presented within distractor sets of various sizes and the participant’s task is to respond to the target (either a detection or identification response; Davis and Palmer, 2004). When the target stimulus is very different from the distractors (e.g., a different color) response to the target is fast and independent of the number of distractors (feature search). In contrast, if the target and distractors share some (but not all) features in common with the target, search is slower and influenced by distractor set size (conjunction search; Treisman and Gelade, 1980). Compared to healthy controls, a differential effect of performance has been found across feature and conjunction search types depending on the neurological disorder. For example, overall performance on both search types has been shown to decrease (i.e., increased RTs and error rates) in persons with mild cognitive impairment (e.g., Tales et al., 2005) and Alzheimer’s Disease (e.g., Foster et al., 1999; Tales et al., 2005). In contrast, while persons with Schizophrenia have been shown to exhibit slowed RTs in conjunction search, little difference is found between patients and controls for feature search. Computerized visual search paradigms have also been shown to differentiate between stroke patients and healthy controls and between stroke patients with and without spatial neglect. The purpose of this study is twofold. First, we report normative data for seven of the DalCAB tasks2 obtained from a preliminary sample of healthy adults (n = 100, 18–31 years of age), including analyses of individual tasks to determine the presence or absence of the expected pattern of effects within each task. These data are intended to serve as pilot evidence for further exploration of the convergent validity of our interpretation of the DalCAB3 , Second, we report the test-retest reliability and practice effects from our healthy adult sample (n = 96).
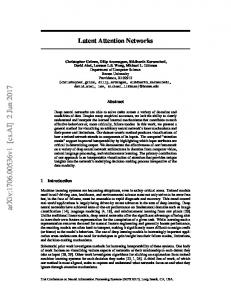
Apparatus and Procedure All tasks contained within the DalCAB employ a variation of playing cards or card suit stimuli (example stimuli shown in Figure 1). Stimuli were presented on Apple Computers (iMac G3 and iMac with a 27-inch monitor). Participants’ responses to stimuli were collected using a two-button mouse. Participants were seated 50 cm away from the computer monitor on which all instructions, practice trials, and experimental trials for the DalCAB tasks were presented. For each task, the experimenter read the instructions printed on the screen to the participant. Speed and accuracy were equally emphasized in all task instructions. Participants were then given the opportunity to practice the task (12–36 trials, depending on the task) during which time they received auditory and/or visual feedback about their performance. Once comfortable with the nature of the task, the participant completed the experimental trials without auditory or visual feedback about their performance. All participants completed the DalCAB tasks in the same order (as described above). Programming changes during the development of the Location working memory task resulted in a small sample size (n = 15); thus, the Location working memory task will not be presented in this report2 . A description of all tasks included in the DalCAB are presented in Table 1 (see also Jones et al., 2015).
METHODS Participants One-hundred and three healthy adults were enrolled in the study. Demographic information for participants included in the analyses is presented in Table 2. Participants were recruited 3 We
have indirectly compared the pattern of results/performance on the DalCAB to those reported by others using similar tasks purported to measure the components of attention as an initial step in exploring the validity of our interpretation of the DalCAB. Formal evidence of the validity of our interpretation of the DalCAB is needed before conclusions about our results can be generalized.
Frontiers in Psychology | www.frontiersin.org
100 21.8 (3.1) years
Mean age (SD)
Visual Search (Orienting and Selection)
24-h
5
June 2016 | Volume 7 | Article 823
Jones et al.
DalCAB: Methodology and Reliability
effects and interactions. Greenhouse-Geisser corrected p-values are reported.
Individual Task Analyses: Mean Reaction Time and Accuracy Table 3 presents mean reaction times and standard deviation of reaction times of performance for male and female participants on each level of the independent variables of interest for all tasks at the baseline and 24-h sessions. For each task, we analyzed task specific effects on reaction time across sessions using a series of mixed factor Analysis of Variance (ANOVAs), with a betweensubjects factor of Sex (male, female) and within-subjects factors of Session (baseline, 24-h), and other independent variables related to the individual tests (described in Table 1). Only relevant task effects for reaction time are presented in text (below), but all main and interaction effect results for reaction time are presented in Table 3. Table 4 presents mean accuracy and standard deviation of accuracy of performance for male and female participants on each level of the independent variables of interest for all tasks at the baseline and 24-h sessions. With the exception of the choice reaction time component of the dual task (described below) and the go-no-go task, a comparison of the pattern of mean RTs and accuracy within each task revealed no apparent speedaccuracy trade-offs. Given that the DalCAB was designed to assess attentional functioning using predominantly RT measures, and accuracy was high in our young, healthy adult sample (see Table 4), we have only presented analysis of accuracy data for a few relevant measures below (percent false alarms in the Go/NoGo task and percent correct in the item work memory task). All main and interaction effects on accuracy in the Go/No-Go and item working memory tasks are presented in Table 4. Standard error of the mean (SE) of RT and accuracy data are provided in the text where appropriate.
FIGURE 1 | Example of card suit stimuli used in the DalCAB tasks. (A) Card as shown in simple response, inhibition, decision speed, dual task and item working memory tasks. (B) Card suit shapes as shown in the flanker tasks. Card suit shapes like those in (B) are also used in the visual search task.
Each DalCAB session, including practice and experimental trials, took ∼1-h to complete.
DATA ANALYSIS Mean reaction time (RT) in milliseconds and accuracy measures (% correct, % false alarms) were collected. Reaction times less than 100 ms were coded as anticipatory and were excluded from analysis. Reaction times greater than the maximum reaction time (varied by task) were coded as misses and were also excluded from analysis [mean percent anticipations across tasks (SD) = 0. 41% (0. 74%); mean percent misses across tasks (SD) = 1.2% (2%)]. All correct trials with RTs between these lower and upper bounds were included in RT analyses. No further data cleaning or transformations of the data were applied prior to analysis4 . For all analyses, the alpha level required for significance was set at p = 0.05 and, where appropriate, pairwise comparisons with Bonferroni correction were used to explore significant main
Individual Task Performance Analyses: Practice Effects To quantify the change in reaction time across the repeated testing sessions, mean practice effects (24-h mean—baseline mean) for overall mean RT and mean RT across the levels of the DalCAB task variables of interest are presented in Table 5. Differences in reaction times between baseline and the 24-h session were assessed using paired samples t-tests. Standard deviation of the difference scores in performance and effect sizes for practice effects (Cohen’s d) were also calculated for the session 24-h after baseline. These values are also shown in Table 5. The ICC scores, practice effects, standard deviation of the difference score, and effect sizes can be used to compute reliable change indices.
4 The
average skewness value across the analyzed DalCAB tasks presented here was 2.24 (range: 1.53–3.15). A previous analysis of these data in which more conservative lower and upper bound RT cutoffs were employed as a data cleaning method was carried out. Lower bound RT cutoff values were defined as the minimum reaction time at which 75% accuracy was achieved on each individual task, and ranged from 100 to 400 ms depending on task complexity (see Christie et al., 2013). Below these lower bound cutoffs, responses were considered anticipations and were excluded from analysis. Upper bound RT outliers on each task were defined within each participant using a z- score cut-off value of 3.29 (Tabachnick et al., 2001, pp. 67). Analysis of these cleaned data resulted in no change to the pattern of results or the assessments of test-retest reliability reported here. We also analyzed the data after applying an inverse transformation (i.e., 1/RT). Analysis of these transformed data was consistent with the analyses reported here with the following three exceptions: (1) a significant main effect of session in the SRT task (consistent with our already reported practice effect); (2) A significant interaction between gender and RSI in the SRT task; post hoc analyses revealed the same pattern of RT across RSI for both males and females, consistent with the pattern of RT across RSI reported above and; (3) longer RTs for females than males in the feature search task. No changes in the assessment of practice effects or test-retest reliability were found using the transformed data.
Frontiers in Psychology | www.frontiersin.org
Individual Task Performance Analysis: Test-Retest Reliability The test-retest reliability of performance as defined by the dependent variables in each task was analyzed using intra-class correlations (ICC) comparing the 24-h session data to baseline. ICC are presented in Table 5. For the current analysis, intraclass
6
June 2016 | Volume 7 | Article 823
Jones et al.
DalCAB: Methodology and Reliability
TABLE 3 | Reaction times (RT; in ms) for relevant variables on the DalCAB tasks for groups of male and female participants at the baseline and 24-h testing sessions. DalCAB Task variable*
Male
Female
Main effects
Interactions
Baseline Mean (SD)
24-h Mean (SD)
Baseline Mean (SD)
24-h Mean (SD)
36 252 (31) 282 (44) 239 (32) 234 (28) −47 (31)
35 255 (38) 288 (47) 242 (48) 236 (28) −52 (39)
64 274 (61) 300 (72) 264 (60) 259 (57) −41 (34)
60 265 (42) 296 (59) 251 (39) 249 (36) −48 (35)
RSI: F(2, 186) = 206.88, p MRT ± SE RSI1000 = 247.77 ± 4.31 (p < 0.001) > MRT ± SE RSI1500 = 243.60 ± 3.92 (p = 0.04); F(2, 186) = 206.88, MSE = 792.39, Table 3]. Twenty-four hour practice effects were not significant for the SRT task, for overall mean reaction time or the preparation effect (Table 5). The test-retest reliability (ICC) score of mean RTs in the 24h session was Very Good (0.825). In contrast, ICC scores for the RT preparation effect (24 h session RT – baseline RT) were statistically significant but much lower, falling below the Good range (0.570).
2-Choice Reaction Time (CRT) The mixed factor ANOVA on mean reaction time (as described above), including the task variable of Trial Type (switch, nonswitch) revealed the expected pattern of switch costs; participants were slower to respond when the stimulus/response changed on consecutive trials (i.e., MRT ± SE switch trials = 432.9 ± 5.6 ms) than when the stimulus/response remained the same [i.e., MRT ± SE non−switch trials = 400.6 ± 5.6 ms; F(1, 94) = 108.34, MSE = 857.65, p < 0.001]. A significant practice effect for mean RT was found indicating that participants were faster at 24-h than at baseline (MRT 24−h ± SE = 404.6 ± 5.7 ms, MRT baseline ± SE = 428.9 ± 6.1 ms, p < 0.001); no practice effects were found for the RT switch cost (Table 5). The test-retest reliability score of mean RTs at the 24-h interval was in the Good range (24-h: 0.749), but the test-retest reliability score for the RT switch cost (i.e., RT Switch minus RT No-switch) was below the Good range (24-h: 0.609, Table 5).
Go/No-Go (GNG) The mixed factor ANOVA on mean reaction time and accuracy (as described above) including the task variable of percent-Gotrials (20%-Go, 80%-Go) revealed the expected pattern of faster reaction times [F(1, 94) = 269.13, MSE = 784.88, p < 0.001]
Frontiers in Psychology | www.frontiersin.org
8
June 2016 | Volume 7 | Article 823
Jones et al.
DalCAB: Methodology and Reliability
TABLE 4 | Mean accuracy for independent variables on the DalCAB tasks for groups of male and female participants at the baseline and 24-h testing sessions. DalCAB Task variable*
Male Baseline Mean (SD)
Female
24-h Mean (SD)
Baseline Mean (SD)
Main effects
Interactions
PC Percent go-trials: F(1, 94) < 1, p = 0.669 Session: F(1, 94) = 5.19, p = 0.025 Sex: F(1, 94) = 1.7, p = 0.19 FA Percent go-trials: F(1, 94) = 129.93, p < 0.001 Session: F(1, 94) = 4.32, p = 0.04 Sex: F(1, 94) = 1.10, p = 0.29
PC Percent-Go-trials × Session: F(1, 94) < 1, p = 0.97 Percent-Go-trials × Sex: F(1, 94) < 1, p = 0.77 Session × Sex: F(1, 94) < 1, p = 0.75 Percent-Go-trials × Session × Sex: F(1, 94) = 2.87, p = 0.093 FA Percent-Go-trials × Session: F(1, 94) = 4.98, p = 0.031 Percent-Go-trials × Sex: F(1, 94) < 1, p = 0.986 Session × Sex: F(1, 94) < 1, p = 0.75 Percent-Go-trials × Session × Sex: F(1, 94) = 2.0, p = 0.16 F(1, 94) = 2.0, p = 0.16
Set size: F(2, 126) = 121.86, p < 0.001 Target: F(1, 63) = 15.64, p < 0.001 Session: F(1, 63) = 5.44, p = 0.023 Sex: F(1, 63) = 2.11, p = 0.15
Set size × target: F(2, 126) = 10.87, p < 0.001 Set size × session: F(2, 126) = 2.27, p = 0.109 Set size × sex: F(2, 126) = 1.59, p = 0.211 Target × session: F(1, 63) = 1.33, p = 0.253 Target × sex: F(1, 63) = 2.19, p = 0.144 Session × sex: F(1, 63) < 1, p = 0.642 Session × target × sex: F(1, 63) = 1.22, p = 0.274
24-h Mean (SD)
SRT N Mean % correct
36
35
64
60
98.1 (2.4)
95.8 (4.6)
98.8 (1.5)
97.9 (2.2)
500ms RSIa
99.9 (0.1)
98.9 (4.6)
99.8 (4.5)
99.7 (2.0)
1000ms RSIa
99.0 (2.0)
98.1 (3.2)
98.8 (3.0)
98.8 (2.1)
1500ms RSIa
95.6 (6.6)
90.4 (8.6)
97.7 (3.7)
95.3 (5.3)
36
35
64
61
99.7 (1.7)
99.4 (2.4)
100 (0)
99.5 (2.2)
0.3 (0.6) 99.8 (0.5)
0.3 (0.7) 99.3 (2.2)
0.3 (0.6) 99.9 (.3)
0.2 (0.5) 99.8 (1.2)
8.1 (9.3)
8.9 (6.8)
6.6 (6.8)
10.2 (9.7)
GNG N 20% Go: % correct 20 % Go: % FAb 80% Go: % correct 80 % Go: % FAb
CRT N Mean % correct
36
35
64
61
95.0 (5.7)
95.0 (4.4)
96.4 (2.8)
96.4 (3.2)
No Switch
95.0 (6.8)
95.3 (5.4)
96.2 (3.3)
96.3 (4.1)
Switch
95.1 (5.8)
94.6 (4.9)
96.6 (3.3)
96.4 (3.6)
DUAL TASK CRT N Mean % correct
36
29
64
59
96.7 (3.0)
96.1 (3.9)
97.2 (3.2)
96.4 (3.3)
No Switch
98.1 (2.7)
97.6 (3.1)
98.0 (3.4)
97.4 (2.7)
Switch
95.1 (4.0)
94.2 (5.2)
96.1 (3.8)
95.1 (4.6)
Interference effectc
1.7 (4.5)
1.5 (3.5)
0.8 (3.4)
−0.1 (2.7)
FLANKER N
36
35
63
61
Mean % correct
94.5 (4.1)
94.5 (4.2)
95.1 (4.4)
95.8 (4.1)
Congruent
94.8 (4.1)
95.3 (3.8)
95.7 (4.7)
96.5 (4.3)
Incongruent
94.3 (5.1)
93.7 (5.5)
94.4 (5.2)
95.3 (4.8)
43 79.9 (7.9)
42 82.8 (7.0)
ITEM WORKING MEMORY N Mean % correct
23 81.9 (6.0)
23 83.2 (8.1)
Set size: 2
93.5 (5.1)
90.4 (8.2)
90.1 (9.3)
92.4 (7.7)
Set size: 4
79.4 (7.9)
85.9 (8.1)
79.8 (12.3)
82.1 (11.6)
Set size: 6
73.0 (12.2)
77.6 (12.0)
70.1 (11.9)
71.0 (10.3)
(Continued)
Frontiers in Psychology | www.frontiersin.org
9
June 2016 | Volume 7 | Article 823
Jones et al.
DalCAB: Methodology and Reliability
TABLE 4 | Continued DalCAB Task variable*
Male Baseline Mean (SD)
Female
24-h Mean (SD)
Baseline Mean (SD)
Main effects
Interactions
24-h Mean (SD) Session × set size × sex: F(2, 126) = 3.33, p = 0.04 Target × set size × sex: F(2, 126) = 3.48, p = 0.035 Session × target × set size: F(2,126) < 1, p = 0.939 Set size × target × session × sex: F(2, 126) = 1.21, p = 0.301
VISUAL SEARCH N
36
35
64
61
% correct
94.3 (3.6)
93.7 (6.6)
94.1 (5.0)
94.6 (4.2)
Set size: 6
94.2 (4.7)
93.4 (5.8)
94.1 (6.1)
94.3 (5.8)
Set size: 12
94.1 (5.0)
93.4 (7.0)
93.6 (5.9)
94.8 (5.6)
Set size: 18
94.5 (4.7)
94.1 (8.6)
94.5 (5.8)
94.7 (4.3)
% correct
95.6 (5.4)
94.6 (6.3)
94.8 (5.7)
95.6 (4.0)
Set size: 6
95.9 (5.1)
93.8 (7.1)
94.9 (6.7)
95.5 (4.5)
Set size: 12
95.1 (6.5)
95.4 (5.6)
95.2 (6.4)
95.5 (5.9)
Set size: 18
95.7 (6.6)
94.7 (8.8)
94.3 (6.1)
95.9 (4.6)
Feature search
Conjunction search
*Please refer to the written results section for a description of select DalCAB task variables on accuracy. interval. b False alarm. c Interference effect = dual task mean % correct − CRT mean % correct. Bold indicates significance at the p < 0.05. a Response-stimulus
Dual Task
task to the choice reaction time task did not change across testing sessions. The ICC scores for mean RTs and the RT switch cost at 24-h interval were in the Good to Very Good range (Mean RT: 0.781 and RT switch cost: 0.817; Table 5). The test-retest reliability score for the WM load RT effect (difference in reaction time performance between the dual tasks and CRT) 24-h after baseline was Good (0.735), but the dual task interference effect (difference in accuracy between dual task CRT and CRT) was below the Good range (0.496).
Eight participants (2 women, 6 men) were removed from the dual task CRT analysis due to a complete lack of responding to CRT trials in the 24-h session. Thus, 58 women and 30 men were included in the mixed factor dual task CRT analysis. The mixed factor ANOVA on mean RT (as described above), including the task variable of Trial Type (switch, non-switch) revealed the expected pattern of switch costs; participants were slower to respond when the stimulus/response changed on consecutive trials (i.e., MRT ± SE switch trials = 581.4 ± 10.7 ms) than when the stimulus/response remained the same [i.e., MRT ± SE non−switch trials = 436.6 ± 6.69 ms; F(1, 86) = 583.16, MSE = 2796.3, p < 0.001, Table 3]. A significant practice effect for mean RT indicated that participants were significantly faster at 24-h than at baseline (MRT baseline ± SE = 539.5 ± 8.8 ms, MRT 24−h ± SE = 483.38 ± 7.5 ms, p < 0.001). This improvement in performance RT between baseline and 24-h was paired with a decrease in performance accuracy (percent correct), suggesting a speed-accuracy trade-off (MPC baseline ± SE = 97 ± 0.32 %, MPC 24−h ± SE = 96 ± 0.37 %, p < 0.001, not presented in table). The RT switch cost and WM load RT effect were also significantly reduced 24-h after baseline (MRT switch cost baseline ± SE = 152.19 ± 6.2 ms, MRT switch cost 24−h ± SE = 140.52 ± 5.6 ms, p = 0.037; MWM load RT baseline ± SE = 107.18 ± 7.2, MWM load RT 24−h ± SE = 79.34 ± 6.2 ms, p < 0.001; Table 5). No significant practice effects were found for the DT interference effect (Table 5) indicating that the additional workload from adding a secondary
Frontiers in Psychology | www.frontiersin.org
Flanker The mixed factor ANOVA on mean reaction time including the task variable of Flanker Congruency (congruent, incongruent) revealed that RTs were faster for congruent trials than incongruent trials [congruent = 452.8 ± 5.6 ms, incongruent = 470.2 ± 5.5 ms; F(1, 94) = 105.11, MSE = 256.05, p < 0.001]. RTs for male performance were also faster than RTs for female performance [males = 447.6 ± 8.8 ms, females = 475.4 ± 6.7 ms; F(1, 94) = 6.29, MSE = 10903.81, p = 0.014, Table 3]. A significant practice effect for mean RT was found; participants were faster at 24-h than at baseline (MRT 24−h ± SE = 458.74 ± 6.01 ms, MRT baseline ± SE = 471.90 ± 5.55 ms, p < 0.05, Tables 3, 5). The RT interference effect did not differ across testing sessions (Table 5). The test-retest reliability score of mean RTs at the 24-h session was Very Good (0.871). However, the test-retest
10
June 2016 | Volume 7 | Article 823
Jones et al.
DalCAB: Methodology and Reliability
Item Working Memory
TABLE 5 | Change-based reliability statistics for participants 24-h after baseline. DalCAB Task
Due to changes in programming, the final version of the item working memory task was not completed by all participants (n = 65; 42 female). The mixed factor ANOVA on mean reaction time including the task variables of Set Size (2, 4, 6) and Target (present, absent) revealed the anticipated effect of Set Size, such that RTs were significantly slowed for each additional two-item increase in working memory set size [F(2, 126) = 220.24, MSE = 11292.38, p < 0.001; Set 2 = 701.4 ± 11.8 ms, Set 4 = 830.0 ± 13.4 ms, Set 6 = 904.5 ± 15.7 ms, all p < 0.001] and accuracy (percent correct) significantly decreased for each additional twoitem increase in working memory set size (Set 2 = 92 ± 0.8%, Set 4 = 82 ± 11%, Set 6 = 73 ± 12%, all p < 0.001). A significant interaction between Set size and Target was also found for reaction time [F(2, 126) = 3.64, MSE = 8039.09, p = 0.03]; post-hoc pairwise comparisons indicated the same pattern of effect of Set size on RTs for both target absent and target present trial types (all p < 0.01; mean RT is presented collapsed across target in Tables 3, 4). Two significant three way interactions for percent correct were also found. An interaction among Set size, Target and Sex [F(2, 126) = 3.48, p = 0.035] revealed the above reported decrease in percent correct performance across working memory set size increase for women, regardless of Target. In contrast, for men, a decrease in accuracy was found between Set 2 and Set 6 for both Target types, but only between Set 4 and Set 6 when the Target was present in the working memory set. (Target Absent: Set 2: 93%, Set 4: 75%, Set 6: 69%; Target Present: Set 2: 91%, Set 4: 90%, Set 6: 82%). Similarly, the interaction between Session, Set size and Sex [F(2, 126) = 3.33, p = 0.04] revealed the above described decrease in accuracy across Set size for women, regardless of session, but not for men (Session 1: Set 2 > Set 4, p < 0.001; Set 2 > Set 6, p < 0.001; Set 4 = Set 6, p = 0.164; Session 2: Set 2 = Set 4, p = 1.0; Set 2 > Set 6, p = 0.007; Set 4 > Set 6, p = 0.006; mean percent correct is presented collapsed across target type in Table 4). A significant practice effect for mean RT indicated that participants were faster at 24-h than at baseline (MRT 24−h ± SE = 780.77 ± 14.31 ms, MRT baseline ± SE = 838.54 ± 13.77 ms, p < 0.001); participants were also more accurate at 24-h than at baseline (Table 5). The practice effect for the set size RT slope was not significant. The test-retest reliability score for mean RTs at the 24-h session was in the Good range (0.795), whereas the ICC scores for the set size slope and mean percent of correct responses (MPC ) fell below the Good range (0.623 and 0.417, respectively).
24-h ICC
PE
SDD
Cohen’s d
Mean RT
0.825#
−2.7 ms
35.6 ms
0.07
RT preparation effecta
0.570#
−6.1 ms
37.8 ms
0.16
0.01
SRT N
95
GNG N
96
20% Go RT
0.836#
0.4 ms
35.8 ms
20 % Go: % FAb
0.252
−0.1%
0.8%
0.07
80% Go RT
0.847#
−9.7 ms*
31.2 ms
0.32
80 % Go: % FAb
0.548#
2.4%*
9.2%
0.27
Mean RT
0.749#
−24.0 ms*
46.8 ms
0.51
RT switch costc
0.609#
2.4 ms
36.6 ms
0.07
Mean RT
0.781#
−50.4 ms*
53.0 ms
0.99
RT switch costc
0.817#
−10.0 ms*
44.3 ms
0.23
WM load RT effectd
0.735#
−26.0 ms*
54.2 ms
0.48
DT Interference effecte
0.496#
−0.7%
3.7%
0.18
Mean RT
0.871#
−13.2 ms*
36.6 ms
0.36
RT Interference effectf
0.301
−0.7 ms
26.7 ms
0.02
Mean RT
0.795#
−57.8 ms*
81.1 ms
0.71
Set-size RT slope
0.623#
−3.5 ms
26.4 ms
0.14
% correct
0.417
2.5%*
8.7%
0.29
CRT N
96
DUAL TASK CRT N
88
FLANKER N
96
ITEM MEMORY N
65
VISUAL SEARCH N
96
Feature search Mean RT
0.770#
−35.9 ms*
77.4 ms
0.49
Set-size RT slope
0.096#
0.30 ms
6.70 ms
0.06
Mean RT
0.718#
−163.2 ms*
142.4 ms
1.19
Set-size RT slope
0.464#
−9.29 ms*
19.91
0.53
Conjunction search
Bold numbers highlight good to very good reliability and significantly large practice effects. ICC, Intraclass correlation (two-way random, absolute agreement, average measures); #, significant F-test (p < 0.01); Practice effect (PE), post session mean—baseline mean; *significant difference based on paired t-test (p < 0.05); SDD , standard deviation of the difference score. a Preparation effect = 1500 – 500 ms RSI RT. b False alarm. c Switch cost = RT Switch - RT No-switch. d Working memory load RT effect = dual task mean minus CRT mean. e DT interference effect = dual task CRT accuracy – CRT accuracy. f Interference effect = incongruent RT − congruent RT.
Visual Search Mixed factor ANOVAs on mean reaction time including the task variable of Set Size (6, 12, and 18) were performed for each Search Type (feature, conjunction) separately. In the feature search task, a significant main effect of Set Size was found; RTs were faster for the smallest set than the two larger set sizes, which did not differ [F(2, 188) = 7.46, MSE = 1504.13, p < 0.001; Set 6 = 619.4 ± 8.8 ms, Set 12 = 630.9 ± 10.1 ms, Set 18 = 634.4 ± 11.0 ms; Set 6 < Set 12, p = 0.008; Set 6 < Set 18, p = 0.004; Set 12 = Set 18, p = 1.0]. While the set size main effect was significant, it should be noted that search
reliability scores for the RT interference effect (i.e., incongruent RT minus congruent RT) was less than Good (0.301, Table 5).
Frontiers in Psychology | www.frontiersin.org
11
June 2016 | Volume 7 | Article 823
Jones et al.
DalCAB: Methodology and Reliability
slopes were small and almost 0 (range from