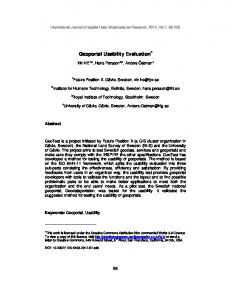
Jun 21, 2006 - Education 2276 201 N.Rose Ave. Bloomington,IN 47405-. 1006. Frokjaer, E., Hertzum, M., and Hornbaek, K. (2000). Measuring Usability: Are ...
To appear in Proc. 15th Annual Business Congress, IMDA2006, June 18-21, 2006, Saraevo, Bosnia and Herzegovina.
Measuring the Usability of Web-Based Services Exemplified by University Student Information System Asil Oztekin, Fatih University, Turkey Alexander Nikov, Fatih University, Turkey Selim Zaim, Fatih University, Turkey Ali Riza Guner, Fatih University, Turkey
For measuring the usability of web-based services a checklist tool is developed. It presents a modification of SERVQUAL model for measuring service quality extended with usability dimensions. By this tool a quantitative usability index is determined. A case study with university student information system including 179 students is carried out. By a structural equation model the weighting coefficients of the usability index are determined. By stepwise regression analysis the checklist dimensions and items with highest and lowest contribution to web-based service usability are determined. The web-based services gain increasing importance in the last years. For example Google became the main competitor of Microsoft. The development of good quality websites requires sophisticated methods for design and evaluation like (Frokjaer, Hertzum & Hornbaek, 2000), (Hornbaek, 2006), (Li, Tan & Xıe, 2002), (Nikov, Vassileva, Anguelova, Tzvetanova, & Stoeva, 2003), (Sauro, & Kindlund, 2005). For measuring the service quality, the SERVQUAL model (Parasuraman, Zeithmal & Berry, 1988) and its modification for web-based services (Li, Tan & Xie, 2002) are most widely used. These models are not considering usability dimensions. Usability presents ‘‘the capability to be used by humans easily and effectively’’; ‘‘quality in use’’; ‘‘the effectiveness, efficiency, and satisfaction with which specified users can achieve goals in particular environments’’ (Hornbaek, 2006); how easy it is to find, understand and use the information displayed on a website (Keevil, 1998). For overcoming this drawback of SERVQUAL a checklist tool is developed. It presents a modification of SERVQUAL enhanced with usability dimensions. The performance of this tool is investigated by a study with the web-based student information system of Fatih University.
Description of the Checklist Tool for Measuring of Web-Based Service Usability SERVQUAL (Li, Tan & Xie, 2002) is measuring webbased service quality in the scale [1,5] by 28 checklist questions in 6 dimensions. For extending SERVQUAL to measure the usability of web-based services these 6 dimensions and the usability dimensions according to usability heuristics (Nielsen, 1994) and standard ISO 924110 (ISO, 1998) are studied (cf. Table 1). Only “Navigation” and “User control and freedom” in usability heuristics and “Controllability” in ISO 9241–10 are outside of SERVQUAL dimensions (cf. Figure 1). Figure 1. Comparison of Web-Based Service Quality and Usability
Construction of Checklist 29 questions were selected for the checklist tool of modified SERVQUAL. They include also 3 aggregated questions for measuring effectiveness, efficiency and satisfaction. In this study the effectiveness is measured by the indicator completion percentage of the tasks; the
efficiency by task completion time and the satisfaction by a 5-point semantic distance scale. In this way, objective and subjective parameters are measured. By pretests with limited number of students using the student information systems of Fatih University some questions were changed and deleted. The final checklist tool is shown on Figure 3.
Figure 2. Usability Evaluation Dimensions
Usability Index
Figure 3. Structure of Checklist Tool By Q are denoted the questions of the checklist.
Discussions of how to measure the quality of computer systems have gone on for several decades, first under the heading of ergonomics and ease-of-use, and later under the heading usability. However, recently discussions recur on which measures of usability are suitable and on how to understand the relation between different measures of usability (Hornbaek, 2006). To increase the meaningfulness and strategic influence of usability data, there is a need to represent the entire construct of usability as a single dependent variable (usability index) without sacrificing precision (Sauro, & Kindlund, 2005). The usability index is a measure, expressed as a per cent, of how closely the features of a web site match generally accepted usability guidelines (Keevil, 1998). It is widely accepted that usability evaluation depends on efficiency, effectiveness, and satisfaction. In (Frokjaer, Hertzum & Hornbaek, 2000), effectiveness is defined as the accuracy and completeness with which users achieve certain goals. Indicators of effectiveness include quality of solution and error rates. Efficiency is the relation a) between the accuracy and completeness with which users achieve users certain goals and b) the resources expended in achieving them. Indicators of efficiency include task completion time and learning time. Satisfaction is the users’ comfort and positive attitudes towards the use of the system. Users’ satisfaction can be measured by attitude rating scales. The correlations among these usability dimensions depend in a complex way on the application domain, the user’s experience, and the use context. During last three years in CHI proceedings 11 out of 19 experimental studies involving complex tasks account for only one or two dimensions of usability. When these studies make claims concerning overall usability, they rely on risky assumptions about correlations between usability dimensions. Unless domain specific studies suggest otherwise, effectiveness, efficiency, and satisfaction should be considered independent dimension of usability and all be included in usability measuring (Frokjaer, Hertzum & Hornbaek, 2000). The usability index can be determined by the aggregated evaluations of the usability dimensions effectiveness, efficiency and satisfaction (cf. Figure 2): UI1=a1*effectiveness+a2*efficiency+a3*satisfaction
(1)
Q26
Controllability& Navigation Q22 Q21
Integration of Communication Q19 Q18
Quality of Information Q16
Usability index 2
Q15
Empathy Q13 Q12
Assurance Q9 Q8
Responsiveness Responsiveness Q5 Q4
Reliability Reliability Q2
Tangibles Tangibles
Q1
We propose to calculate the usability index UI2 based on the relevant usability checklist items and dimensions as shown on Figure 3. The structural equation modeling (Arbuckle, 1997) can be applied for determining the weighting coefficients a1, a2 and a3. By substituting UI2=UI1, the usability can be studied by regression analysis.
IU 2 = b1Q1 + b2 Q2 + ...b26 Q26 + b27
(3)
To appear in Proc. 15th Annual Business Congress, IMDA2006, June 18-21, 2006, Saraevo, Bosnia and Herzegovina.
Table 1. Clustering Different Checklist Formation Approaches SERVQUAL
(Parasuraman, Zeithmal & Berry, 1988)
Web-based SERVQUAL
(Li, Tan & Xie, 2002)
Tangibles
Usability Heuristics
(Nielsen, 1994)
ISO 9241-100
Physical constraints
Checklist Tool Tangibles
Reliability
Call-back Systems
Flexibility and efficiency of use
Suitability for the task
Reliability
Responsiveness
Responsiveness
Consistency and standards
Suitability for the task Self-descriptiveness
Responsiveness
Assurance
Competence
Match between system and real world
Assurance
Visibility of system status (feedback) Error prevention Aesthetic and minimalist design Help users recover from errors Empathy
Empathy
Match between system and real world
Conformity with user expectations Error tolerance Individualization
Empathy
Structure of information Quality of information
Quality of information
Quality of Information
Match between system and real world
Integration of Communication
Web Assistance
Recognition rather than recall
Suitability for learning
Integration of Communication
Controllability
Controllability & Navigation
Navigation User control and freedom
Case study The checklist tool was experimentally studied by testing and evaluating the web-based student information system of Fatih University.
Data Collection 179 undergraduate students were selected from five different departments: 58 % from Management Department, 17 % from Department of International Relations, 10 % of the students in Department of Public Administration, 9 % from Department of Industrial Engineering, and 6 % from Economics Department. 40 % of the students were male and 60 % female. Participant’s English knowledge was good enough to perform the tasks. To make the questions more understandable they were translated also in Turkish. All tests were carried out in the computer laboratories of Fatih University by allocating one computer to each participant. The number of the people working around and the noise level was nearly the same.
The participants received checklists containing the aim of the survey, how they would proceed and some descriptive questions such as their names, departments, and gender. They were asked to perform three tasks using their personal accounts in Fatih University Student Information System. These tasks were the same for all participants. After the session they were asked to fill out the checklist. Performing the required three tasks and answering the questions of the checklist took 30-45 minutes per student.
Results and Discussion Most of the current methods to represent system or task usability in a single metric do not include all usability dimensions: effectiveness, efficiency and satisfaction. When researchers or developers use a narrower selection of usability measures for evaluating a system they either (a) make some implicit or explicit assumptions about relations between usability measures in the specific context, or (b)
run the risk of ignoring important dimensions of usability (Frokjaer, Hertzum & Hornbaek, 2000). By the structural equation model shown on Figure 4 the coefficients a1, a2 and a3 of (1) were determined as follows: UI2=0.27*efficiency+0.04*effectiveness+0.69*satisfaction (2) Figure 4. Structural equation model
According to this model the highest importance has user satisfaction for web-based service usability for this sample data gathered – 69%. The contribution of efficiency is 27%. The effectiveness has only 4% contribution to overall usability. The average value of effectiveness of tasks solving is 83%. The low importance of effectiveness can be explained by the absence of information on user errors during solving tasks. This should be taken into account for improving the checklist tool. In (Sauro and Kindlund, 2005) are reported different weighting coefficients 25% for efficiency, 50% for effectiveness and 25% for satisfaction. The usability indices were calculated for all 179 students by (2). Then stepwise regression analysis was carried out by applying equation (3).
Table2. Stepwise Regression Analysis Scores Usability Checklist Index Checklist items as items as (dependent best predictors worst variable) R2 R2 predictors (P value) Q4 0.23 (0.000) 0.004 Q5 Q4,Q27 0.34 (0.000)
0.004
Q5,Q20
Q4,Q27,Q9 0.39 (0.000)
0.004
Q5,Q20, Q7
Q4,Q27,Q9,Q26 0.42 (0.000)
0.003
Q5,Q20, Q7,Q13
The results of regression analysis confirm the predictive power of regression model (R2=0.48). 42% of the variance in usability index is directly explained by the most important checklist items Q4, Q27, Q9, and Q26 (cf. Table 2). In this way these four items explain 90% of the total variance. Their standardized regression coefficients are statistically significant at 0.001 significance levels. The following checklist items and dimensions have the highest influence on web-based service usability and should be taken into account for designing web-based services: Q4: Is the relation between time to perform a task (planning, execution, error correction) and task complexity adequate? Q27: Is the screen visible at a range of distances and in various types of lighting? Q9: Is the use of terminology, controls, graphics and menus consistent throughout the system? Q26: Are function buttons large enough to be usable? The worst predictor variables in the model are the checklist items Q5 ,Q20, Q7 and Q13. They almost do not have any influence on web-based service usability. It should be reconsidered their inclusion into checklist tool or they have to be changed: Q5: Does the system guide novice users sufficiently? Q20: Is it possible to search for information (e.g. phone number) rather than entering the information directly? (Integration of Communication) Q7: Does automated or humane e-mails responses or serving pages give users prompt service? Q13: Is the tone of messages consistently courteous?
Conclusions For measuring the usability of web-based services a checklist tool is developed. It presents a modification of SERVQUAL model for measuring service quality extended with usability dimensions. By this tool a quantitative usability index is determined. A case study with university student information system including 179 students is carried out. By a structural equation model the weighting
coefficients of the usability index are determined. The results of stepwise regression analysis showed that the most significant checklist item influencing web-based service usability is connected with the relationship between time to perform a task and task complexity. The least important checklist item found the system guidance of novice users. Further studies on web-based service usability could include together with subjective data, measured by checklist, also objective data from biophysiological measurements.
References Arbuckle, J., Amos L. (1997). User’s Guide. Version 3.6, Small Waters Corp., Chicago, IL. Frick, T., Elder, M., Hebb, C., Wang, Y., and Yoon, S. (2005).Adaptive Usability Evaluation of Complex Web Sites: How Many Tasks? Indiana University W.W.Wright Education 2276 201 N.Rose Ave. Bloomington,IN 474051006. Frokjaer, E., Hertzum, M., and Hornbaek, K. (2000). Measuring Usability: Are Effectiveness, Efficiency, and Satisfaction Really Correlated? CHI Papers 1-6 April 2000 Volume 2, Issue1. Hornbaek, K. (2006). Current Practice in Measuring Usability: Challenges to Studies and Research. International Journal of Human-Computer Studies, 64 (2006), 79-102. ISO. (1998). Ergonomic Requirements for Office Work With Visual Display Terminals (VDTs)-Part 11: Guidance on Usability (ISO 9241-11:1998(E)). Geneva, Switzerland. Keevil, B. (1998). Measuring the Usability Index of Your Web Site. Keevil & Associates, Toronto, Ontario, Canada. Li, Y.N., Tan, K.C., and Xıe, M. (2002). Measuring Webbased Service Quality. Total Quality Management, Volume 13, No.5, 685-700.Rouledge, Taylor&Francis Group. Nielsen J. (1994). Usability Inspection Methods, Wiley, New York. Nikov, A., Vassileva, S., Anguelova, S., Tzvetanova, S., and Stoeva, S. (2003). WebUse: An Approach for Web Usability Evaluation. 3rd Symposium on Production Research, Istanbul, April 19-20, 2003. Parasuraman, A., Zeithmal, V.A. and Berry, L.L. (1988). SERVQUAL: a multi –item scale for measuring consumer perceptions of service quality. Journal of Retailing. Sauro, J., & Kindlund, E. (2005). A Method to Standardize Usability Metrics into a Single Score. CHI Papers: Methods & Usability 2-7 April 2005, Portland, Oregon, USA