This article has been accepted for publication in a future issue of this journal, but has not been fully edited. Content may change prior to final publication.
Measuring time-varying information flow for scalp EEG signals: orthogonalized partial directed coherence Amir Omidvarnia, Ghasem Azemi, Boualem Boashash, Fellow, IEEE, John M. O’ Toole, Paul Colditz, Sampsa Vanhatalo1 Abstract—This study aimed to develop a time–frequency method that can measure directional interactions over time and frequency from scalp-recorded electroencephalographic (EEG) signals in a way that is less affected by volume conduction and amplitude scaling. We modified the time-varying generalized partial directed coherence (tv-gPDC) method, by orthogonalization of the strictly-causal MVAR model coefficients, to minimize the effect of mutual sources. The novel measure, generalized orthogonalized PDC (gOPDC), was tested first using two simulated models with feature dimensions relevant to EEG activities. We then used the method for assessing event-related directed information flow from flash-evoked EEG responses in neonatal EEG. For testing statistical significance of the findings, we used a significance-level threshold that was derived from a baseline period in the same EEG activity. The results suggest that the gOPDC method i) is able to remove common components akin to volume conduction effects in the scalp EEG, ii) handles the potential challenge with different amplitude scaling within multichannel signals and iii) can detect directed frequencyrelated information flow within a sub-second time scale in nonstationary multichannel EEG datasets. This method holds promise for estimating directed interactions between scalprecorded EEG signals that are commonly challenged by the confounding volume conduction effect of mutual sources. Index Terms—brain networks, connectivity analysis, directed coherence, electroencephalography, mvar modeling, volume conduction
I. INTRODUCTION
T
he human brain performs its sensory and cognitive functions by dynamically employing highly complex and interlaced neuronal networks. Better understanding of these network functions may open insights into pathophysiological mechanisms of neurological development and disease [1]. Due to its non-invasive nature, high temporal resolution and low A. Omidvarnia (corresponding author,
[email protected]), G. Azemi (
[email protected]), B. Boashash (
[email protected]) and P.B. Colditz (
[email protected]) are with the Centre for Clinical Research, The University of Queensland, Brisbane, Australia. J.M. O' Toole (
[email protected]) is with the Neonatal Brain Research Group, University College Cork, Cork, Ireland. S. Vanhatalo is with the Department of Clinical Neurophysiology, Helsinki University Hospital, Helsinki, Finland. G. Azemi is also with the Department of Electrical Engineering, Razi University, Kermanshash, Iran. B. Boashash is also with Qatar University College of Engineering, Doha, Qatar.
cost, scalp EEG is often used as the basis for studying brain connectivity [2-8]. Several methods have been developed for assessing directed interactions from EEG (or MEG) signals (reviewed in [9]). Among these, multivariate autoregressive (MVAR) models have been widely used for neurophysiological signal analysis [5, 6, 10-12]. An MVAR process is able to model interactions between EEG channels in the form of linear difference equations and allows the direction of information flow between channels including direct and indirect influences [12]. The concept of Granger causality [13], is widely used to investigate the flow of information within the coupled dynamical networks based on MVAR models. A dynamical process X is said to Grangercause a dynamical process Y, if the prediction of the process Y is enhanced using the information of the past of process X compared to the knowledge of the past of process Y alone [6]. This definition incorporates the lagged effects only from one channel to another, hence it is also denoted as lagged causality [6]. The immediate effect of a channel on the other channels at the zero delay is called instantaneous causality [6]. The combination of the concepts of lagged and instantaneous causality leads to the general form of extended causality [6]. In this paradigm, the classical MVAR models accounting only for the lagged causality are called strictly-causal MVAR models, while the models also considering the zero-lag effects are denoted as extended MVAR models [6]. The instantaneous effects built in the strictly-causal MVAR models are reflected in the non-diagonal elements of their noise covariance matrix. Therefore, they can be converted into the extended models using the Cholesky decomposition of their uncorrelated noise covariance matrix [6]. Strictly-causal and extended MVAR models provide the basis for several measures of directional influence in multivariate systems, such as Granger Causality Index (GCI) [14], Directed Coherence [15], Partial Directed, Multiple Coherence [16], Coherence (PDC) [15], extended PDC (ePDC) [6], generalized PDC (gPDC) [17], Directed Transfer Function [18] [16], and direct DTF (dDTF) [19] which have been validated using simulated models [6, 12, 15, 20, 21]. Ordinary coherence quantifies the linear relationship between two signals in the frequency domain. In a multichannel dataset, the linear relationship between two channels in absence of all other channels is measured by the partial coherence function. In fact, the function removes linear influences from all other
Copyright (c) 2013 IEEE. Personal use is permitted. For any other purposes, permission must be obtained from the IEEE by emailing
[email protected].
OMIDVARNIA ET AL, MEASURING TIME-VARYING INFORMATION FLOW FOR SCALP EEG SIGNALS: ORTHOGONALIZED PARTIAL DIRECTED COHERENCE
channels in order to detect direct interaction between channels i and j [15]. Multiple coherence describes the proportion of the power of the i’th channel at a certain frequency which is explained by the influences of all other channels [16]. These coherence measures provide a symmetric representation of the relations between channels, namely, the extracted interrelationship matrix is always symmetrical. Directed coherence is defined as a unique decomposition of the ordinary coherence function and represents the directed interaction between channels. This measure is obtained by spectral decomposition of the cross-spectral density matrix and channel-wise normalization of each element in the matrix [15]. Although the directed coherence has a straightforward physical interpretation in terms of signal power transferred from one process to another, it cannot distinguish between direct and indirect causal effects within the channels. DTF and PDC account for the activity flow in a given direction as a function of frequency/time-frequency. In particular, the PDC inherits useful characteristics of both directed coherence and partial coherence at the same time. While the DTF shows all direct and cascade flows together (e.g. both propagations 1→2→3 and propagation 1→3 are reflected in it), dDTF [19] can separate direct flows from indirect flows [9, 10]. The two frequency domain approaches to connectivity analysis (PDC vs. DTF) are designed to assess different properties in the signal with each having its own advantages and disadvantages [8, 12, 15, 20, 22]. The measure gPDC [17] combines the idea of DTF (to show the influencing effects) and PDC (to reflect influenced effects) between channel i and channel j. Also, GCI [14, 20] is a time-domain connectivity measure based on the concept of Granger causality. The original versions of the previously discussed measures assume that the underlying signals are stationary and their interactions are constant over time, which has made their use challenging for EEG - a known time-varying (non-stationary) signal [23, 24]. This has prompted the development of time-varying MVAR-based connectivity measures for EEG signal processing [7, 12, 21]. A further significant challenge in connectivity analysis of scalp EEG (or sensor space MEG) is the effect of volume conduction where a given brain source is often reflected in several EEG/MEG signals, and consequently, their similarity may be falsely perceived as ‘connectivity’ by the analysis paradigms [25]. This is particularly problematic with the MVAR-based connectivity measures that are sensitive to volume conduction effects (for example, see page 94 in ref [26]). A potential solution is to perform the EEG/MEG connectivity analysis at the source level [27], although this would require sufficiently reliable source localization [28]. An intriguing idea for an alternative solution was provided by a recent study that mitigated the effect of volume conduction in the analysis of spatial EEG amplitude correlations [29] by orthogonalizing signal powers. A well-known related procedure is use of the imaginary part of the (ordinary) coherence function [25], which renders the estimate insensitive to instantaneous effects between two signals. In the present paper, we combine the idea of the dual extended Kalman filter (DEKF)-based time-varying PDC analysis [11],
orthogonalization and imaginary part of coherence function leading to an orthogonalized version of the classical PDC, which we hereafter call orthogonalized PDC (OPDC). We propose here that combining orthogonalization and the imaginary part of coherence has the potential to reduce spurious co-variability, the common result of volume conduction effects. Moreover, we develop its generalized version (called gOPDC) to handle the numerical problem associated with potentially different variance of signal amplitudes (known as ‘time-series scaling [17]). The novel OPDC paradigm is compared with the classical PDC and gPDC, first using simulated time-invariant and time-varying models, and then using task-related EEG data obtained from flash light-evoked EEG responses of newborn babies. Finally, we will apply stringent statistical testing to assess significances of individual findings, and the time-frequency (T-F) connectivity maps are subsequently visualized in 3D directed graphs of the baby’s head to demonstrate the potential power of the proposed method in studying dynamical brain networks. II. METHODS A. Multivariate Autoregressive model For a given time series with number of samples ( ), a strictly-causal multivariate autoregressive (MVAR) model of order p is defined as [30]: (1) where is a normally distributed real valued zero-mean white noise vector with diagonal covariance matrix where is the expected value operator and denotes the number of channels. The assumption of diagonality for ensures that there is no instantaneous effect within the MVAR model described in (1), as there is no non-diagonal element in [6]. The matrices Ar are given by: (2) for r = 1, …, p. The real valued parameter reflects the linear relationship between channel k and channel l at the delay . In the stationary case, the optimum order p of an MVAR model can be estimated using different methods such as Akaike Information Criterion (AIC) and Schwarz’s Bayesian Criterion (SBC) [8, 31].SBC has been shown to be preferable over AIC for time series analysis [32]. For a reliable estimation of the MVAR parameters, the number of data points available ( ) need to be significantly larger than the number of parameters ( ) or equivalently, the signal length ( ) should be much longer than [30]. B. Time-varying PDC Measure Partial and directed relationships in a network can be detected using the PDC measure. As an example, suppose channel 1
OMIDVARNIA ET AL, MEASURING TIME-VARYING INFORMATION FLOW FOR SCALP EEG SIGNALS: ORTHOGONALIZED PARTIAL DIRECTED COHERENCE
affects channel 2 and channel 2 affects channel 3, that is. 2←1, 3←2 where the arrows show the direction of the information flow. In this case, channel 1 has a direct relationship with channel 2, while there is an indirect (partial) relationship between channel 1 and channel 3. It has been shown in previous studies that the PDC measure outperforms its MVAR-based counterparts for connectivity analysis because it misses this partial relation [15, 20, 22]. The PDC measure is based on the concept of Granger causality [15]. The time-varying version of the PDC is defined based on the time-varying version of the model given in (1) (in which matrices are time-varying) as [21]: (3) where
is the ’th column of
defined as: (4)
where is the identity matrix and the frequency varies within the range of 0 to the Nyquist rate. In (3), is the ’th element of , denotes the Hermitian transpose of the vector and represents the absolute value operator. The measure takes values between 0 and 1 where high values in a certain T-F bin reflects a directionally linear influence from channel to channel at that bin ( ). Note that the measure is directional, i.e., is not equal to necessarily. The scale invariance version of the classical PDC (called generalized PDC or gPDC) is obtained by incorporating the variances of the innovation processes [6, 17]:
signal via volume conduction. To reduce the co-variability due to spatial smearing of the surface EEG signals, one can orthogonalize their power envelopes in the complex domain to remove the parallel components and extract the orthogonal parts [29]. The orthogonal components are then used in the connectivity analysis. Note that two signals can be orthogonal and still correlated [34]. The power envelope of a random signal represents the temporal evolution of its spectral power and can be derived using Morlet’s wavelets [29] or the Hilbert transform [35]. Parametric or non-parametric (FFT-based) methods are also used to explore the frequency content of the signal. It is known, however, that the FFT-based methods inherit performance limitations of the FFT approach. Namely, they are unable to provide high-frequency resolution and also suffer from the spectral leakage caused by the effect of windowing on the signal. Autoregressive (AR) model-based spectral estimation methods can overcome these limitations by fitting the observations to an AR model. These methods can be extended to multivariate signals using (1) leading to the power spectral density (PSD) matrix. Therefore, the MVAR model coefficients in (1) and (4) reflect the interactions within the channels and at the same time, they represent the spectral information of the signal power envelopes. The main idea behind the OPDC and gOPDC measures is that instead of performing the orthogonalization process at the signal level, it can be done at the level of MVAR coefficients to alleviate the effect of mutual sources [36]. Suppose scalp EEG channels are generated through a linear superposition of independent source signals within the brain with instantaneous effect on the surface electrodes. This relationship can therefore be formulated in the frequency domain using Fourier transform as follows:
(5) where are the diagonal elements of The null hypothesis in the statistical significance test of the PDC-based connectivity analysis is then stated as: (6) where is either or . Rejection of implies a significant partial directed outflow of information from channel to channel [17]. C. Time-varying orthogonalized PDC for reducing the effect of volume conduction The cortical electrical activity recorded by a scalp electrode is a space-averaged potential that is often considerably affected by spatial smearing in the tissue layers between cortex and scalp [33]. This process, known as volume conduction, leads to co-variability in the EEG signal amplitude that is not due to true connectivity between underlying cortical activities. This effect needs attention in the pre-processing stage in any EEG connectivity analysis to differentiate presumably genuine brain interactions from those caused by smearing of EEG
(7) Equation (7) can be re-written in its matrix form: (8) where is the multichannel EEG signal in the frequency domain, is the multivariate source signal in the frequency domain, and includes all source weights: .
(9)
Note that zero lag between the source signals and the sensor realizations ensures that the matrix is real-valued. Assuming independence among sources, that is with denoting the Kronecker delta, the crossspectral density function between and , i.e. : (10) is necessarily real-valued [25]. Now, let us fit a strictly-causal MVAR model on the multichannel EEG signal in the
OMIDVARNIA ET AL, MEASURING TIME-VARYING INFORMATION FLOW FOR SCALP EEG SIGNALS: ORTHOGONALIZED PARTIAL DIRECTED COHERENCE
time domain according to (1) and transform it into the frequency domain. We have: (21)
(11) where (12)
(13) Combining (8) and (11), we have: (14) Then, the cross-spectral density matrix of can be computed as:
, namely
Thus the orthogonalized components of at different delays, i.e. the real part and the imaginary part play a salient role in estimating the true relations between channels, when the effect of mutual sources has been excluded. In fact, the orthogonalized components at different delays do not share the trivial co-variability caused by linear superposition of independent sources. Based on this rationale, we propose the orthogonalized version of the classical time-varying PDC (called OPDC) as a combination of the orthogonal components of the MVAR coefficients in the time-frequency domain given by:
(15) (22) where the superscript denotes the Hermitian operator. Assuming the source signals and noise processes are statistically independent, (15) is written as: (16) Therefore, in (10) can be obtained based on (16) as:
(17)
Since
and
(23) Summation of the weighted sine and cosine terms in (22) imposes a trend varying appearance to the OPDC measure along the frequency axis. It is straightforward to show that (22) and (23) are equivalent with the following decomposition of in (3):
are independent, all terms including are zero resulting in: (18)
True interaction between channels, independent from the pure effect of mutual sources (that is, relations in which the effect of mutual independent sources has been excluded) is reflected in the imaginary part of . Since and are necessarily real-valued, will be written as:
Therefore, the terms are associated with the true interactions between channels devoid of the effect of mutual sources and given by: (20)
(24) Since each factor in (24) is greater than zero and less than , the measure will always take values between zero and 1. In analogy to the definition of gPDC, the OPDC can be extended to the gOPDC by taking the effect of time series scaling into consideration:
(25)
In the next sections, we evaluate the proposed measures on two simulated models consisting of a time-invariant as well as (19) a time-varying strictly-causal MVAR model affected by a linear superposition of independent sources.
III. TESTING THE OPDC PARADIGM To evaluate the performance of the OPDC and gOPDC measures against the performance of the classical PDC and gPDC, two independent simulations were conducted covering both time-invariant and time-varying circumstances. The basic form of the time-invariant model was used in [15] to reflect
OMIDVARNIA ET AL, MEASURING TIME-VARYING INFORMATION FLOW FOR SCALP EEG SIGNALS: ORTHOGONALIZED PARTIAL DIRECTED COHERENCE
the superiority of the PDC to the DTF. Also, the time-varying one has been previously used in [21] to extract time-variant directed influences during Parkinsonian tremor. The models were then manipulated by adding random interactions between channels to test the integrity of our connectivity analysis framework. A. Time-invariant simulated model The model is a 5-dimensional time-invariant strictly-causal MVAR[37]-process plus a linear superposition of sparse uniformly distributed random sources with approximately 50% nonzero entries within the interval [0 3], given by:
(28) where is a normally distributed white noise vector. For a model of length samples and the sampling frequency , parameters and are depicted in Fig. 1. For MVAR parameter estimation, the model order is fixed to 2 throughout the process.
(26) where is a strictly-causal MVAR model of order 3 with 5 channels and is its distorted version with some confounding instantaneous interferences between channels defined by , a time-constant random mixing matrix and , the intermittent interactions between channels given as a 6-channel sparse uniformly distributed random matrix with 50% nonzero entries. The matrix is a weighting matrix whose element in the position represents the random interaction between the and component of . In fact, we have assumed that six sparse and instantaneous relationships are being imposed randomly on . The distorted matrix is finally used for connectivity analysis. The elements of were selected from the interval [0, 1] through a uniformly distributed pseudorandom generator. The MVAR process is expressed as (see also [15]):
Fig. 1: Time course of the time-varying parameters in the simulated model (see also [21]).
C. Newborn EEG data We used 20-channel EEG recordings of four full-term newborns obtained from EEG archives in the Department of Children’s Clinical Neurophysiology (Helsinki University Central Hospital, Finland). The signals were recorded during sleep with sampling rate of 256 Hz using a NicoOne EEG amplifier (Cardinal Healthcare, USA) and EEG caps (sintered Ag/AgCl electrodes; Waveguard, ANT-Neuro, Germany) with positioning according to the international 10-20 standard (see [38] and http://www.nemo-europe.com/en/educationaltools.php for further details of the newborn EEG recording (27) method). To capture connectivity in the brain network associated with visual processing (., postcentral) driven by the visual stimuli, we selected ten monopolar channels (Cz as the reference - see also Fig. 7) divided into two groups left (O1,C3,P3,T3,T5) and right where is a normally distributed representing (O2,C4,P4,T4,T6) hemispheres. The analysis of functional white noise vector with different variances for its entries. The model is simulated for samples at the sampling connectivity was then performed on each hemisphere (group) separately. Visual stimuli were delivered with the routine flash frequency . stimulator of the NicOne EEG system at 1Hz for 5 minutes (thus a total of 300 times). The continuous multichannel EEG B. Time-varying simulated model recordings were then segmented into one-second nonThe model is a 3-dimensional time-varying strictly-causal overlapping epochs each of which included one of the 1Hz MVAR[37]-process plus a linear superposition of sparse visual stimuli. Use of these anonymized EEG recordings has uniformly distributed random sources with approximately approval from the Ethics Committee of the Hospital of 50% nonzero entries within the interval [0 1], given by (26) Children and Adolescents, Helsinki University Central Hospital. where is a time-constant mixing matrix and represents the intermittent interactions between channels. D. Pre-processing prior to the OPDC analysis Similar to the time-invariant case, the elements of were The following sequence of pre-processing was applied on selected from the interval [0, 1]. The MVAR process the continuous raw EEG data using EEGLAB functions [39]: is denoted as (see also [21]): independent component analysis (ICA) was used to remove
OMIDVARNIA ET AL, MEASURING TIME-VARYING INFORMATION FLOW FOR SCALP EEG SIGNALS: ORTHOGONALIZED PARTIAL DIRECTED COHERENCE
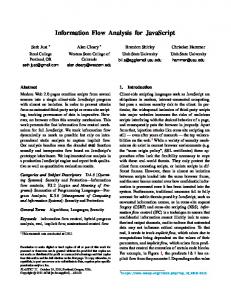
ECG artefact, mains noise (50Hz) as well as potential artefacts introduced by the flash stimulator directly to the EEG electronics. All 20 EEG electrodes were used at this stage to maximize the reliability of ICA operation [37]. The signal was band-pass filtered between 0.1Hz and 30Hz (using a Finite Impulse Response -FIR- filter of order 200). Periods of the EEG with exceedingly high artefacts were then visually identified, marked manually, and excluded from the later analysis. The remaining epochs were submitted for further analysis (212±28.6 average number of epochs per hemisphere). E. Statistical testing of EEG responses In order to evaluate the significance of our tv-gOPDC results, we employed statistical hypothesis testing for each individual pair-wise connection within a multichannel EEG dataset using a null distribution that we generated from the signal itself. The null hypothesis is stated as statistical similarity between the baseline condition and post-stimulus activation. In other words, we tested whether the gOPDC measure after flash light stimulation is statistically different from the gOPDC measure without brain activity triggered by the flash. This approach acknowledged the idea that brain areas may interact spontaneously in the absence of external stimulation leading random connectivity between EEG channels. Hence, the statistically significant event-related information flow can be estimated by comparing it to the level of interactions that take place between those same electrodes in the absence of stimulation. Studies on event related oscillatory activity often use ‘baseline’ subtraction at the trial level [40]. Fig. 7-a illustrates an example of the clear difference between the baseline (last 400 ms after flash light stimulation) and stimulus-induced components (first 400 ms interval) in a newborn visual evoked potential (VEP) signal. However, we searched for additional statistical power and analytical stability by generating a null distribution from a larger set of baseline epochs. The statistical approach usedis conceptually straightforward and computationally efficient compared to the sample shuffling, that in our multivariate dataset needed up to 10 hours computation time per baby (using a Windows-based PC of 2.66 GHz Core2 Duo CPU with 8 GB of RAM). To this end, we constructed the null distribution using the last 400ms interval of the one-second inter-stimulus EEG epochs, which was found to be beyond all obvious components of visual evoked potentials (see also Fig. 7-a), hence considered as the ‘baseline’ (typical EEG activity known as “background”). The tv-gOPDC measures were extracted from the first 400ms of each epoch and compared with a distribution of the same measures extracted from the last 400ms intervals for all epochs. The procedure of obtaining a T-F thresholding plane for each group (either left or right hemisphere) of each subject is as follows: 1. tv-gOPDC measures are extracted from the whole length (one second) of each epoch. If is the number of epochs for subject i obtained from either right or left hemisphere, time-frequency representations of the gOPDC measures
are obtained at the end of this step. Each time-frequency representation is divided into two parts: the first one covering the beginning 400ms interval and the second one covering the last 400ms interval. First intervals over epochs provide the original estimates and the second intervals build the null distribution’s library. 3. The highest score at the 99th percentile of the distribution of each T-F bin over epochs is computed. With our resolution (3.9 ms × 0.5 Hz), this yields a threshold plane (or matrix) with 102 time bins (0.4 s, Hz) and 60 frequency bins ( Hz), thus altogether 6120 threshold values in the thresholding plane that covers the whole T-F graph. Fig. 2 illustrates the above procedure for constructing the thresholding plane that determines significance level of the TF bins in the gOPDC graph. The statistical testing procedure was applied on the pre-processed data of each subject at each group (hemisphere) to obtain a subject-dependent thresholding plane. To find the T-F bins with significant values over the first 400ms time interval, a T-F threshold was applied to each epoch Average of the thresholded gOPDC plots was computed as the mean connectivity representation of the subject in the under-investigated hemisphere (see Fig. 2). At the end, each subject had two average multichannel representations, one for each hemisphere. 2.
F. Implementation of the DEKF-based OPDC measure for the EEG signals In this paper, the coefficients in (4) are estimated using the dual extended Kalman filter (DEKF) [41]. Time dependent parameters account for the nonstationary behavior of the signals. The DEKF is employed to estimate time-varying MVAR parameters fitted on the multichannel EEG signals. It leads to a time resolved gOPDC measure quantifying the time-varying directed influences within channels in the time-frequency (T-F) plane. The resulting DEKF-based T-F plane is constructed on a sample-by-sample basis. Therefore, the time resolution is defined by the sampling step size and the frequency resolution is determined by the number of frequency bins in the gOPDC measure (here, Hz leading to 3.9 ms steps and leading to 0.5 Hz spectral steps). The MVAR model order determines the frequency resolution of the estimates: low-order MVAR models cannot capture low-frequency components due to their short memory [42]. On the other hand, high-order MVAR models are able to represent rapid changes in the signal, but reliable estimation of their numerous parameters needs lengthy signals. If the signal is known to be stationary (which is not generally true for EEG), the optimum order p can be estimated using different methods such as the Akaike information criterion (AIC) or the Schwarz’s Bayesian criterion (SBC) [31]. The model order selection is not straightforward for time-varying MVAR models, as it may vary over time. In this study, the optimal model order is estimated by evaluating the SBC for a range of p values over the entire data using the ARFIT toolbox [31] and is kept constant during the process.
OMIDVARNIA ET AL, MEASURING TIME-VARYING INFORMATION FLOW FOR SCALP EEG SIGNALS: ORTHOGONALIZED PARTIAL DIRECTED COHERENCE
Since the MVAR parameters needed to be inferred from a short EEG segment in this study (one second), the order of the model was kept as low as possible (p=5). The whole procedure of extracting the tv-gOPDC values from the multichannel newborn EEG datasets is depicted in Fig. 2. The two
(a)
hemispheres were analyzed as separate groups of electrodes, and quantitative 3-D maps of directed influences were plotted using customized MATLAB functions of eConnectome toolbox [43].
(b)
Fig. 2: a) The block diagram of implementing the DEKF-based gOPDC measure and the null distribution from N multichannel epochs of the newborn VEP responses. The thresholding plane in the last stage will be used to determine the significant values of the OPDC measures in the T-F domain. b) The procedure of constructing the thresholding plane for the tv-gOPDC measures. Each white square represents a tv-gOPDC representation associated with the last 400 ms of an epoch. The histogram of each T-F bin (small black squares) over all epochs of a group is obtained and its highest score at the 99th percentile is extracted. The estimated value is then used as the threshold of that T-F bin in the thresholding plane.
IV. RESULTS Our comparison between different methodologies is based on visual inspection (Figs 4 and 5) analogous to the original PDC study [15], and we found this sufficiently revealing to conclude that there were considerable differences between methods. However, a quantitative measure with statistical testing was used for an objective comparison of the EEG results in which the average tv-gOPDC values over predefined T-F planes were computed (see Fig. 7). A. Time-invariant simulation The corresponding PDC, gPDC, OPDC and gOPDC measures for the time-invariant model given by (26) and (27) are plotted in a matrix layout in Fig. 3. In the ideal case, we expect to see the immediate impact of channel 1 to channels 2, 3 and 4 as well as the reciprocal effect between channels 4 and 5 (that is, non-zero values for , , ,
and , while the other flows are zero). Because of the effect of mutual sources, the classical PDC (Fig. 3 -a) shows an erroneous reflection of the true connections (considerable effect of channel 1 on the other channels) in addition to the spurious leakages among some other channel pairs. The distinctive role of channel 1 in contrast to the other channels refers to its large noise variance. This problem is tackled to some extent by the gPDC (Fig. 3-b), although leakage due to the effect of mutual sources still exists. The OPDC measure (Fig. 3-c) alleviates the leakage problem, but is not able to confrontthe issue of different amplitude scaling. Namely, considerable non-zero values due to the large noise variance of channel 1 are observed for and in Fig. 3-c. The gOPDC measure (Fig. 3-d) takes both the issue of time series scaling and information leakage into consideration and provides the most desired presentation of the information flows.
OMIDVARNIA ET AL, MEASURING TIME-VARYING INFORMATION FLOW FOR SCALP EEG SIGNALS: ORTHOGONALIZED PARTIAL DIRECTED COHERENCE
(a)
(b)
(c)
(d)
Fig. 3: Diagrams of the mutual influences within the multichannel time-invariant model given by (26) and (27): a) PDC, b) gPDC, c) OPDC and d) gOPDC. The diagonal plots (effect of each channel on itself) are excluded from the matrix layouts.
B. Time-varying simulation Comparison of the tv-gOPDC measures to tv-gPDC measures on the time-varying simulated model described in (26) and (28) demonstrates that gOPDC can effectively remove the intermittent interactions between variables (Fig. 4). In this study, the optimal model order was estimated by evaluating the SBC for a range of p values over the entire data using the ARFIT toolbox [31] and kept constant during the process for all simulations as well as EEG signal analysis. Both measures are able to successfully reflect the oscillatory partial connectivity from channel 2 to channel 1 ( , ) as well as the ramp-shaped strength influence from channel 3 to channel 1 ( , ) (see Fig. 4).
According to the model, there is no direct coupling from to and , from to , and also from to . This is reflected well in the corresponding gOPDC graphs with negligible activity. However, the corresponding gPDC graphs for , , and represent high false positive values. Another large difference can also be observed: the residual connectivity values after removing the effect of mutual sources reveal much smaller magnitude than the gPDC values (note the colour bars in Fig. 4). This observation originates directly from the orthogonalization step in the gOPDC measure where the spurious connectivity caused by the mutual sources is attenuated.
OMIDVARNIA ET AL, MEASURING TIME-VARYING INFORMATION FLOW FOR SCALP EEG SIGNALS: ORTHOGONALIZED PARTIAL DIRECTED COHERENCE
(a)
(b)
Fig. 4. The connectivity measures extracted from the simulated model. a) time-varying gPDC, b) time-varying gOPDC. The diagonal plots (effect of each channel on itself) have been excluded from the matrix layouts.
C. Newborn EEG data Because the MVAR parameters need to be inferred from a short EEG segment(one second), the order of the model should be kept as low as possible ( ). Many coefficients of a high-order MVAR model cannot be reliably estimated from a short length signal. Therefore, we were conservative in selecting the optimum model order and selected the lowest order at which a near constant plateau appears in the information criterion diagram of the SBC method. On the other hand, low-order MVAR models cannot capture lowfrequency components, as they have short memory [42]. Therefore, we exclude low-frequency results of this study (below 1-2 Hz) from our interpretations.
(a)
To make sure that the EEG results are not substantially affected by different amplitude scaling in scalp EEG electrodes (see Fig. 7-a), the gOPDC was used for EEG connectivity analysis and its performance was compared with the gPDC. The time-varying results (Fig. 5) were obtained for the scalp EEG electrodes of the left hemisphere after thresholding as described above. As shown in Fig. 5, the gPDC levels are notably high and spread across the whole T-F plane with emphasis on low frequency components, whereas gOPDC levels are clearly emphasized around 10 Hz. In particular, the low frequency content (lower than 3 Hz) associated with the mutual components of the newborn EEG signals have been almost eliminated in the gOPDC plots.
(b)
Fig. 5: Time-varying connectivity analysis of the scalp EEG electrodes from the left hemisphere. A) gPDC measure, b) gOPDC measure.
The time-invariant measures (Fig. 6) can be readily obtained by temporal averaging of the corresponding timevarying values (Fig. 5). They show a clearly dominant hump at around 7-10 Hz. In contrast, the gPDC plots show strikingly high levels towards both higher and lower frequency
components. We find it plausible to assume that these frequency components represent mainly the “common mode” effect of reference electrode that is unavoidably present in monopolar recordings, which is effectively attenuated by orthogonalization at the level of MVAR parameters.
OMIDVARNIA ET AL, MEASURING TIME-VARYING INFORMATION FLOW FOR SCALP EEG SIGNALS: ORTHOGONALIZED PARTIAL DIRECTED COHERENCE
(a)
(b)
Fig. 6: Time-invariant connectivity analysis of the scalp EEG electrodes from the left hemisphere. A) gPDC measure, b) gOPDC measure.
The conventional time-locked averaging of the EEG showed canonical shape visual evoked responses in both hemispheres and in all babies (Fig. 7) with little difference in timing and shape of components between scalp locations. The first components always started before 200ms, and no consistent response components were seen beyond 400ms post stimulus. Notably, all components of this response have a strong spatial decay towards central (C3 and C4) and temporal (T3 and T4) sites, with maximal amplitude in the occipital electrodes (O1 and O2). Based on these observations, we
(a)
(d)
limited our tv-gOPDC analysis to a rectangular timefrequency area from 100ms post stimulus onwards and within the frequency range of 5-15 Hz (Fig. 7-d). Grand-mean T-F maps of directional interactions between EEG channels at each hemisphere over subjects are demonstrated in Fig. 7-b and c. The 3-D connectivity maps of the grand mean interactions at 5-15Hz band were then created from 2-D averaging of the T-F gOPDC values within three different time spans: =100-200 ms, =200-300 ms and =300400 ms (see Fig. 7-e, f and g, respectively).
(b)
(e)
(c)
(f)
(g)
Fig. 7: a) Average VEPs of a typical subject - responses of the right group of electrodes, b,c) Average tv-gOPDC measures across four subjects for the occipital-temporal-parietal areas from 100 ms to 400 ms post-stimulus at the left and right hemispheres, respectively. The direction of the information flow is presented on top of each map. d) Rectangular T-F compartments over which the gOPDC measure was averaged. e,f,g) Color-coded 3-D directed graphs representing the grand-mean information flow at =100-200 ms, =200-300 ms and =300-400 ms, respectively, after the stimulus onset within the frequency range of 5-15 Hz. Note the substantial decrease of information flow in the last time window compared to the first two time windows. Each color-coded arrow shows a directed interaction between two electrodes.
OMIDVARNIA ET AL, MEASURING TIME-VARYING INFORMATION FLOW FOR SCALP EEG SIGNALS: ORTHOGONALIZED PARTIAL DIRECTED COHERENCE
An overall inspection of the results in Fig. 7-b,c suggests that there are preferential frequencies and directions of information flow in the T-F domain. To quantify the visual interpretation of the results, the total mean gOPDC value was calculated for each plot. The pair-wise gOPDC maps, i.e. two maps for each electrode pair (one for each direction) can be interpreted as the pure directional ‘coherence spectrogram’ between the two electrodes, when the effect of volume conduction is removed. Notably, most directed information flow appears to take place at 5-15Hz frequency band, with a general decrease in frequency over time. This change in frequency is, indeed, compatible with the respective changes in the intrinsic frequency content of the average waveforms (Fig. 7-a) which show a clear attenuation of interactions towards the end of the 400ms analysis window. The grand mean gOPDC maps (Fig. 7-b,c) reveal strong interrelations between the occipital and central areas at the left hemisphere and between the occipital and temporal areas at the right hemisphere around the central frequency of 10 Hz (most dominant interactions are O1←C3 and O2←T4). In both matrix layouts (left and right – 40 maps in total), the dominant electrode pairs involve the occipital and parietal electrodes as the sink of information (e.g. P3←T3, O2←T4, O1←C3). In addition, relatively high T-F interactions originate from the temporal lobe and discharge into the occipital and parietal lobes (e.g. P3←T5, P3←T3, O2←T4). The 3-D plots are compatible with the observations from the time-frequency gOPDC graphs in Fig. 7-b,c that show attenuation of the interactions in the network over time. In the earliest time window (100-200ms), most connections are active, whereas the interactions weaken towards the end of the analysis time. The 3-D maps also show the long connections from the occipital lobe to the central regions.
V.
DISCUSSION
Our work demonstrates that directional information flow can be assessed in the T-F domain from multivariate EEG datasets, and it can be statistically tested at the level of each individual connection. The method we describe here stems from combining multiple independent streams of prior analytical development: the core of the OPDC measure and its generalized version is grounded on the T-F representation of MVAR processes and the notion of Granger causality. To render the estimate insensitive to instantaneous effects between two scalp EEG signals, the well-known idea of taking the imaginary part of the coherence function has been used [25]. In our study, we combined the idea of time-varying PDC analysis [11] with orthogonalization at the level of MVAR parameters, as considering the imaginary part of the coherence function lead to an orthogonalized version of the classical PDC . Moreover, we developed its generalized version (called gOPDC) to handle the numerical problem associated with varying amplitude scaling between signals. The performance of the gOPDC measure was evaluated using a simulated model and real newborn EEG signals.
The major properties of the tv-gOPDC paradigm and their relationship with the previously published measures can be summarized as follows: A. The gOPDC approach is based on the strictly-causal MVAR model given in (1) which does not consider the instantaneous interactions between EEG channels. An extended MVAR model which takes into account the instantaneous effects will be similar to (1) with for [6]. In this case, the gOPDC measure given in (25) can be extended in a similar way as presented in [6] where the MVAR coefficients are modified in the presence of zero-lagged effects. However, it is shown in [6] that if a strictly-causal MVAR model is inaccurately fitted on an extended MVAR process, true instantaneous influences are likely to be reflected as spurious lagged interconnections among the model inputs. B. In contrast to ordinary coherence, partial coherence, multiple coherence and similar to the DTF, dDTF, PDC and gPDC, the proposed gOPDC method is able to extract direction of the information flow and differentiate between direct/indirect interactions. C. it inherits all characteristics of the classical PDC which makes it superior to the DTF and dDTF. D. as opposed to GCI, it can extract both temporal and spectral interactions. E. in comparison with the PDC and gPDC for the specific application of scalp EEG analysis, it is able to alleviate the distorting effect of volume conduction within multichannel EEG signals. One should note, however, that the inverse spectral matrix elements employed in the family of PDC-based measures makes physical interpretation of their results difficult in terms of power spectral density. We have demonstrated that tv-gOPDC using DEKF is able to track changes associated with transient couplings and remove the effect of mutual independent sources within the multivariate nonstationary signals. Most of the existing EEG connectivity analysis methods assume stationarity of interactions in the underlying signals, while EEG signals are well-known to be nonstationary [23, 24]. Also, the effect of volume conduction and the differences in amplitude scaling between EEG signals can pose challenges. Our present work introduces a time-frequency framework for functional EEG connectivity analysis to deal with both confounders, and extracts the sequence of nonstationary information flows between EEG channels within sub-second segments and at the lack of scale invariance. This approach obviously requires sufficient signal to noise ratio, which can be achieved by averaging over a larger number of trials. The effects of other sources of constant noise or artefacts, such as mains noise and its harmonics, can be mitigated by efficient artefact handling (see pre-processing steps) and by employing statistical testing of the kind presented in our work. The method of generating null distributions from the original EEG segments will directly affect the statistical testing. There are several customized versions of classical surrogate data methods to estimate significance in PDC connectivity analysis [44, 45]. Their
OMIDVARNIA ET AL, MEASURING TIME-VARYING INFORMATION FLOW FOR SCALP EEG SIGNALS: ORTHOGONALIZED PARTIAL DIRECTED COHERENCE
application to each epoch in a multivariate dataset (multichannel newborn EEG in our study) is, however, often computationally challenging, and we do not see specific advantages to their use compared to our conceptually straightforward method. As an alternative, the null distribution of our hypothesis testing (cortical connectivity vs. no connectivity) can be generated using the background EEG in the given experiment, which is also automatically “normalized” with respect to spontaneous (as opposed to event-related) brain connectivity as well as technical variances (for example. external noise or inter-individual variations in the recording constellation). The method presented in our paper is conceptually straightforward and computationally efficient. The effect of EEG montage is another important factor in studies on EEG connectivity. While we used monopolar montage with Cz reference in this study, other montages like Laplacian or average referencing should be explored. Use of monopolar reference outside of the analysed EEG signals may be perceived as neutral with respect to mixing sources among the analysed signals, however it also leads to a significant common source in all signals that is technically identical to a serious volume conduction effect. We found it particularly encouraging to see that even such common source component could be alleviated by using the orthogonalization procedure. Using Laplacian or average reference montages would require a high number of recorded EEG channels. Hence, it seems intriguing that our method may even open the possibility to analyze recordings with only few monopolar EEG signals, such as the routine clinical evoked potential studies. However, any effect of the number of electrodes also affects tv-gOPDC measures, and it needs systematic assessment in prospective applications for two reasons: first, higher electrode density implies increased mutual components caused by volume conduction. Second, quantitation of directional interactions between higher number of pair-wise comparisons can dilute the effect between each electrode pair, which calls for higher signal-to-noise ratio. These considerations imply that i) increasing the electrode density may be beneficial when it is used for spatial down-sampling (either at signal or at source space), while ii) the performance of tv-gOPDC improves by selecting a lower number of signal pairs as guided by a priori knowledge about assumed number of underlying, interacting sources. Indeed, such optimization is an inevitable exercise with all advanced analyses of brain interactions. The ability of the gOPDC in detecting interactions between sources within the cortex in the presence of volume conduction can be quantitatively measured using other simulated models like the one presented in [46] where the interactions at the source level are projected onto the scalp through a realistic lead field matrix. In the special case where source activities are governed by an MVAR process, a different version of (26) like x(n)=Vy(n) can be used for simulation purposes in which is the multichannel scalp EEG, represents the lead field matrix and models the lagged source time traces in the form of an MVAR process. The simulation strategy of this
study, however, was to look at the EEG connectivity problem from another perspective, namely fitting an MVAR model on the scalp EEG signals (not sources) in the presence of an additive interfering factor. The time-varying connectivity approach used in this paper discloses longer range connections from occipital to temporal and central regions, which is strikingly compatible with previous steady state VEP studies in adults [47, 48]. Our proposed analysis methodology as well as the stimulation paradigm (a routine flash light during routine clinical EEG recording) is directly applicable even for larger scale clinical testing. Notably, a directed information flow, often called ‘travelling waves’ in the adult literature [49] is considered to be sensitive to changes in sub-cortical structures [50]. In the clinical context, it raises the potential that our paradigm could be used to assess integrity of the sub-cortical structures after acute brain injury, such as birth asphyxia, where diagnostic strategies have remained a challenge [51, 52]. The present paradigm may have applicability to follow change over time in response to therapy and prognostication of long term outcome. ACKNOWLEDGMENT The authors gratefully acknowledge the support of Helsinki University Hospital for providing the newborn EEG datasets. Dr. Sampsa Vanhatalo was supported by the European Community's Seventh Framework Program European Community FP7-PEOPLE-2009-IOF, grant agreement No. 254235. This publication was supported by a grant from the Qatar National Research Fund under its National Priorities Research Program award number NPRP 09-465-2-174.
REFERENCES [1] B. J. Fisch, Fisch & Spehlmann's EEG primer: Basic principles of digital and analog EEG. Amsterdam: Elsevier, 2005. [2] S. I. Dimitriadis, N. A. Laskaris, A. Tzelepi, and G. Economou, "Analyzing Functional Brain Connectivity by Means of Commute Times: A New Approach and its Application to Track Event-Related Dynamics," IEEE Trans. Biomed. Eng., vol. 59, pp. 1302-1309, 2012. [3] S. Haufe, R. Tomioka, G. Nolte, Mu, x, K. R. ller, and M. Kawanabe, "Modeling Sparse Connectivity Between Underlying Brain Sources for EEG/MEG," IEEE Trans. Biomed. Eng., vol. 57, pp. 1954-1963, 2010. [4] H. Bin, Y. Lin, C. Wilke, and Y. Han, "Electrophysiological Imaging of Brain Activity and Connectivity—Challenges and Opportunities," IEEE Trans. Biomed. Eng., vol. 58, pp. 1918-1931, 2011. [5] L. Faes, S. Erla, and G. Nollo, "Measuring Connectivity in Linear Multivariate Processes: Definitions, Interpretation, and Practical Analysis," Comput. Math. Methods Med., vol. 2012, p. 18, 2012. [6] L. Faes and G. Nollo, "Extended causal modeling to assess Partial Directed Coherence in multiple time series with significant instantaneous interactions," Biol. Cybern., vol. 103, pp. 387-400, 2010/11/01/ 2010. [7] W. Hesse, E. Möller, M. Arnold, and B. Schack, "The use of time-variant EEG Granger causality for inspecting directed interdependencies of neural assemblies," J. Neurosci. Methods., vol. 124, pp. 27-44, 2003. [8] B. L. P. Cheung, R. Nowak, L. Hyong Chol, W. Drongelen, and B. D. Veen, "Cross Validation for Selection of Cortical Interaction Models From Scalp EEG or MEG," IEEE Trans. Biomed. Eng., vol. 59, pp. 504514, 2012. [9] K. Lehnertz, "Assessing directed interactions from neurophysiological signals-an overview," Physiol. Meas., vol. 32, p. 1715, 2011. [10] D. Marinazzo, W. Liao, H. Chen, and S. Stramaglia, "Nonlinear connectivity by Granger causality," Neuroimage., vol. 58, pp. 330-338, 2010.
OMIDVARNIA ET AL, MEASURING TIME-VARYING INFORMATION FLOW FOR SCALP EEG SIGNALS: ORTHOGONALIZED PARTIAL DIRECTED COHERENCE
[11] A. Omidvarnia, M. Mesbah, M. S. Khlif, J. M. O’Toole, P. Colditz, and B. Boashash, "Kalman filter-based time-varying cortical connectivity analysis of newborn EEG " presented at the the 33th Annual International Conference of the IEEE Engineering in Medicine and Biology Society Boston, MA, USA, 2011. [12] L. Astolfi, F. Cincotti, D. Mattia, F. De Vico, A. Tocci, A. Colosimo, S. Salinari, M. G. Marciani, W. Hesse, H. Witte, M. Ursino, M. Zavaglia, and F. Babiloni, "Tracking the Time-Varying Cortical Connectivity Patterns by Adaptive Multivariate Estimators," IEEE Trans. Biomed. Eng., vol. 55, pp. 902-913, 2008. [13] C. W. J. Granger, "Investigating Causal Relations by Econometric Models and Cross-spectral Methods," Econometrica., vol. 37, pp. 424438, 1969. [14] J. Geweke, "Measurement of Linear Dependence and Feedback Between Multiple Time Series," J. Am. Stat. Assoc. , vol. 77, pp. 304-313, 1982. [15] L. A. Baccalá and K. Sameshima, "Partial directed coherence: a new concept in neural structure determination," Biol. Cybern., vol. 84, pp. 463-474, 2001. [16] M. Kaminski and K. Blinowska, "A new method of the description of the information flow in the brain structures," Biol. Cybern., vol. 65, pp. 203210, 1991. [17] L. A. Baccalá and F. de Medicina, "Generalized Partial Directed Coherence," presented at the 15th International Conference on Digital Signal Processing, Cardiff, UK, 2007. [18] S. C. N. I. Kluetsch Rc and et al., "ALterations in default mode network connectivity during pain processing in borderline personality disorder," Archives of General Psychiatry, vol. 69, pp. 993-1002, 2012. [19] A. Korzeniewska, M. Manczak, M. Kaminski, K. J. Blinowska, and S. Kasicki, "Determination of information flow direction among brain structures by a modified directed transfer function (dDTF) method," J. Neurosci. Methods., vol. 125, pp. 195-207, 2003. [20] M. Winterhalder, B. Schelter, W. Hesse, K. Schwab, L. Leistritz, D. Klan, R. Bauer, J. Timmer, and H. Witte, "Comparison of linear signal processing techniques to infer directed interactions in multivariate neural systems," Signal Process., vol. 85, pp. 2137-2160, 2005. [21] L. Sommerlade, K. Henschel, J. Wohlmuth, M. Jachan, F. Amtage, B. Hellwig, C. H. Lücking, J. Timmer, and B. Schelter, "Time-variant estimation of directed influences during Parkinsonian tremor," J. Physiol. Paris., vol. 103, pp. 348-352, 2009. [22] A. Omidvarnia, M. Mesbah, J. M. O'Toole, P. Colditz, and B. Boashash, "Analysis of the time-varying cortical neural connectivity in the newborn EEG: A time-frequency approach," presented at the the 7th International Workshop on Systems, Signal Processing and their Applications, Algeria, 2011. [23] L. Rankine, N. Stevenson, M. Mesbah, and B. Boashash, "A Nonstationary Model of Newborn EEG," IEEE Trans. Biomed. Eng., vol. 54, pp. 19-28, 2007. [24] T. Chee-Ming, S. H. Salleh, Z. Z. Zainuddin, and A. Bahar, "Spectral Estimation of Nonstationary EEG Using Particle Filtering With Application to Event-Related Desynchronization (ERD)," IEEE Trans. Biomed. Eng., vol. 58, pp. 321-331, 2011. [25] G. Nolte, O. Bai, L. Wheaton, Z. Mari, S. Vorbach, and M. Hallett, "Identifying true brain interaction from EEG data using the imaginary part of coherency," Clin. Neurophysiol., vol. 115, pp. 2292-2307, 2004. [26] G. Gomez-Herrero, "Title," unpublished|. [27] M. J. Brookes, M. Woolrich, H. Luckhoo, D. Price, J. R. Hale, M. C. Stephenson, G. R. Barnes, S. M. Smith, and P. G. Morris, "Investigating the electrophysiological basis of resting state networks using magnetoencephalography," Proc. Natl. Acad. Sci. U S A., September 19, 2011 2011. [28] J. M. Palva, S. Monto, S. Kulashekhar, and S. Palva, "Neuronal synchrony reveals working memory networks and predicts individual memory capacity," Proc. Natl. Acad. Sci. U S A., vol. 107, pp. 75807585, 2010/04/20/ 2010. [29] J. F. Hipp, D. J. Hawellek, M. Corbetta, M. Siegel, and A. K. Engel, "Large-scale cortical correlation structure of spontaneous oscillatory activity," Nat. Neurosci., vol. 15, pp. 884-890, 2012. [30] H. Hytti, R. Takalo, and H. Ihalainen, "Tutorial on Multivariate Autoregressive Modelling," J. Clin. Monit. Comput. , vol. 20, pp. 101108, 2006. [31] A. Neumaier and T. Schneider, "Estimation of parameters and eigenmodes of multivariate autoregressive models," ACM Trans. Math. Softw., vol. 27, pp. 27-57, 2001.
[32] A. B. Koehler and E. S. Murphree, "A Comparison of the Akaike and Schwarz Criteria for Selecting Model Order," Appl. Statist., vol. 37, pp. 187-195, 1988. [33] P. L. Nunez and R. Srinivasan, Electric Fields of the Brain: The neurophysics of EEG. New York: Oxford University Press, 2006. [34] J. L. Rodgers, W. A. Nicewander, and L. Toothaker, "Linearly Independent, Orthogonal, and Uncorrelated Variables," The American Statistician, vol. 38, pp. 133-134, 1984/05/01 1984. [35] A. Tokariev, K. Palmu, A. Lano, M. Metsäranta, and S. Vanhatalo, "Phase synchrony in the early preterm EEG: Development of methods for estimating synchrony in both oscillations and events," Neuroimage., vol. 60, pp. 1562-1573, 2012. [36] A. Omidvarnia, G. Azemi, B. Boashash, J. O. Toole, P. Colditz, and S. Vanhatalo, "Orthogonalized Partial Directed Coherence for Functional Connectivity Analysis of Newborn EEG," in Neural Information Processing. vol. 7664, T. Huang, Z. Zeng, C. Li, and C. Leung, Eds., ed: Springer Berlin Heidelberg, 2012, pp. 683-691. [37] K. Mevel, Ch, #233, G. telat, #235, F. Eustache, B. Desgranges, #233, and atrice, "The Default Mode Network in Healthy Aging and Alzheimer's Disease," International Journal of Alzheimer's Disease, vol. 2011, 2011. [38] S. Stjerna, J. Voipio, M. Metsäranta, K. Kaila, and S. Vanhatalo, "Preterm EEG: A Multimodal Neurophysiological Protocol," J. Vis. Exp., 2012. [39] A. Delorme and S. Makeig, "EEGLAB: an open source toolbox for analysis of single-trial EEG dynamics," J. Neurosci. Methods., vol. 134, pp. 9-21, 2004. [40] S. Palva, K. Linkenkaer-Hansen, R. Näätänen, and J. M. Palva, "Early Neural Correlates of Conscious Somatosensory Perception," J. Neurosci. , vol. 25, pp. 5248-5258, May 25, 2005 2005. [41] E. A. Wan and A. T. Nelson, "Dual Extended Kalman Filter Methods," in Kalman Filtering and Neural Networks, ed: John Wiley & Sons, Inc., 2002, pp. 123-173. [42] J. Dauwels, K. Srinivasan, M. Ramasubba Reddy, T. Musha, F. Vialatte, B. ois, C. Latchoumane, J. Jeong, and A. Cichocki, "Slowing and Loss of Complexity in Alzheimer's EEG: Two Sides of the Same Coin?," Int. J. of Alzheimers Dis., vol. 2011, 2011. [43] B. He, Y. Dai, L. Astolfi, F. Babiloni, H. Yuan, and L. Yang, "eConnectome: A MATLAB toolbox for mapping and imaging of brain functional connectivity," J. Neurosci. Methods., vol. 195, pp. 261-269, 2011. [44] L. Faes, A. Porta, and G. Nollo, "Testing Frequency-Domain Causality in Multivariate Time Series," Biomedical Engineering, IEEE Transactions on, vol. 57, pp. 1897-1906, 2010. [45] D. Yasumasa Takahashi, L. Antonio Baccal, and K. Sameshima, "Connectivity Inference between Neural Structures via Partial Directed Coherence," Journal of Applied Statistics, vol. 34, pp. 1259-1273, 2007/12/01 2007. [46] S. Haufe, V. V. Nikulin, K.-R. Müller, and G. Nolte, "A critical assessment of connectivity measures for EEG data: A simulation study," NeuroImage, vol. 64, pp. 120-133, 1/1/ 2013. [47] Z. Yan and X. Gao, "Functional connectivity analysis of steady-state visual evoked potentials," Neurosci. Lett., vol. 499, pp. 199-203, 2011. [48] R. Srinivasan, E. Fornari, M. Knyazeva, R. Meuli, and P. Maeder, "fMRI responses in medial frontal cortex that depend on the temporal frequency of visual input," Exp. Brain. Res. , vol. 180, pp. 677-691, 2007. [49] G. R. Burkitt, R. B. Silberstein, P. J. Cadusch, and A. W. Wood, "Steadystate visual evoked potentials and travelling waves," Clin. Neurophysiol., vol. 111, pp. 246-258, 2000. [50] P. L. Nunez, "Implications of white matter correlates of EEG standing and traveling waves," Neuroimage., vol. 57, pp. 1293-1299, 2010. [51] M. Thoresen, L. Hellström-Westas, X. Liu, and L. S. de Vries, "Effect of Hypothermia on Amplitude-Integrated Electroencephalogram in Infants With Asphyxia," Pediatrics., vol. 126, pp. 131-139, 2010. [52] T. Kontio, M. C. Toet, L. Hellström-Westas, M. van Handel, F. Groenendaal, S. Stjerna, S. Vanhatalo, and L. S. de Vries, "Early neurophysiology and MRI in predicting neurological outcome at 9–10 years after birth asphyxia," Clin. Neurophysiol., 2013.
OMIDVARNIA ET AL, MEASURING TIME-VARYING INFORMATION FLOW FOR SCALP EEG SIGNALS: ORTHOGONALIZED PARTIAL DIRECTED COHERENCE
Amir Omidvarnia received his B.Sc. and M.Sc. degrees from the Amirkabir University of Technology, Tehran and the University of Tehran in 2002 and 2005, respectively, both in Biomedical Engineering. He is currently enrolled in a PhD degree in Biomedical Engineering at the University of Queensland, Centre for Clinical Research funded by a UQ International Postgraduate Research Scholarship. His research interests are medical signal processing and time-frequency analysis.
Ghasem Azemi received the Ph.D. degree in signal processing from Queensland University of Technology, Brisbane, Australia, in 2004, where he was then employed as a Research Fellow in timefrequency signal processing. He then joined the Department of Electrical Engineering at Razi University, Kermanshah, Iran, as an assistant professor. He is now with the University of Queensland, Center for Clinical Research, School of Medicine, Brisbane, Australia, as a Research Fellow. His research interests are biomedical and time-frequency signal processing.
Boualem Boashash (F’99) received the Baccalaureat degree in Grenoble, France, in 1973. He then received the Diplome d’ingenieur-Physique—Electronique from Lyon, France, in 1978, and the DEA (Masters degree) and the Doctorate from the University of Grenoble, in 1979 in May 1982, respectively. Between 1979 and 1982, he was also with Elf-Aquitaine Geophysical Research Centre, Pau, France, as a Research Engineer. In 1982, he joined the Institut National des Sciences Appliquees de Lyon, France, where he was an Assistant Professor. In January 1984, he joined the University of Queensland, Brisbane, Australia, as a Lecturer, Senior Lecturer (1986), and Reader (1989). In 1990, he joined Bond University, Graduate School of Science and Technology, as Professor of Signal Processing. In 1991, he was invited to join the Queensland University of Technology as the foundation Professor of Signal Processing, and then held several senior academic management positions. In 2006, he was invited by the University of Sharjah to be the Dean of Engineering and in 2009, he joined Qatar University as Associate Dean for Academic Affairs and then Research Professor while still an Adjunct Professor with the University of Queensland. He was instrumental in developing the field of time-frequency signal analysis and processing via his research work and by organizing the first international conference on the topic at ISSPA 90 and other scientific meetings. He developed the first software package for time-frequency signal analysis first. Current version is being released as freeware (downloadable from http://www.time-frequency.net). For more details, see his full CV available on request. He has published more than 500 technical publications, three research books, and five textbooks, more than 30 book chapters and supervised over 50 Ph.D. degree students. His work has been cited more than 8000 times (Google Scholar). Prof. Boashash is a Fellow of the IEEE “for pioneering contributions to time-frequency signal analysis and signal processing education.” He is also a Fellow of IE Australia and a Fellow of the IREE. He was the Technical Chairman of ICASSP 94 and played a leading role between 1985 and 1995 in the San Diego SPIE Conference on Signal Processing, establishing the original special sessions on time-frequency analysis. Since 1985, He has been the Founder and General Chairman of the International Symposium on Signal Processing and its Applications (ISSPA), and the International Workshop on Systems, Signal Processing and their Applications which are consecutively organized every two years.
John M. O' Toole received the B.E. (1997) and M.Eng.Sc. (2000) degrees from the University College Dublin, Ireland, and the Ph.D. (2009) degree from the University of Queensland, Australia. His Ph.D. thesis received the Dean's award for outstanding research in 2010. Prior to Ph.D. study, he worked in industry (2001--2003) as a consultant engineer in control systems and as a research assistant (2003--2005) at the Signal Processing Research Centre in the Queensland University of Technology, Australia. His postdoctoral research has included topics in signal processing and biomedical applications at the Centre for Clinical Research (2008--2010), University of Queensland, Australia; DeustoTech-eLIFE Group (2011--2013), University of Deusto, Spain; and the Neonatal Brain Research Group (from 2013), University College Cork, Ireland. Research interests include time-frequency signal analysis, discrete-time signal processing, efficient algorithm design, and biomedical signal analysis.
Paul B. Colditz is Professor of Perinatal Medicine at the University of Queensland. He received a Masters degree in Biomedical Engineering from the University of NSW and then a DPhil from Oxford University, studying brain circulation in the newborn. He has continued to undertake research involving the application of technology to clinical problems of the fetus and newborn, with the current focus being prevention of death and brain injury. He has key roles in paediatric research education (e.g. membership of the Executive of the Royal Australasian College of Physicians (Paediatrics and Child Health Division), medical philanthropy (e.g. Board member SIDS&KIDS Australia), international research (e.g. Scientific Committee member, EU FP7 grant ‘NEMO’), industry scientific roles and clinical practice.
Sampsa Vanhatalo received the Medical Degree from University of Helsinki, Finland in 1998. He is currently an Adjunct Professor in Clinical Neurophysiology in the University of Helsinki, as well as the head of Children’s Clinical Neurophysiology Department in Helsinki University Central Hospital. His current research interests include development of neonatal neurophysiology, with activities ranging from hardware development to optimizing EEG acquisition and signal analysis.