Feature Article
Measuring Web Application Quality with WebQEM Luis Olsina La Pampa National University, Argentina Gustavo Rossi La Plata National University, Argentina
This article discusses using WebQEM, a quantitative evaluation strategy to assess Web site and application quality. Defining and measuring quality indicators can help stakeholders understand and improve Web products. An ecommerce case study illustrates the methodology’s utility in systematically assessing attributes that influence product quality.
20
T
he Web plays a central role in such diverse application domains as business, education, industry, and entertainment. Its growing importance heightens concerns about Web application development methods and argues for systematic, disciplined use of engineering methods and tools.1 In particular, we need sound evaluation methods for obtaining reliable information about product quality. These methods should identify attributes and characteristics that can serve as meaningful indicators for specific evaluation goals given a user viewpoint. This article discusses the Web Quality Evaluation Method2 and some aspects of its supporting tool, WebQEM_Tool.3 Using WebQEM to assess Web sites and applications supports efforts to meet quality requirements in new Web development projects and evaluate requirements in operational phases. It also helps us discover absent features or poorly implemented requirements such as interface-related design and implementation drawbacks or problems with navigation, accessibility, search mechanisms, content, reliability, and performance. We follow common practice in describing software quality in terms of quality characteristics as defined in the ISO/IEC 9126-1 standard.4 The literature often characterizes quality, cost, or pro-
1070-986X/02/$17.00 © 2002 IEEE
ductivity requirements as nonfunctional, and measuring these less tangible characteristics directly isn’t practical, but we can assess them by measuring the product’s “lower abstraction attributes.”5 We see attributes as measurable properties of an entity—here, a Web application—and propose using a quality model (in the form of a quality requirement tree) to specify them. In this context, stakeholders must focus on characteristics and attributes that influence product quality and “quality in use.”4 (Ensuring high product quality doesn’t always suffice to guarantee quality in use, but such discussion exceeds this article’s scope.) Specifically, characteristics that influence product quality as prescribed in the ISO 9126-1 standard include usability, functionality, reliability, efficiency, portability, and maintainability. To specify the quality requirement tree for a given assessment goal and user viewpoint, we should consider such diverse attributes as broken links, orphan pages, quick access pages, table of contents, site map, link color uniformity, and main control permanence. Of course, we recognize how difficult it is to design a rigorous nonfunctional requirement model that provides a strong correlation between attributes and characteristics. Though our method works for assessing all aspects of Web sites and applications, we focus on user-perceptible product features such as navigation, interface, and reliability rather than product attributes such as code quality or design. That is, we consider Web site characteristics and attributes from a general visitor viewpoint.
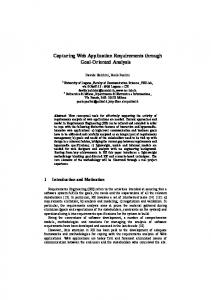
The WebQEM evaluation process The WebQEM process includes four major technical phases: 1. Quality requirements definition and specification 2. Elementary evaluation (design and implementation stages) 3. Global evaluation (design and implementation stages) 4. Conclusion (recommendations) Figure 1 shows the evaluation process underlying the methodology, including the phases, stages, main steps, inputs, and outputs. This model follows the ISO’s process model for evaluators.5
Nonfunctional requirements
Elementary evaluation
Partial/global evaluation
Web audience's needs Managerial requirement
ISO/IEC 9126 modelWebQEM models and tools
Metric selection
Elementary preference criteria definition
Global preference criteria definition
Elementary criterion descripton Web product components
Measurement implementation
Measurement result Elementary result
Documentation Conclusion of the evaluation
Scored value Partial/global preference implementation Final result
explicit and implicit user needs), we can specify characteristics, subcharacteristics, and attributes in a quality requirement tree. This phase yields a quality requirement specification document. Elementary evaluation This phase defines the two major stages that Figure 1 depicts: elementary evaluation design and implementation. For each measurable attribute Ai from the requirement tree, we can associate a variable Xi, which will take a numerical value from a direct or indirect metric. However, because this metric’s value won’t represent the elementary requirement’s satisfaction level, we need to define an elementary criterion function that will yield an elementary indicator or preference value.
October–December 2002
Quality requirements definition and specification In this phase, evaluators clarify the evaluation goals and the intended user viewpoint. They select a quality model, for instance, the ISOprescribed characteristics in addition to attributes customized to the Web domain. They then identify these components’ relative importance to the intended Web audience and the extent of coverage required. The user profile may entail three abstract evaluation categories—visitor, developer, and manager—that we can break into subcategories. For example, the visitor category can include general and expert visitor subcategories. Once we’ve defined the domain and product descriptions, agreed goals, and selected user view (that is, the
Aggregation schema
Measured value
Elementary preference implementation
Design of the evaluation
Evaluation goals
Implementation of the evaluation
Web product descriptions
Quality requirements specification
Recomendations
Quality requirements definition
Figure 1. The evaluation processes underlying the WebQEM methodology.
21
For instance, consider the Broken Links attribute, which measures (counts) links that lead to missing destination pages. A possible indirect metric is X = #Broken_Links / #Total_Links_of_Site. Now, how do we interpret the measured value, and what are the best, worst, and intermediate preferred values? We can represent a possible criterion function to determine the elementary quality preference EP as such: EP = 1 (100 percent) if X = 0; EP = 0 (0 percent) if X ≥ Xmax otherwise EP = (Xmax – X) / Xmax if 0 < X < Xmax where Xmax is some agreed upper threshold such as 0.04 So the elementary quality preference EP is frequently interpreted as the percentage of a satisfied requirement for a given attribute and is defined in the range between 0 and 100 percent (so the scale type and the unit of metrics become normalized6). To simplify preferences interpretation, we define three acceptability levels: unsatisfactory (0 to 40 percent), marginal (40 to 60 percent), and satisfactory (60 to 100 percent). The implementation stage applies the selected metrics to the Web application as Figure 1 shows. We can measure some values observationally and obtain others automatically using computerized tools.
IEEE MultiMedia
Global evaluation This phase also has two major stages: design and implementation of the partial and global quality evaluation. We select aggregation criteria and a scoring model in the design stage. The quantitative aggregation and scoring models aim to make the evaluation process well structured, accurate, and comprehensible by evaluators. At least two type of models exist: those based on linear additive scoring models7 and those based on nonlinear multicriteria scoring models8 where different attributes and characteristics relationships can be designed. Both use weights to consider indicators’ relative importance. For example, if our procedure is based on a linear additive scoring model, the aggregation and computing of partial/global indicators or preferences (P/GP), considering relatives weights (W) is based on: P/GP = (W1 EP1 + W2 EP2 + ... + Wm EPm)
(1)
such that if the elementary preference (EP) is in the unitary interval range, the following holds:
22
0 ≤ EPi ≤ 1 ; or given a percentage scale, 0 ≤ EPi ≤ 100 and the sum of weights must fulfill (W1 + W2 + ... + Wm ) = 1; if Wi > 0 ; to i = 1 ... m The basic arithmetic aggregation operator for inputs is the plus (+ or A) connector. We can’t use Equation 1 to model input simultaneity or replaceability, among other limitations, as we discuss later. Therefore, once we’ve selected a scoring model, the aggregation process follows the hierarchical structure as defined in the nonfunctional requirement tree (see Figure 2), from bottom to top. Applying a stepwise aggregation mechanism, we obtain a global schema. This model lets us compute partial and global indicators in the implementation stage. The global quality preference ultimately represents the global degree of satisfaction in meeting the stated requirements. Concluding the evaluation This phase documents Web product components, quality requirements, metrics, and criteria; and records elementary and final results as well. Requesters and evaluators can then analyze and understand the assessed product’s strengths and weaknesses with regard to established goals and user viewpoint, and suggest and justify recommendations. Automating the process using WebQEM_Tool The evaluation and comparison processes require both methodological and technological support. We developed a Web-based tool3 to support the administration of evaluation projects. It permits editing and relating nonfunctional requirements. For instance, in our e-commerce case study (which we discuss in the next section), we defined more than 90 attributes.2 Then, by automatically or manually editing elementary indicators, WebQEM_Tool aggregates the elements to yield a schema and calculates a global quality indicator for each site. This lets evaluators assess and compare Web product quality. WebQEM_Tool relies on a Web-based hyperdocument model that supports traceability of evaluation aspects. It shows evaluation results using linked pages with textual, tabular, and graphical information, and dynamically generates pages with these results from tables stored in the data layer.
1. Usability 1.1 Global site understandability 1.1.1 Global organization scheme 1.1.1.1 Table of contents 1.1.1.2 Site map 1.1.1.3 Global indexes 1.1.1.3.1 Subject index 1.1.1.3.2 Alphabetical index 1.1.1.3.3 Chronological index 1.1.1.3.4 Geographical index 1.1.1.3.5 Other indexes (by audience, by format, or hybrid such as alphabetical and subject-oriented) 1.1.2 Quality of labeling system 1.1.3 Audience-oriented guided tour 1.1.3.1 Conventional tour 1.1.3.2 Virtual reality tour 1.1.4 Image map (metaphorical, building, campus, floor and room imagemaps) 1.2 Feedback and help features 1.2.1 Quality of help features 1.2.1.1 Global help (for first-time visitors) 1.2.1.2 Specific help (for searching, checking out) 1.2.2 Addresses directory 1.2.2.1 Email directory 1.2.2.2 Phone and fax directory 1.2.2.3 Post mail directory 1.2.3 Link-based feedback 1.2.3.1 FAQ feature 1.2.3.2 What’s New feature 1.2.4 Form-based feedback 1.2.4.1 Questionnaire feature 1.2.4.2 Comments and suggestions 1.2.4.3 Subject-oriented feedback 1.2.4.4 Guest book 1.3 Interface and aesthetic features 1.3.1 Cohesiveness by grouping main control objects 1.3.2 Presentation permanence and stability of main controls 1.3.2.1 Direct controls permanence (main, search, browse controls) 1.3.2.2 Indirect controls permanence 1.3.2.3 Stability 1.3.3 Style issues 1.3.3.1 Links color style uniformity 1.3.3.2 Global style uniformity 1.3.4 Aesthetic preference 1.4 Miscellaneous features 1.4.1 Foreign language support 1.4.2 Web site last update indicator 1.4.2.1 Global 1.4.2.2 Scoped (per subsite or page) 1.4.3 Screen resolution indicator 2. Functionality 2.1 Searching and retrieving issues 2.1.1 Web site search mechanisms 2.1.1.1 Global search 2.1.1.2 Scoped search (such as museum collections, books, academic personnel)
Putting WebQEM to work We’ve used WebQEM to evaluate sites in several domains9 and discuss here its application in an e-bookstore case study.2 About quality requirements Many potential attributes, both general and
2.1.2 Retrieve mechanisms 2.1.2.1 Level of retrieving customization 2.1.2.2 Level of retrieving feedback 2.2 Navigation and browsing issues 2.2.1 Navigability 2.2.1.1 Orientation 2.2.1.1.1 Indicator of path 2.2.1.1.2 Label of current position 2.2.1.2 Level of links per page 2.2.2 Navigational control objects 2.2.2.1 Presentation permanence and stability of contextual (subsite) controls 2.2.2.1.1 Contextual controls permanence 2.2.2.1.2 Contextual controls stability 2.2.2.2 Level of scrolling 2.2.2.2.1 Vertical scrolling 2.2.2.2.2 Horizontal scrolling 2.2.3 Navigational prediction 2.2.3.1 Link title (link with explanatory help) 2.2.3.2 Quality of link phrase 2.2.4 Browse mechanisms 2.2.4.1 Quick browse controls 2.3 Domain-specific functionality and content Note: See, for example, the specification to e-bookstores in Figure 4. 3. Reliability 3.1 Nondeficiency (or Maturity) 3.1.1 Link errors 3.1.1.1 Broken links 3.1.1.2 Invalid links 3.1.1.3 Unimplemented links 3.1.2 Spelling errors 3.1.3 Miscellaneous errors or drawbacks 3.1.3.1 Deficiencies or absent features due to different browsers 3.1.3.2 Deficiencies or unexpected results (such as nontrapped search errors, frame problems) independent of browsers 3.1.3.3 Orphan pages 3.1.3.4 Destination nodes (unexpectedly) under construction 4. Efficiency 4.1 Performance 4.1.1 Quick static pages 4.2 Accessibility 4.2.1 Information accessibility 4.2.1.1 Support for text-only version 4.2.1.2 Readability by deactivating the browser image feature 4.2.1.2.1 Image title 4.2.1.2.2 Global readability 4.2.2 Window accessibility 4.2.2.1 Number of panes regarding frames 4.2.2.2 Nonframe version
domain specific, contribute to Web application quality. Figure 3 (next page) shows an e-store homepage (http://www.cuspide.com.ar) and highlights several attributes generally available on such sites. Figure 2 documents a wider list of tailorable quality requirements assuming a general visitor profile.
Figure 2. Tailorable quality requirement tree for a general visitor standpoint. Italics represent direct or indirect measurable attributes.
23
We developed the requirement tree shown in Figure 2 to be reusable among domains. For instance, the Usability characteristic splits into subcharacteristics such as global site understandability, feedback and help features, and interface and aesthetic features. The Functionality characteristic decomposes into searching and retrieving issues, navigation and browsing issues, and domain-
specific functionality and content. Because this last tree component (where Functionality is the supercharacteristic) should be customized among domains, we don’t intend it for wholesale reuse. Figure 4 outlines the schema we used in the e-bookstore study. We identified five main estore components:10 product information (2.3.1), purchase features (2.3.2), customer features
Figure 3. A screen shot of Cúspide’s homepage, with several attributes highlighted.
2.3 Domain-specific functionality and content (for e-bookstores) 2.3.1 Product information 2.3.1.1 Product description 2.3.1.1.1 Basic book description 2.3.1.1.2 Book content and structure 2.3.1.1.2.1 Book’s table of contents 2.3.1.1.2.2 Content description 2.3.1.1.3 Product image 2.3.1.1.3.1 Image availability 2.3.1.1.3.2 Zooming 2.3.1.2 Price evaluation 2.3.1.2.1 Price comparison availability 2.3.1.3 Product rating availability 2.3.1.4 Related titles and authors’ recommendations 2.3.1.5 Catalog download facility 2.3.2 Purchase features 2.3.2.1 Purchase mode 2.3.2.1.1 Online 2.3.2.1.1.1 Shopping basket 2.3.2.1.1.1.1 Shopping basket availability 2.3.2.1.1.1.2 Continue buying feedback 2.3.2.1.1.1.3 Edit and recalculate feature 2.3.2.1.1.2 Quick purchase (1-click or similar) 2.3.2.1.1.3 Checkout features 2.3.2.1.1.3.1 Checkout security 2.3.2.1.1.3.2 Canceling feedback 2.3.2.1.2 Offline 2.3.2.1.2.1 Printable checkout form
2.3.2.1.2.2 Fax, phone, or email purchase 2.3.2.2 Purchase policies 2.3.2.2.1 Purchase cancellation policy 2.3.2.2.2 Return policy information 2.3.2.2.3 Shipping and handling information 2.3.2.2.4 Payment policy information 2.3.2.2.5 Resent purchase (gift service) 2.3.3 Customer features 2.3.3.1 E-subscriptions 2.3.3.2 Customized recommendations 2.3.3.3 Account facility 2.3.3.3.1 Account availability 2.3.3.3.2 Account security 2.3.3.3.3 Account configuration 2.3.3.3.3.1 Order history and status 2.3.3.3.3.2 Account settings 2.3.3.3.3.3 Address book 2.3.3.4 Customer revision of a book 2.3.4 Store features 2.3.4.1 Title availability rate 2.3.4.2 Store ranking 2.3.4.2.1 The top books 2.3.4.2.2 The best-selling books 2.3.5 Promotion policies 2.3.5.1 With-sale promotion availability 2.3.5.2 Appetizer promotion availability (such as contests, frequent-purchase points)
Figure 4. Domain-specific functionality and content subcharacteristics for e-bookstore sites. Italics represent direct or indirect measurable attributes.
24
(2.3.3), store features (2.3.4), and promotion policies (2.3.5). Though we’ve specified the Figure 4 subtree for the e-bookstore field, we could easily reuse many of its parts for a more general e-commerce domain. Examples include the purchase features (2.3.2) and its subfactors purchase mode (2.3.2.1) and purchase policies (2.3.2.2). For the purchase mode subcharacteristic, we characterize online and offline modes, though the former is becoming more popular as confidence in security increases.11 For online purchases, we model the shopping basket, quick purchase, and checkout features. As noted elsewhere, 12 developers generally use the shopping basket mechanism to decouple product or service selection from checkout. We find it interesting to compare many of these criteria with existing navigation and interface patterns. We believe that recording and reusing design experience yields valuable information for specifying quality attributes or subcharacteristics.
Designing and implementing the partial/global evaluation This is where we select and apply an aggregation and scoring model (see Figure 1). Arithmetic or logic operators will then relate the hierarchi-
Template Title (code) Type Factor Subcharacteristic (code) Definition and comments
Example Reliability (3) Characteristic Quality Nondeficiency (3.1) “The capability of the software product to maintain a specified level of performance when used under specified conditions”4 Model to determine Nonlinear multicriteria scoring model, the global or specifically, the Logic Scoring of Preferences partial computation model8 Employed tools WebQEM_Tool Arithmetic or logic operator C* Relative weight 0.2 Calculated preference values A set of values for Reliability, as shown in Table 3 * We explain the arithmetic or logic operator item for the subcharacteristic and characteristic aggregation later.
cally grouped attributes, subcharacteristics, and characteristics accordingly. As mentioned earlier, we can use a linear additive or a nonlinear multicriteria scoring model. We can’t use the additive scoring model to model input simultaneity or replaceability, however, because it can’t express for example simultaneous satisfaction of several requirements as inputs. Additivity assumes that insufficient presence of a specific attribute (input) can always be compensated by sufficient presence of any other attribute. Furthermore, additive models can’t model mandatory requirements; that is, a necessary attribute’s or subcharacteristic’s total absence can’t be compensated by others’ presence. A nonlinear multicriteria scoring model lets us deal with simultaneity, neutrality, replaceability, and other input relationships using aggregation operators based on the weighted power means mathematical model. This model, called Logic Scoring of Preferences8 (LSP), is a generalization of the additive-scoring model and can be expressed as follows:
October–December 2002
Designing and implementing the elementary evaluation As mentioned earlier, the evaluators should define, for each quantifiable attribute, the basis for the elementary evaluation criterion and perform measurement and preference mapping. To record the information needed during evaluation, we defined a descriptive specification framework as Tables 1 and 2 (next page) show. This framework includes specific information about attribute, subcharacteristic, and characteristic definition as well as metrics, elementary preference criteria, scoring model components, and calculations. (Tables 1 and 2 template codes correspond to those shown in the requirement tree in Figure 2.) Once evaluators have designed and implemented the elementary evaluation, they should be able to model attribute, subcharacteristic, and characteristic relationships. They should consider not only each attribute’s relative importance but also whether the attribute (or subcharacteristic) is mandatory, alternative, or neutral. For this task, we need a robust aggregation and scoring model, described next.
Table 1. Template and example with the characteristic items. WebQEM_Tool uses this information.
P/GP(r) = (W1 EP r1 + W2 EP r2 + ... + Wm EP rm)1/r (2) where –∞ ≤ r ≤ +∞ ; P/GP(–∞) = min (EP1 , EP2 , ... , EPm) and
25
Table 2. Template and example with the attribute items. Template Title (code) Type Highest-level characteristic (code) Supercharacteristic (code) Definition and comments
Example Broken links (3.1.1.1) Attribute
Template of metric and parameters
Data collection type Employed tools Elementary preference function
Relative weight Elementary preference values
Reliability (3) Link errors (3.1.1) It represents found links that lead to missing destinations, both internal and external static pages (also known as dangling links). “Users get irritated when they attempt to go somewhere, only to get their reward snatched away at the last moment by a 404 or other incomprehensible error message.” (See http://www.useit.com/alertbox/ 980614.html.) The metric and parameters item links another template with information of the selected metric criterion, the expected and planned values, measurement dates, and other fields.13 For instance, the metric criterion is X = #Broken_Links / #Total_Links_of_Site. For each e-store in the field study, we got the respective X value. The data collection type item records whether the data are gathered manually or automatically and what tool is employed (if done automatically, as for the broken links attribute). Our Web site metrics automation tool, among others. EP = 1 (or 100 percent) if X = 0; EP = 0 (or 0 percent) if X ≥ Xmax ; otherwise EP = (Xmax – X) / Xmax if 0 < X < Xmax Xmax = 0.04 0.5 Cúspide’s site yielded an elementary preference of 99.83 percent; Amazon, 98.40 percent; Barnes and Noble, 97.45 percent; Borders, 76.34 percent; and Díaz de Santos, 60.07 percent.
P/GP(+∞) = max (EP1 , EP2, ... , EPm)
IEEE MultiMedia
The power r is a parameter (a real number) selected to achieve the desired logical relationship and polarization intensity of the aggregation function. If P/GP(r) is closer to the minimum, such a criterion specifies the requirement for input simultaneity. If it is closer to the maximum, it specifies the requirement for input replaceability. Equation 2 is additive when r = 1, which models the neutrality relationship; that is, the formula remains the same as in the first additive model. Equation 2 is supra-additive for r > 1, which models input disjunction or replaceability. And it’s subadditive for r < 1 (with r != 0), which models input conjunction or simultaneity. For our case study, we selected this last model and used a 17-level approach of conjunctiondisjunction operators, as defined by Dujmovic.8 Each operator in the model corresponds to a particular value of the r parameter. When r = 1 the operator is tagged with A (or the + sign). The C or conjunctive operators range from weak (C–) to strong (C+) quasiconjunction functions, that is, from decreasing r values, starting from r < 1. In general, the conjunctive operators imply that
26
low-quality input preferences can never be well compensated by a high quality of some other input to output a high-quality preference (in other words, a chain is as strong as its weakest link). Conversely, disjunctive operators (D operators) imply that lowquality input preferences can always be compensated by a high quality of some other input. Designing the LSP aggregation schema requires answering the following key basic questions (which are part of the Global Preference Criteria Definition task in Figure 1): ❚ What’s the relationship among this group of related attributes and subcharacteristics: conjunctive, disjunctive, or neutral? ❚ What’s the level of intensity of the logic operator, from a weak to strong conjunctive or disjunctive polarization? ❚ What’s the relative importance or weight of each element in the group? The WebQEM_Tool lets evaluators select the aggregation and scoring model. When using the additive scoring model, the aggregation operator
is A for all tree composites (subcharacteristics and characteristics). If evaluators select the LSP model, they must indicate the operator for each subcharacteristic and characteristic. Figure 5 shows a partial view of the enacted schema for Amazon.com as generated by our tool. Analyzing and recommending Once we’ve performed the final execution of the evaluation, decision-makers can analyze the results and draw conclusions. Table 3 shows the final values for usability, functionality, reliability and efficiency characteristics, and the global quality indicator in our ecommerce case study. It also shows the domain-specific functionality and content subcharacteristic (2.3 in Figures 2 and 4) for the functionality characteristic. The colored quality bars at the right side of Figure 6 (next page) indicate the acceptability levels and clearly show the quality level each e-bookstore has reached. For instance, a score within a gray bar indicates a need for improvement actions. An unsatisfactory rating means change actions must take high priority. A score within a green bar indicates satisfactory quality of the analyzed feature. Looking at the product information (2.3.1) subcharacteristic in the “best” and “worst” qual-
ified sites, we observed 63.72 percent satisfaction for Amazon versus 10.20 percent for Díaz de Santos. The WebQEM tool lets us follow the anchored codes in tables and navigate backward and forward to see the partial and elementary indicators (as shown on the left side of Figure 6) that further clarify these measurements. As such, we can easily see which site features need improvement and which are satisfactory. We see similar score differences for the pur-
Figure 5. Once the weights and operators were defined and the schema checked, the WebQEM_Tool could yield the partial and global preferences as shown in the right-side pane.
Table 3. Summary of partial and global preferences for e-bookstores assessed for quality.
3. Reliability 4. Efficiency Global quality preference
Amazon Barnes & Noble Cúspide Díaz de Santos (percent) (percent) (percent) (percent) 76.16 82.62 75.93 56.09 83.15 80.12 61.69 28.64 100 100 91 42.67 70.71 69.85 73.25 64.12
Borders (percent) 72.67 61.45 72.06 51.95
81.99 63.72 91.76 100 100 60
76.53 42.20 84.84 85 96.80 100
45.81 40.64 67.72 20 71.20 40
14.42 10.20 17.11 28.08 33.60 0
61.55 15.98 81.92 65 93.57 100
99.44 96.88 86.81
99.11 74.54 82.95
90.97 90.17 75.52
78.51 86.01 50.37
91.66 90.90 74.86
October–December 2002
Characteristics and Subcharacteristics 1. Usability 2. Functionality 2.1 Searching and retrieving issues 2.2 Navigation and browsing issues 2.3 Domain-specific functionality and content 2.3.1 Product information 2.3.2 Purchase features 2.3.3 Customer features 2.3.4 Store features 2.3.5 Promotion policies
27
Figure 6. The Web_QEM tool yields diverse information types. The graph at right shows final ebookstore rankings.
chase feature subcharacteristic. The Díaz de Santos application doesn’t have checkout security, quick purchase, or checkout canceling feedback, among other mandatory or desirable attributes. Conversely, Amazon has a superb online purchase preference of 100 percent. Overall, four of five evaluated sites received satisfactory ratings for the purchase feature subcharacteristic. Finally, Table 3 shows the partial preferences for the customer features (2.3.3), store features (2.3.4), and promotion policies (2.3.5) subcharacteristics.
Conclusions and future work
IEEE MultiMedia
Quantitative evaluation of Web applications remains scarce despite the publication of many style guides, design principles, and techniques.14,15 Guidelines with prioritized checkpoints for designers to make sites more efficient and accessible16 have shed light on essential characteristics and attributes and might help improve the Web design and authoring process but don’t constitute formal evaluation methods by themselves. Quantitative surveys and Web domainspecific evaluations10,11,17 offer important usability evaluation information using, in some cases, subjective user-based questionnaires, a strategy with its own strengths and weaknesses.17 We’ve been developing the WebQEM methodology since the late 1990s. Because the underlying strategy is evaluator-driven by domain experts rather than user-driven, the method is more objective than subjective and is quantitative and model-centered rather than qualitative and intuition-centered. Of course, a global quality evaluation (and eventually comparison) of complex products can’t entirely avoid subjectivity. The evaluation process starts with specifying goals that are to some extent subjective, and we derive the
28
nonfunctional requirements subjectively based on human expertise and occasional field studies. Moreover, we must sometimes subjectively assess how well requirements are satisfied (such as quality of help features or a Web site’s aesthetic preference). However, we can minimize subjectivity in the evaluation process by focusing on objectively measurable attributes such as broken links, orphan pages, and quick access pages. A robust and flexible evaluation methodology must properly aggregate both subjective and objective components controlled by experts. WebQEM works well for assessing and comparing quality requirements for operative Web sites and applications as well as in early phases of Web development projects. The tool can be useful in assessing diverse application domains according to different user views and evaluation goals. The evaluation process must start with defining and specifying quality requirements. For example, to assess the developer viewpoint rather than a visitor viewpoint, we must plan additional internal and external attributes and evaluation criteria, and also consider the ISO-prescribed maintainability and portability characteristics. The manager view, meanwhile, may have different constraints, requiring that evaluators consider management factors such as cost or productivity to optimize quality within cost, resource, and time constraints. Planned WebQEM_Tool improvements include support for collaborative evaluations because we have seen that in many assessment projects, domain experts aren’t colocated yet must interact during the design and implementation of elementary and global evaluation processes, or at the evaluation’s conclusion. Groupware mechanisms will let evaluators assume different roles, with appropriate access rights, to share workspaces and trigger data visualizers, multiparty chats, and whiteboards, among other facilities. We’re also cataloging Web metrics, specifically those where data gathering can be automated. We’ve already cataloged up to 150 direct and indirect automated Web metrics, and hope this catalogue13 will generate a framework for evaluation criteria and procedure reuse. MM
Acknowledgment This research is partially supported by La Pampa National University UNLPam-09/F022 research project and by the CYTED (Science and Technology for Development) Program in the VII.18 West (Web-Based Software Technology) Iberoamerican Project.
References
Luis Olsina is an associate professor of object-oriented technology at La Pampa National University, Argentina, and heads the Software Engineering R&D group (GIDIS). His research interests include Web engineering, particularly Web metrics, cataloging, and quantitative evaluation issues. He authored the WebQEM methodology. He received a PhD in software engineering and an MSE from La Plata National University, Argentina. He is member of the IEEE Computer Society.
Gustavo Rossi is a professor of object-oriented technology at La Plata National University, Argentina, and heads LIFIA, a computer science research lab in La Plata, Argentina. His research interests include hypermedia design patterns and frameworks. He coauthored the Object-Oriented Hypermedia Design Method (OOHDM) and is currently working on application of design patterns in Web applications. He earned a PhD in computer science from Catholic University of Rio de Janeiro (PUC-Rio), Brazil. He is an ACM member and IEEE member.
October–December 2002
1. S. Murugesan et al., “Web Engineering: A New Discipline for Development of Web-Based Systems,” Lecture Notes in Computer Science 2016, Web Engineering: Managing University and Complexity of Web Application Development, S. Murugesan and Y. Deshpande, eds., SpringerVerlag, Heidelberg, 2001, pp. 3-13. 2. L. Olsina, G.J. Lafuente, and G. Rossi, “E-Commerce Site Evaluation: A Case Study,” Lecture Notes in Computer Science 1875, Proc. 1st Int’l Conf. Electronic Commerce and Web Technologies (EC-Web 2000), Springer-Verlag, Heidelberg, 2000, pp. 239-252. 3. L. Olsina et al., “Providing Automated Support for the Web Quality Evaluation Methodology,” Proc. Fourth Workshop on Web Eng./10th Int’l WWW Conf., 2001, pp. 1-11. 4. ISO/IEC 9126-1:2001, Software Engineering— Product Quality—Part 1: Quality Model, Int’l Org. for Standardization, Geneva, 2001. 5. ISO/IEC 14598-5:1998 International Standard, Information technology—Software Product Evaluation—Part 5: Process for Evaluators, Int’l Org. for Standardization, Geneva, 1998. 6. H. Zuse, A Framework of Software Measurement, Walter de Gruyter, Berlin, N.Y., 1998. 7. T. Gilb, Software Metrics, Chartwell-Bratt, Cambridge, Mass., 1976. 8. J.J. Dujmovic, “A Method for Evaluation and Selection of Complex Hardware and Software Systems,” Proc. 22nd Int’l Conf. Resource Management and Performance Evaluation of Enterprise Computer Systems, vol. 1, Computer Measurement Group, Turnersville, N.J., 1996, pp. 368-378. 9. L. Olsina et al., “Assessing the Quality of Academic Websites: A Case Study,” New Review of Hypermedia and Multimedia (NRHM) J., vol. 5, 1999, pp. 81-103. 10. G. Lohse and P. Spiller, “Electronic Shopping,” Comm. ACM, vol. 41, no. 7, July 1998, pp. 81-86. 11. C. Kehoe et al., Results of GVU’s 10th World Wide Web User Survey, Graphics Visualization and Usability Center, College of Computing, Georgia Inst. of Technology, Atlanta, Ga., http://www.gvu.gatech. edu/user_surveys/survey-1998-10/tenthreport.html. 12. G. Rossi, D. Schwabe, and F. Lyardet, “Improving Web Information Systems with Navigational
Patterns,” Proc. WWW8 Congress, Elsevier Science, Amsterdam, 1999, pp. 589-600. 13. L. Olsina et al., “Designing a Catalogue for Metrics,” Proc. 2nd Ibero-American Conf. Web Eng. (ICWE’02), 2002, pp. 108-122. 14. IEEE Web Publishing Guide, http://www.ieee.org/web/developers/style/. 15. J. Nielsen, The Alertbox, 1995-2002, http://www.useit.com/alertbox. 16. WWW Consortium, Web Content Accessibility Guidelines 1.0, W3C Recommendation, 1999, http://www.w3c.org/TR/WD-WAI-PAGEAUTH/. 17. J. Kirakowski et al., “Human Centred Measures of Success in Web Site Design,” Proc. 4th Conf. Human Factors and the Web, AT&T,Basking Ridge, N.J., 1998, http://www.research.att.com/conf/ hfweb/proceedings/kirakowski/index.html.
Readers may contact Luis Olsina at GIDIS, Dept. of Informatics, Faculty of Engineering School, UNLPam, Calle 9 y 110, (6360) General Pico, La Pampa, Argentina,
[email protected]. For further information on this or any other computing topic, please visit our Digital Library at http://computer. org/publications/dlib.
29