May 6, 2013 ... Provide a short technical summary of your project and again describe the ....
Once the samples are passed through .... Proposed Improvements.
MECHANICAL ENGINEERING DESIGN PROJECTS FINAL STATUS REPORT
SUBMITTED BY Bennett Lee | Ethan Aaron | Mike Steltenkamp Group #9 May 6, 2013
1|P a ge
MECHANICAL ENGINEERING DESIGN PROJECTS FINAL STATUS REPORT
TABLE OF CONTENTS
PROJECT OVERVIEW ........................................................................................................................................................................................................ 3 OVERALL DESIGN............................................................................................................................................................................................................... 4 TESTING/PROTOTYPING RESULTS.......................................................................................................................................................................... 4 PROPOSED IMPROVEMENTS/LESSONS LEARNED ....................................................................................................................................... 14 REQUIREMENTS COMPLIANCE ............................................................................................................................................................................... 18 COST ....................................................................................................................................................................................................................................... 22
2|P a ge
MECHANICAL ENGINEERING DESIGN PROJECTS FINAL STATUS REPORT
PROJECT OVERVIEW Provide a short technical summary of your project and again describe the problem/challenge you are addressing. Problem at Hand According to the World Health Organization, approximately 1.1 billion people do not have access to safe drinking water around the globe. There is a clear need for a household filtration system that can be implemented and maintained at extremely low costs. HydraVita System In 2010, a group of Penn Engineering students started the development of the HydraVita system by turning research from a Stanford University publication into the first prototype of an integrated water-sterilization device. Throughout the year, the team constructed a solar power source as well as a water filter that was able to inactivate up to 81% of the bacteria passing through the system. Through the use of extensive bacteria inactivation testing, product design analysis, and design for manufacturability techniques, our team has improved and optimized many critical aspects of the HydraVita system. Not only have we been able to realize significant cost-reductions, increase ease-of-use, and improve ease-of-implementation, but we were also able to reach inactivation rates up to 88% with our final device and inactivation rates upwards of 99% during configuration testing. Our HydraVita system incorporates novel technology integrated with low-cost components and extensive empirical testing to provide a household filtration system that is on the cusp of implementation in developing nations. Project Metrics
Superior reliability and robustness compared to previous HydraVita device Optimized CNT/AgNW filter design based on empirical results (bacteria testing) Low total device cost of under $100 Proven ability to reach inactivation rates of over 90% consistently Achievable flow rate of 80 liters per day that allows for enough clean water to support a family of four (given necessary water pressure) Minimal number of components for assembly and serviceability Low cost and compact turbidity filter cartridges that can be replaced in the field without the use of any tools Include LED indicators to acknowledge current flow Minimize turbidity while not slowing down the overall flow rate of the device Function for one month of standard usage without any maintenance
3|P a ge
MECHANICAL ENGINEERING DESIGN PROJECTS FINAL STATUS REPORT
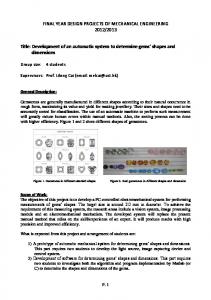
OVERALL DESIGN Summary of Design While select communities in developing nations have community water treatment systems, or new technologies such as the LifeStraw® line of products that allow for smaller quantities of water to be filtered for personal use, there is a further need for a household filtration system that can be implemented and maintained at extremely low costs. In developing such a device, there are five key parameters upon which the design must focus: (1) bacteria inactivation rate, (2) cost, (3) ease of use, (4) power consumption, and (5) ease of implementation. Through the use of extensive bacteria inactivation testing, product design analysis, and design for manufacturability processes, our team has improved and optimized many critical aspects of the HydraVita system, creating a low cost product that is very close to being ready for deployment in third world countries. Underlying Technology Our water sterilization system is based on technology that was originally published by the Yi Cui Group at Stanford University. By applying a voltage bias across a cotton filter embedded with carbon nanotubes and silver nanowires, high inactivation rates and high flow rates can be achieved. This innovative technology kills bacteria using three processes: A process known as electroporation that breaks down cell membranes The antimicrobial properties of silver Changes in the chemistry of the solution such as pH levels Because our system is killing bacteria as opposed to catching or blocking them, it allows for high-speed water filtration while only requiring minimal power usage. Scanning Electron Microscopy Images of Filtration Technology
4|P a ge
MECHANICAL ENGINEERING DESIGN PROJECTS FINAL STATUS REPORT
Scanning Electron Microscopy (SEM) images showing cotton fibers, silver nanowires, and carbon nanotubes within the HydraVita system. From left to right, the images show (1) the cotton fibers within the filter, (2) silver nanowires protruding from a single cotton fiber, and (3) carbon nanotubes and silver nanowires embedded in the cotton matrix. These images were taken at the Penn Regional Nanotechnology Facility in April of 2013.
System Schematic
5|P a ge
MECHANICAL ENGINEERING DESIGN PROJECTS FINAL STATUS REPORT
Functional Block Diagram
Functional Characteristics Bacteria Inactivation: Bacteria inactivation testing was an essential part of the design and development processes for the HydraVita device. Given the extreme importance of increasing the bacteria inactivation rate, we focused a significant amount of time testing key design parameters throughout the year. In particular, we inoculated bacteria, conducted filtration tests, and cultured bacteria in order to optimize: (1) electrode configuration, (2) filter fabrication method, (3) cross-sectional area, and (4) filter density. Through extensively planned and precisely executed parameter testing in the lab, we were able to reach bacteria inactivation rates in the laboratory upwards of 99%. Cost Reductions: Over the course of this year, we have designed major cost reductions into the HydraVita system through the use of low-cost PVC components and a more simplistic design. By utilizing design for manufacturability techniques, we have focused on reducing material costs, improving assembly times, and creating a device that can be serviced at a low cost over its lifetime. The new design not only boasts lower upfront costs, but also minimizes maintenance costs for the end user.
6|P a ge
MECHANICAL ENGINEERING DESIGN PROJECTS FINAL STATUS REPORT
Modularity of Device: In addition to lower costs, the modular design of the HydraVita system allows for improved ease-of-use, which is critical for implementation in developing nations. While the filtration technology underlying the product is on the cutting edge, it should not be difficult for users to understand and access the turbidity filter and interior of the device for cleaning and maintenance. By taking advantage of the water-tight press-fit seal of PVC, the HydraVita system remains robust, while modular at the same time. Point-of-Use Diagnostics System: Not only does the HydraVita system produce promising bacteria inactivation rates at a low cost, but it now includes a diagnostics system in order to alert users when the filter is malfunctioning. We have implemented a simple but reliable circuit that powers a red LED when voltage is detected from the power supply, and switches to a green LED light when current is actually running through the CNT/AgNW filter. While this does not detect all forms of malfunctions, it provides a low-cost point-of-use diagnostics system to alert users when bacteria are not being inactivated.
7|P a ge
MECHANICAL ENGINEERING DESIGN PROJECTS FINAL STATUS REPORT
TESTING/PROTOTYPING RESULTS Nano-Filter Fabrication The nano-filters were fabricated by the HydraVita team in the Undergraduate Bioengineering Lab. The procedure involves applying carbon nanotubes and then silver nanowires to a cotton textile. Filters were custom manufactured for each round of bacteria testing based on the defined test parameters. A detailed explanation of the fabrication procedure is included in the appendix.
Figure 1: First nano-filter prototypes on hot plate
Bacteria Testing Procedure Bacteria testing is conducted over the course of three consecutive days in the Undergraduate Bioengineering Lab. A safe strand of E. Coli was utilized for testing as E. Coli is recognized as the standard for microbial water quality by the world health organization. Day one of the procedure involves inoculating the bacteria overnight facilitating the growth of active bacteria units. On day two, once the bacterial solution has been prepared and bacteria units have been activated, the solution is passed through the filters in order to measure bacterial inactivation performance. Once the samples are passed through the filters they are plated and placed in an incubator in order to grow countable bacteria colonies. Once the plates have been incubated over night, they are removed from the incubator and the bacteria colonies are counted. The plates are photographed using UV backlighting and counted with the use of MATLAB or Photoshop. The number of colonies on each test plate is compared to that of the control plate in order to quantify the bacterial inactivation rate. A detailed explanation of the bacteria testing process is included in the appendix. Filter Configuration Testing Results Through extensive bacteria testing, the team was able to optimize the filter configuration based on a number of key parameters including: electrode configuration, filter fabrication method, cross-sectional area, and filter density. The team accomplished bacteria inactivation rates upwards of 99% during final configuration testing. The final prototype realized a bacteria inactivation rate of 88%. The variations in results are due to the low volume, low flow rate test conditions that compromised the filter’s performance.
8|P a ge
MECHANICAL ENGINEERING DESIGN PROJECTS FINAL STATUS REPORT
Under typical operating conditions, the reservoir will be filled and the identified issue will not compromise performance. Electrode Configuration The tested electrode configurations are as follows: copper mesh electrode positioned in reservoir above filter and counter-electrode attached to top of the filter; copper mesh positioned in reservoir above filter and counter-electrode attached to the bottom of the filter; and electrodes attached to the top and bottom of the filter. Based on the test results shown below, the copper mesh electrode positioned in reservoir above the filter and the counter-electrode attached to the top of the filter was chosen as the optimal arrangement. Sample (Label in Picture)
Colony Count
Inactivation Rate
Control (Control)
181
N/A
Copper mesh and clipped to top (RollApp)
86
52.5%
Clipped to top and bottom (Elec 1)
146
19.33%
Copper mesh and clipped to bottom (Elec 2)
111
38.7%
Left to right: Control, RollApply
9|P a ge
MECHANICAL ENGINEERING DESIGN PROJECTS FINAL STATUS REPORT
Left to right: Elec 1, Elec 2 Filter Fabrication Method The tested filter fabrication methods are as follows: roll the gauze and then apply the nanomaterials or apply the nanomaterials to the unrolled gauze and then roll it. Based on the results shown below, the roll and then apply method was chosen as the optimal fabrication procedure. Sample (Label in Picture)
Colony Count
Inactivation Rate
Control (Control)
181
N/A
Roll then apply (RollApp)
86
52.5%
Apply then roll (AppRoll)
114
37.0%
Left to right: Control, RollApp, AppRoll Cross-Sectional Area The tested channel cross-sectional areas include 3/8”, ½”, and ¾”. The optimal cross-sectional area was determined to be ½” as shown in the results below. 10 | P a g e
MECHANICAL ENGINEERING DESIGN PROJECTS FINAL STATUS REPORT
Sample (Label) Control (Control) Cotton (Cotton) CNT Large (CNT Large) CNT Small (CNT Small) CNT Medium (CNT Med)
Colonies 305 203 101 201 58
Inactivation Rate N/A 33.4% 66.9% 34.1% 81.0%
Left to right: Control, Cotton, CNT Small
Left to right: CNT Medium, CNT Large Final Configuration Testing (cross-sectional area and density) Three different proportional filter densities were tested with two different cross-sectional areas. The flow rate for each configuration was also recorded as shown below. The optimal filter configuration yielded a bacterial inactivation rate of over 99%.
11 | P a g e
MECHANICAL ENGINEERING DESIGN PROJECTS FINAL STATUS REPORT
Cross-Sectional Area
Density
Bacteria Count
IR % 1
IR % 2
Time (s)
Flow Rate (L/h)
Small (S)
High (HD)
0
100% 100%
398
0.90
Small (S)
High (HD)
0
100% 100%
398
0.90
Small (S)
Medium (MD)
2
99%
98%
561
0.64
Small (S)
Medium (MD)
8
94%
93%
561
0.64
Small (S)
Low (LD)
87
38%
23%
133
2.71
Small (S)
Low (LD)
60
57%
47%
133
2.71
Medium (M)
High (HD)
35
75%
69%
148
2.43
Medium (M)
High (HD)
20
86%
82%
148
2.43
Medium (M)
Medium (MD)
75
47%
34%
25
14.40
Medium (M)
Medium (MD)
22
84%
81%
25
14.40
Medium (M)
Low (LD)
82
42%
27%
7
51.43
Medium (M)
Low (LD)
55
61%
51%
7
51.43
Old
3
98%
97%
540
0.67
Old
3
98%
97%
540
0.67
12 | P a g e
MECHANICAL ENGINEERING DESIGN PROJECTS FINAL STATUS REPORT
Final Prototype Testing The final prototype was designed for optimal performance based on the metrics tested and configured during previous rounds of testing. The resulting device yielded a bacterial inactivation rate of 88%.
Label
Bacteria Count
Inactivation Rate
Test 1 F1Test1
21
88%
F2Test1
81
52%
F3Test1
65
62%
Average Test 1
Control 1
209
Control 2
130
Average Control
169.5
67%
Test 2 F1Test2
111
35%
F2Test2
141
17%
F3Test2
122
28%
Average Test 2
26%
13 | P a g e
MECHANICAL ENGINEERING DESIGN PROJECTS FINAL STATUS REPORT
Additional Bacteria Testing Results There were a number of additional tests conducted over the course of the year that did not have a direct impact on the final configuration of the Hydravita prototype device. Of these tests, lifetime and series performance have the most significant implications for state of the current technology. Lifetime testing involves passing 50mL of bacteria water through the filter, collecting a sample, and then pouring around 250mL of clean water through the filter. This process was repeated three times in order to measure any changes in the filter’s performance over extended use. While the results below suggest decreased performance over time, we have also used filters over multiple weeks of testing, and therefore over substantial volumes of water, and have seen minimal decrease in performance. Consequently, we hypothesize that the decrease in performance shown below was due to errors in the experimental procedure.
14 | P a g e
MECHANICAL ENGINEERING DESIGN PROJECTS FINAL STATUS REPORT
Series testing involves passing 50mL of bacteria water through the filter, collecting a sample, and then pouring the same filtered water through the filter again. The process is repeated, taking three samples from the single volume of water that is filtered three times. The results suggest that the amount of bacteria present in the sample will decrease with each subsequent filtration. Lifetime Testing L1
96
43% Adjusted Inactivation Rate
L2
131
23%
52.4%
L3
144
15%
66.2%
Series Testing S1
41
76% Adjusted Inactivation Rate
S2
32
81%
22.0%
S3
23
86%
28.1%
Top row, from left: L1, L2, L3; Bottom row, from left: S1, S2, S3 15 | P a g e
MECHANICAL ENGINEERING DESIGN PROJECTS FINAL STATUS REPORT
PROPOSED IMPROVEMENTS/LESSONS LEARNED Proposed Improvements 1. Measure inactivation rate and flow rate with larger volumes of water and over extended periods of time We measured inactivation rates using 100mL of water during each test. To simulate application in the field, further testing should utilize much larger amounts of water more comparable to that of daily water consumption by end users. 2. Ensure consistency in the vertical compression of CNT/AgNW filter in order to maintain the inactivation rate and flow rate consistency The cotton nanofilter’s density had a large influence on both inactivation rate and flow rate. Unfortunately, the structure to house the filter leaves it susceptible to long-term vertical compression, which could compromise flow rate. When water flows axially through the filter, it forces the cotton against the nylon holding it in place on the other end. This compresses the filter vertically. In the future, a better design that keeps the filter at a fixed density and protects it from vertical compression needs to be implemented. One example could be to incorporate a component that fixes the top end of the filter in place. Solutions should take into account cost, simplicity, and efficacy. 3. Reduce cost of input and output nozzles through the use of injection molded integral components as opposed to standardized metal attachments Our current design uses a top input nozzle that consists of a hose attachment threaded into a PVC. This results in multiple, expensive parts that sacrifice a water-tight seal. A better approach would be to create and implement one injection molded component to replace this part in the current prototype. 4. Determine inactivation rate for microorganisms other than E. Coli such as other bacteria and viruses This year, we tested for E. Coli, which is the standard from which to measure water contaminants as determined by the World Health Organization. We are confident in our devices ability to kill E. Coli, but to ensure complete safety and ascertain the extent of our devices efficacy, the next team should conduct test on other bacteria as well as viruses. 5. Custom manufacture electrodes in order to increase manufacturability The current HydraVita device uses a wire with alligator clips to attach to the copper electrode. To improve the design, future engineers should develop an electrode with a wire directly attached. Such a component would improve manufacturability reduce clutter in the device. Lessons Learned 1. Learned the importance of developing a detailed procedural framework for consistent explanation 2. Experienced the value of iterative design and rapid prototyping 3. Gained knowledge of problem assessment, solution set development, product scoping, and workflow management 16 | P a g e
MECHANICAL ENGINEERING DESIGN PROJECTS FINAL STATUS REPORT
4. Learned a great deal about nano-technology and bioengineering 5. Lessons learned in skill-based task delegation and aligning outside resources and advisors
17 | P a g e
MECHANICAL ENGINEERING DESIGN PROJECTS FINAL STATUS REPORT
REQUIREMENTS COMPLIANCE Discuss how your project complies with the customer requirements and identify how these requirements were met either through test, demonstration, analysis, inspection etc. If you did not meet a requirement or it was changed, please explain why. Project Functional Requirements
Superior reliability and robustness compared to previous HydraVita device Compared to the previous HydraVita device, we have successfully increased reliability and robustness in three key areas: (1) fewer components were utilized, (2) a single filtration chamber was used as opposed to seven chambers in the previous device (minimizing the probability of failure), and (2) leakage has been reduced through the use of standard PVC components.
Optimized CNT/AgNW filter design based on empirical results (bacteria testing) Over the course of the year, we optimized our CNT/AgNW filter configuration based on: (1) electrode configuration, (2) filter fabrication method, (3) cross-sectional area, and (4) filter density. Through extensively planned and precisely executed parameter testing in the lab, we were able to reach bacteria inactivation rates in the laboratory upwards of 99%.
Total device cost of under $100 We were able to substantially reduce costs in our final HydraVita device over the course of the year. In particular, our final prototype costs approximately $65 in off the shelf materials with small-scale production costs likely to fall below $30. By simply changing the power adapter from a $23 adapter that interfaces with the 2010 solar panel to an adapter that costs $3, and by reducing AgNW costs from $25 in purchased materials to $5 in AgNW that we grow ourselves, we can create an off-theshelf device for under $30.
Proven ability to reach inactivation rates of over 90% consistently Through extensive bacteria testing, we were able to achieve final configuration inactivation rates upwards of 99%. While our final prototype was able to reach inactivation rates up to 88%, by adjusting the testing procedures to filter more water (more than 100 mL), we are confident that our device will be able to consistently inactivate over 90% of bacteria.
Achievable flow rate of 80 liters per day that allows for enough clean water to support a family of four (given necessary water pressure) As determined by our flow rate testing, the final prototype yielded an average flow rate of 8.5 liters per hour. Based on this average, the device is capable of producing enough water for over 10 individuals per day at 20 liters per person per day. This figure is defined by the World Health Organization as the minimal daily requirement for human water consumption. 18 | P a g e
MECHANICAL ENGINEERING DESIGN PROJECTS FINAL STATUS REPORT
Minimal number of components for assembly and serviceability When reducing the number of components within our device, we focused on removing unnecessary parts based on design for assembly techniques. In particular, we asked ourselves the following questions for each of the components within our device: (1) does the part move relative to other parts, (2) must the part be a different material, and (3) must the part be separated for access or service? In following this procedure, we were able to dramatically reduce part count, improve assembly times and improve the serviceability of our device.
Low cost and compact turbidity filter cartridges that can be replaced in the field without the use of any tools The turbidity filters consist of modified knock-out caps, laser cut acrylic rings, and super smallparticle-filtering stainless steel wire cloth. The components may be assembled without any tools or adhesives. Turbidity filters are easily removed from the device for maintenance by removing the press-fit and water tight nozzle assembly. The total cost of each turbidity filter is $0.91.
Include LED indicators to acknowledge current flow We put LED indicators in place to reliably sense if a voltage supply is attached and if electric current is flowing. When the plug is inserted and the circuit is complete, the red light goes on. When water flows through the device the green light also goes on to alert the user that the water is completing the internal circuit that applies potential to the nanofilter, one of the most important components for killing bacteria in our device.
Minimize turbidity while not slowing down the overall flow rate of the device We conducted flow flow rate testing that proved that the turbidity filter did not slow down the overall flow rate of the device. We determined that the flow rate of the turbidity filter is slightly higher than that of the CNT/AgNW filter. Therefore, the turbidity filter should not slow down the overall flow rate of the device.
Function for one month of standard usage without any maintenance We were unable to test this metric exactly; however, based on current estimations, this should not be a problem. We conducted gravimetry testing to ensure that the nanomaterials stay in the filter and designed simplistic features to minimize maintenance. With these in mind, we expect the device to meet the one-month requirement. Once health policy catches up to our nanotechnology, implementation in Africa can validate our claims, but this will take several years.
Key Changes to Functional Requirements
Determine virus inactivation rate
19 | P a g e
MECHANICAL ENGINEERING DESIGN PROJECTS FINAL STATUS REPORT
E. Coli is recognized as the standard for microbial water quality by the world health organization. While it may not represent all bacteria, given that we are still optimizing design, we felt that it would be best to focus on E. Coli inactivation rate for the scope of this year’s work.
Possibly include a flow meter to identify clogging Given our research into small scale flow meters, this is not feasible on a small scale given budget and implementation concerns. We were unable to find small-scale flow meters that could be implemented at a reasonable cost.. For example, an off-the-shelf hobbyist flow meter was approximately $132 via Sparkfun. The marginal cost of incorporating a flow meter vastly exceeded the marginal benefit.
Flow rate of 20 liters per hour By reducing the cost of our device by an order of magnitude, our customer changed the flow rate requirement. For 1/5th the cost of the previous HydraVita device (which achieved about 20L/hr), two of the new HydraVita devices could achieve about the same flow rate.
Minimize turbidity to levels of less than 5 NTU After further discussions with our customer, Dr. Jackson, we determined that turbidity was not as important of a quality as we originally anticipated. In developed countries, eliminating turbidity makes the water more appealing. On the other hand, in developing countries, turbidity is not as important as having sterile bacteria-free water. In addition, turbidity is a relatively simple feature to control via fine wire meshes and the customer felt resources should be focused on other goals such as bacteria inactivation and cost reduction.
Function for one month of standard usage without any maintenance Logistics of testing over long periods of time doesn’t make sense at this point in the project. The project is still in development, but once the product is finalized, we can determine lifetime expectations.
Turbidity filters to be changed once a month Logistics of testing over long periods of time doesn’t make sense at this point in the project. The project is still in development, but once the product is finalized, we can determine lifetime expectations.
CNT/AgNW cartridges to be replaced once a year
20 | P a g e
MECHANICAL ENGINEERING DESIGN PROJECTS FINAL STATUS REPORT
Logistics of testing over long periods of time doesn’t make sense at this point in the project. The project is still in development, but once the product is finalized, we can determine lifetime expectations.
21 | P a g e
MECHANICAL ENGINEERING DESIGN PROJECTS FINAL STATUS REPORT
COST We retrieved the following financial summary from the MEAM business office on May 2, 2013. As we can see, of the $1,500 in available funds, our team has spent $1,401.58, leaving us with a remaining balance of $98.42. We were fortunate to not only receive funding from the MEAM department, but to also receive an additional $600 in funding from the Weiss Tech House Innovation Fund. FINANCIAL ANALYSIS MEAM Design Team 9 - HydraVita Ethan Aaron, Bennett Lee, Michael Steltenkamp July 1, 2012 - June 30, 2013 Revenues: Departmental Funds - $300/member Income - Other
900.00 600.00
Total Funds Available for FY2013: Expenditures - 07/01/2012 - 03/31/2013: SPARKFUN.COM 635818 Amazon.Com 002-5983440 McMaster Carr PO 2896945 Sigma Aldrich PO 2908785 Blue Nano Sigma Aldrich PO 2930550 McMaster Carr PO 2930562 Grainger PO 2935785 McMaster Carr PO 2935790 McMaster Carr PO 2940280
1,500.00 113.71 52.54 10.67 67.40 149.00 29.00 11.30 11.00 17.07 14.04 0.00
Total Expenditures Commitments: McMaster Carr PO 2960465 Grainger PO 2964764 McMaster Carr PO 2964775 US Plastics McMaster Carr PO 2968094 SPARKFUN.COM 721807 McMaster Carr PO 2972837 McMaster Carr PO 2973736 PRNF (HydrVita Water Sterilization) Campus Copy Petty cash Steltenkamp - Lowes Petty cash Steltenkamp irrigation direct Total Commitments Total Expended and Committed Uncommitted Balance:
475.73 26.89 114.40 43.96 96.17 40.80 23.26 26.98 45.18 180.00 196.78 32.75 39.18 59.50 925.85
1,401.58 98.42
D.Sokalczuk 05/02/13
22 | P a g e
MECHANICAL ENGINEERING DESIGN PROJECTS FINAL STATUS REPORT
Final Prototype Cost Breakdown
Total Expenditure Cost Breakdown
23 | P a g e