Psychological Review 2011, Vol. 118, No. 4, 637– 654
© 2011 American Psychological Association 0033-295X/11/$12.00 DOI: 10.1037/a0025234
Mechanisms of Developmental Regression in Autism and the Broader Phenotype: A Neural Network Modeling Approach Michael S. C. Thomas, Victoria C. P. Knowland, and Annette Karmiloff-Smith University of London Loss of previously established behaviors in early childhood constitutes a markedly atypical developmental trajectory. It is found almost uniquely in autism and its cause is currently unknown (Baird et al., 2008). We present an artificial neural network model of developmental regression, exploring the hypothesis that regression is caused by overaggressive synaptic pruning and identifying the mechanisms involved. We used a novel population-modeling technique to investigate developmental deficits, in which both neurocomputational parameters and the learning environment were varied across a large number of simulated individuals. Regression was generated by the atypical setting of a single pruning-related parameter. We observed a probabilistic relationship between the atypical pruning parameter and the presence of regression, as well as variability in the onset, severity, behavioral specificity, and recovery from regression. Other neurocomputational parameters that varied across the population modulated the risk that an individual would show regression. We considered a further hypothesis that behavioral regression may index an underlying anomaly characterizing the broader autism phenotype. If this is the case, we show how the model also accounts for several additional findings: shared gene variants between autism and language impairment (Vernes et al., 2008); larger brain size in autism but only in early development (Redcay & Courchesne, 2005); and the possibility of quasi-autism, caused by extreme environmental deprivation (Rutter et al., 1999). We make a novel prediction that the earliest developmental symptoms in the emergence of autism should be sensory and motor rather than social and review empirical data offering preliminary support for this prediction. Keywords: autism, regression, artificial neural networks, population modeling, synaptic pruning
typically developing children. Trajectories of development that cannot be characterized as delayed but are clearly atypical turn out to be relatively rare and presumably imply more radical differences in the underlying neural constraints. Developmental regression is amongst the most atypical patterns observed, and its causes are currently unknown (Baird et al., 2008; Molloy et al., 2006). The inspiration for the current model was a recent hypothesis by Pickles et al. (2009) that pertained to regression in the form of loss of language in the early development of children with autism. Pickles et al. argued that language loss is highly specific to autistic spectrum disorder (ASD) and is unlike linguistic deficits found, for instance, in children with specific language impairment (SLI). Although only a subgroup of children with autism show regression (regression was observed in 15% of the Pickles et al. sample), the authors speculated that the underlying abnormality may be more prevalent than the raw data suggest, because cases of potential language loss may be hidden in children whose language development is delayed. The children exhibiting language loss in the ASD sample studied were indeed those with the fastest developing language. The implication we draw from this hypothesis is that factors causing variation in the rate of language development are independent of those causing variation in the timing of the mechanism that causes regression. If language development occurs more slowly, there will be little or no overt language behavior at the point in development when the mechanism that causes regression tends to occur. This implication led us to explore candidate neurodevelopmental mechanisms that share three properties: (a) They operate after the onset of experience-dependent develop-
In this article, we present a neurocomputational model of behavioral regression in autism. The primary aim of the model was to explore candidate mechanisms that could cause a decline in performance in an experience-dependent learning system, following an initial phase of normal-looking development. Many developmental disorders are characterized by varieties of delay, sometimes occurring unevenly across different cognitive domains. The disorders can be characterized by the term delay because behaviors in affected domains in older children resemble those of younger
This article was published Online First August 29, 2011. Michael S. C. Thomas, Victoria C. P. Knowland, and Annette Karmiloff-Smith, Developmental Neurocognition Lab, Birkbeck, University of London, London, United Kingdom. This research was supported by Economic and Social Research Council (ESRC) Grant RES-062-23-2721, Medical Research Council Grant G0300188, and a Leverhulme Study Abroad Fellowship to Michael S. C. Thomas held at the University of Chicago. We would like to thank Tony Charman, Sam Wass, Mark Johnson, Andrew Pickles, and Neil Forrester for helpful discussions and Anna Fedor for her help with coding. The ideas presented here were partly developed during the ESRC workshop “Language and Social Understanding in Developmental Disorders” organized by Gina Conti-Ramsden in October 2009. Correspondence concerning this article should be addressed to Michael S. C. Thomas, Developmental Neurocognition Lab, Centre for Brain and Cognitive Development, Department of Psychological Sciences, Birkbeck, University of London, Malet Street, London WC1E 7HX, United Kingdom. E-mail:
[email protected] 637
638
THOMAS, KNOWLAND, AND KARMILOFF-SMITH
ment; (b) their timing, while potentially varying between individuals, does so in a manner that is relatively orthogonal to the developmental process; and (c) they have the potential to impair functionality should they operate atypically. The mechanism we considered was synaptic pruning. Specifically, we considered the idea that regression in autism is caused by overaggressive synaptic pruning (Johnson & Karmiloff-Smith, 1992). This would serve to damage functional circuits, thereby causing overt behavior to worsen over time. In comparison, the normal process of progressive elimination of unused neural resources consolidates proficient behavior over time.
Developmental Regression in Children With Autism Developmental regression is observed in only a subset of children with autism. Estimates range from 20%– 40%, with skills typically lost between 15 and 24 months of age (Richler et al., 2006). There is possibly a higher incidence of regression in core autism than in the broader spectrum disorder (Baird et al., 2008). Following regression, there is usually some level of recovery of function. To date, most investigations have been based on retrospective parental reports, which indicate the loss of children’s social and communication skills during the second year of life. The most systematic study of regression has focused on word loss. Although in most cases, word loss co-occurs with the loss of social communicative skills (such as eye contact, gestures, reciprocal games like peek-a-boo, and sometimes a loss of play and fine motor skills; Pickles et al., 2009), the disappearance of words that a child had previously produced is a particularly salient event for parents. Richler et al. (2006, p. 302) provided one operational definition for classifying children in the word loss group: if s/he had spontaneously used at least three meaningful words (aside from “mama” and “dada”) on a daily basis for at least 1 month, and then had stopped using all words for at least 1 month, prior to 36 months of age.
The current issues of debate in this field are whether regression forms a distinct subtype of autism or reflects an aberrant mechanism characterizing the full disorder, the degree to which development is normal or atypical prior to the onset of regression, and whether the presence of regression in a child with autism indicates poorer ultimate outcome (Baird et al., 2008; Davidovitch, Glick, Holtzman, Tirosh, & Safir, 2000; Fombonne & Chakrabarti, 2001; Goldberg et al., 2003; Lord, Shulman, & DiLavore, 2004; Molloy et al., 2006; Pickles et al., 2009; Siperstein & Volkmar, 2004; Werner, Dawson, Munson, & Osterling, 2005). For each of these points, the evidence is mixed. There is some indication that the later regression occurs before the 3-year diagnostic cutoff for autism, the poorer the prognosis (Pickles et al., 2009). Where regression occurs after 3 years of age, by definition this is referred to as childhood disintegrative disorder (CDD) rather than autism. CDD has a poorer prognosis still (e.g., Hill & Rosenbloom, 1986). Moreover, the relation of regression in autism to CDD remains unclear. Overall, regression in autism is marked by its variability: in the nature of development prior to regression, in the age of onset, in the speed of the loss of behaviors, and in the eventual level of recovery (e.g., Goldberg et al., 2003; Lord et al., 2004; Rogers, 2009).
Connectivity and Autism Early brain development is characterized by a period of exuberant growth in connectivity, followed by the pruning back of unused or weak connections (Cowan, Fawcett, O’Leary, & Stanfield, 1984; Huttenlocher, 2002; Stiles, 2008). This allows the brain maximum plasticity to adapt to the environment in which it finds itself and then, by removing unused connectivity, to save on the metabolic costs of supporting resources for plasticity after such adaptation has taken place. Associated with this growth-followedby-pruning is the idea of sensitive periods in development, where the plasticity of the cognitive system is initially heightened (Huttenlocher & Dabholkar, 1997; see Huttenlocher, 2002; Thomas & Johnson, 2008, for discussion). Synapses are one of the main neural structures responsible for changing functional connectivity in the brain, with synaptogenesis and synaptic pruning corresponding to the growth and cutting back of resources for connectivity. Evidence suggests that the formation and elimination of synapses is in fact a continuous process, and the reduction in uncommitted synapses with age is a change in the balance of formation and elimination (Hua & Smith, 2004). The reduction appears to be a global constraint and has been found in all the areas of the mammalian cortex that have been studied (Stiles, 2008). However, the exact timing across brain areas is heterogeneous in humans (Huttenlocher & Dabholkar, 1997). Although there are likely to be individual differences in the timing of the onset of synaptic pruning, the necessary longitudinal data in humans to confirm this are currently lacking (studies of more macro-level measures, such as gray matter volume, are suggestive of such variability; see, e.g., Schumann et al., 2010). The thesis we pursue here is that overaggressive synaptic pruning is responsible for regression but that the onset of pruning is within the normal time window. The fact that the decline in social communicative skills does not occur until the second year is therefore explained by the (normal) timing of pruning events in brain development. There have been a number of hypotheses that problems with connectivity may underlie autism as a whole (e.g., Abrahams & Geschwind, 2008; Belmonte et al., 2004; Johnson & KarmiloffSmith, 1992; Just, Cherkassky, Keller, & Minshew, 2004; see Wass, 2011, for a recent review). These accounts have been supported by new findings using diffusion tensor imaging (e.g., Ben Bashat et al., 2007; Frazier & Hardan, 2009) that reveal abnormal structural connectivity in autism (i.e., abnormalities in the white matter structures that are thought to represent the “wiring” of the brain; though see Ka´rado´ttir, Hamilton, Bakiri, & Attwell, 2008). Accounts have also been supported by findings from functional magnetic resonance imaging that demonstrate reduced functional connectivity in individuals with ASD (e.g., Koshino et al., 2008), indicated by reduced correlations in taskrelated activity between nodes in a functional network of brain regions. Other studies have also pointed to an overreliance on some forms of connectivity, such as short-range over long-range connectivity (Belmonte et al., 2004) or thalamo– cortico over cortico– cortico connectivity (Koshino et al., 2008). These proposals are sometimes linked to cognitive-level accounts of behavioral deficits in autism, such as weak central coherence (Happe´, 1999) and executive function deficits (Ozonoff, Strayer, McMahon, & Filloux, 1994). Connectivity-based accounts still need to clarify whether the atypicality observed has temporal primacy in the
MODELING REGRESSION IN AUTISM
development of autism or whether the connectivity abnormalities observed are downstream of other developmental abnormalities. Moreover, abnormal connectivity is not unique to autism: It has been observed in other conditions as diverse as schizophrenia (Pachou et al., 2008), HIV/AIDS (Melrose, Tinaz, Castelo, Courtney, & Stern, 2008), and dyslexia (Richards & Berninger, 2008).
Three Empirical Phenomena Before introducing the computational methods to investigate the hypothesis of overaggressive pruning, we mention three additional empirical phenomena pertaining to autism as a whole. These will become relevant when we discuss the modeling results. First, recent work has assessed whether delays in language development in autism share a common cause with delays in language development in the nonautistic population (Bishop, 2010; Folstein & Mankoski, 2000; Vernes et al., 2008). For example, a common gene variant on Chromosome 7 was found to occur more frequently both in individuals with autism and those with SLI, compared with controls (Vernes et al., 2008). Studies of rare genetic mutations associated with syndromes that exhibit comorbid autistic traits have also suggested that these mutations do not selectively cause autism but are also associated with global developmental delay or language delay, once more implicating a common cause of separate disorders (Abrahams & Geschwind, 2008). Second, it has been observed that early in development, overall brain size is larger in children with autism than in typically developing controls; across development, cross-sectional studies indicate that brain size then returns to within the normal range. In a metareview of relevant literature, Redcay and Courchesne (2005, p. 1) concluded that the data suggest “a period of pathological brain growth and arrest in autism that is largely restricted to the first years of life, before the typical age of clinical identification.” The brain size data led Frith (2003) to speculate that the overgrowth was caused by a failure of the normal pruning process, which was then associated with poor functioning of certain neural circuits. However, the brain size data are puzzling in two respects: In typical development, there is a weak but positive correlation between brain size and intelligence (of between ⫹.1 and ⫹.4; e.g., in a meta-analysis of more than 1,530 people, McDaniel, 2005, reported a correlation of .33 between in vivo brain volume and intelligence). Why should a bigger brain be advantageous when it comes to typical development but then be associated with a developmental disorder such as autism? Furthermore, why should the relative pattern of brain size in autism compared with controls change across developmental time? Indeed, Courchesne et al. (2007) proposed that in autism, brain overgrowth at the beginning of life might be accompanied by slowing or arrest of growth during early childhood and, in some individuals, a third atypical phase of degeneration in later life. Despite these puzzles, some connectivity-based accounts of autism have identified brain size differences as a primary cause of the behavioral impairments (e.g., Lewis & Elman, 2008; Stanfield et al., 2008). Third, although autism is now viewed primarily as a genetic disorder, researchers have identified a form of “quasi-autism” occurring in children who have experienced extreme deprivation (e.g., Rutter et al., 1999, 2007). This phenomenon was observed in adoptees from Romanian orphanages in the 1990s and followed longitudinally. The affected children showed disinhibited attach-
639
ment disorder but also cognitive deficits in mental flexibility and idiosyncratic interests symptomatic of autism. The patterns were variable across children, with the effects being typically milder and yielding better outcome than in ASD. Because assignment of the children to the orphanages was not based on any preexisting mental condition, and because the incidence of quasi-autism at 10% was much higher in the adoptees than the incidence in the general population of autism spectrum disorder (approximately 1%; Baird et al., 2006), the cause of the disorder in the adoptee case appears to be environmental. Nevertheless, it did not produce quasi-autism in all children exposed to the deprived environment, which also remains to be explained.
Computational Models and Autism Several neurocomputational models have been put forward to explain the origins of behavioral deficits in autism. These have focused either on category formation, atypical neural codes, or connectivity disruptions. Using self-organizing maps, Gustafsson (1997) proposed that autism results from an imbalance between short-range excitatory and long-range inhibitory connections on cortical maps, whereby too much inhibition results in the emergence of overdetailed features. Using associator networks, Cohen (1994, 1998) argued that autism results from a surfeit of internal resources causing overfitting of the data and therefore the encoding of too much detail. In the framework of adaptive resonance theory, Grossberg and Seidman (2006) put forward a similar idea that an oversensitive novelty parameter causes the allocation of too many representational resources during category formation and therefore overdetailed categories. Allied to this, they proposed unstable dynamics between cortical and limbic systems under conditions of novelty, producing extreme emotional responses to change. Focusing on neural codes, McClelland (2000) proposed that autism arises from too conjunctive/insufficiently componential representations. Simmons et al. (2007) viewed the neural codes in sensory systems as containing elevated levels of noise. Beversdorf, Narayanan, Hillier, and Hughes (2007) speculated that sparse connectivity in a network model of semantic memory would produce decreased use of context. Finally, using an associator network, Lewis and Elman (2008) demonstrated that early brain overgrowth would particularly impact those functions that relied on long-range or integrative connections. This plethora of modeling efforts focused on different aspects of the autism phenotype, but their explanations are difficult to generalize to other aspects of the broader autism spectrum. By contrast, the simulations presented in the current article attempt to encompass both autism itself and the broader autism spectrum. The current simulations employed associative artificial neural networks and began with an adventitious finding emanating from work on population modeling. In population modeling, large numbers of artificial neural networks (ANNs) are exposed to a learning problem. Individual differences are included in the parameters of the ANNs, altering their learning properties, as well as in the learning environments to which the networks are exposed. Population modeling allows for the study of individual differences within a development framework (Thomas, Ronald, & Forrester, 2011) and, by extension, the origins of variability in developmental disorders. Thomas, Ronald, and Forrester (2011) employed population modeling to explore genetic and environmental contri-
640
THOMAS, KNOWLAND, AND KARMILOFF-SMITH
butions to language development. The ANNs they used contained 14 computational parameters that could alter the networks’ learning capacity (see Method section). Each parameter was initially benchmarked to assess the range of variation that would accommodate developmental outcomes spanning failure through to success. The benchmarking constrained the range of parameter variation that would subsequently be encoded into the population. Following the Pickles et al. (2009) proposal that timing of regression and rate of development might dissociate, we revisited the benchmarking conditions. For 13 of the 14 parameters, suboptimal settings resulted only in a slowing of the rate of development. One parameter, however, produced patterns of developmental regression. This parameter related to the pruning of connectivity. The framework employed by Thomas, Ronald, and Forrester (2011) incorporated parameters analogous to several neural functions. These included how the neural network was built (number of layers, internal units, and connections), its dynamics (processing noise, threshold functions), how it was maintained (weight decay and pruning), and how it adapted through experience (learning rate, momentum). In terms of connectivity, the initial overgrowth of connections was not simulated (see Shultz, 2003, for modeling approaches relevant to this phase of development). Instead, each individual’s starting level of connectivity was specified. After a certain variable period of development, pruning of unused connectivity began. Pruning was guided by three parameters, for which the settings could vary between individuals. One parameter determined when in development pruning would commence. The second parameter was a threshold that determined how small a connection (excitatory or inhibitory) should be before it was judged that the connection was unused. In associator networks, small connections mean that the activity of the sending unit cannot markedly alter the activity of the receiving unit, and so cannot significantly contribute to function.1 A third parameter specified the probability that a connection judged as unused would be permanently pruned. It was the second parameter, the pruning threshold, that was found to cause regression when set to extreme values. If the threshold was set high, so that large weights were judged to be unused and legitimate targets of pruning, then the pruning process could damage previously established functional circuits. In turn, this could cause impairments in behavior. The following simulations took advantage of population modeling to assess the impact of atypical settings of the pruning threshold parameter on producing patterns of regression in the developmental trajectories of connectionist associator networks. Because networks contained population-wide individual differences in the other 13 neurocomputational parameters as well as in the composition of the learning environment, we were able to consider possible sources of variation in the onset of regression, its severity, and the prognosis for recovery. We report the results for three populations of 1,000 network models: (a) a low-risk population, in which the pruning threshold parameter varied within the normal range, along with all other parameters; (b) a high-risk population, in which the pruning threshold parameter was allowed to vary to much higher levels, while all other parameters varied in the normal range; and (c) an environmental-risk population, in which all parameters varied in the normal range but the environment could in principle be very impoverished. The goal of the simulations was to consider three principal questions: (a) How do atypical settings of the pruning threshold parameter relate to inci-
dence of regression in the population? (b) To what extent do the incidence and characteristics of regression depend on variation in other neurocomputational parameters? And, (c) Could an extremely impoverished environment also cause regression without the presence of atypical pruning threshold settings?
Method We first introduce the target learning problem, then the basic network architecture. Next we describe how individual variability was included in network parameters and the training set. Finally, we describe the three populations for which results are discussed.
Target Learning Problem This was a qualitative and exploratory model, and for the purposes of this article, we consider the training set only as an abstract mapping problem (see Thomas, Ronald, & Forrester, 2011, for its psychological origin in the domain of language development). The mapping problem was quasi-regular, in that it included a predominant regularity, which could be generalized to novel input patterns, along with a set of exception patterns. The learning environment was designed to assess the role of similarity, type frequency, and token frequency in development. Through these properties, the domain was taken to be representative of some of the mapping problems that the cognitive system faces, including category formation and language development. The mapping problem was defined over 90 input units and 100 output units, using binary coded representations. The training set comprised 508 patterns. This was complemented by a generalization set of 410 patterns. The predominant regularity required the network to reproduce the input pattern on the first 90 units of the output layer and then add a binary code on the last 10 units of the output layer. There were 410 regular patterns in the training set. The regular pattern had a high type frequency and formed a consistent set of mappings, and so is referred to as easy. The generalization ability of each network was tested on 410 novel patterns that were similar to the easy patterns, in that they shared 60 of the 90 input elements. This set is referred to as generalization. There were three different classes of exception pattern in the training set, which fell on a continuum of (dis)similarity from the predominant regularity: (a) Reproduce the input but do not add the final code. There were 20 of these patterns. (b) Reproduce only a portion of the input and again do not add the final code. There were 68 of these patterns. (c) Associate an arbitrary binary pattern with the input and again do not add the final code. There were 10 of these patterns. The first exception type was most similar to predominant regularity, the third type the least similar. All three were in the minority in the training set; that is, they possessed a lower type frequency than the predominant regularity. The combination of dissimilarity and low type frequency creates a continuum of difficulty. We refer to the first exception type as hard and the second as harder. Finally, the arbitrary mappings were sufficiently difficult that, to be learned at all, they needed to be repeated in the training set. They therefore 1 The same assumption may not hold in recurrent networks, because cycling activation may exaggerate the contribution of a small connection weight to subsequent function.
MODELING REGRESSION IN AUTISM
641
to ⫾3.00); sparseness of initial connectivity between layers (50% to 100% connectivity). Network activation: unit threshold function (sigmoid temperatures between 0.0625 and 4); processing noise (0 to 6); response accuracy threshold (.0025 to .5). Network adaptation: backpropagation error metric (Euclidean distance or crossentropy); learning rate (.005 to .5); momentum (0 to .75). Network maintenance: weight decay (0 to 2 ⫻ 10⫺5 per pattern presentation); pruning onset (0 to 1,000 epochs); pruning probability (0 to 1); pruning threshold (low-regression-risk population: 0.1 to 1.5; high-regression-risk population: 0.1 to 4.0).
provide an opportunity to assess whether greater practice provides immunity to regression or allows better recovery from regression. The third pattern type, then, is referred to as hardest-practiced. Together, the five pattern types allowed us to assess whether regression interacted with task difficulty.
Basic Architecture The simulations employed connectionist pattern associator networks trained using the supervised backpropagation learning algorithm. This type of architecture has been employed in a number of cognitive-level models of development, for example, infant categorization, child vocabulary acquisition, semantic memory, morphosyntax acquisition, and reading development (see Mareschal & Thomas, 2007, for a review).
Creation of a Population Each parameter had a probability distribution created during the calibration phase. The distribution determined how likely it was that an individual would have a given value for that parameter. Parameter values producing medium performance were more likely than those producing very good or very poor performance. Table 1 shows the probability distribution for the pruning threshold parameter for low-regression-risk and high-regression-risk populations (distributions for all parameters are available in Thomas, Ronald, & Forrester, 2011). The low-risk population exhibits the normal distribution used for all parameters, with intermediate values being more common. The high-risk population had equal numbers of individuals with increasingly large pruning thresholds (11.1% of individuals at each value). For each individual, the 14 parameters were independently sampled from each distribution. Next, a family quotient value was generated in the appropriate range for that population, and the quotient was then used to create the individual’s bespoke family training set. Then the network was initiated with random weight values (in the range determined by the individual’s weight range parameter) and trained for 1,000 epochs, where one epoch was an exposure to all the patterns in the individual’s training set presented in random order. Performance was measured on the five pattern types (easy, generalization, hard, harder, hardestpracticed) at each epoch, according to the full training set and the generalization set. The process was repeated for 1,000 individuals to create a population. Three populations were considered. First, we created a population at low risk for regression, exposed to relatively good learning environments (family quotients in the range of .6 to 1). Maximum pruning thresholds were 1.5. Next, we created a population at high risk for regression. For 13 of the 14 neurocomputational parameters, values were sampled from the same probability distributions. For the pruning threshold parameter, values were sampled from a
Variations in the Learning Environment The full training set was considered to be the ideal learning environment. For each individual, a subset of this training set was stochastically selected, to represent the family conditions in which each simulated child was being raised. Each individual was assigned a family quotient, which was a number between 0 and 1. The value was used as a probability to sample from the ideal training set. Thus for an individual with a family quotient value of .75, each of the 508 training patterns had a 75% chance of being included in that individual’s training set. Family quotients were sampled randomly depending on the range selected for the population. We used either the range 0.6 to 1.0 for typical populations or the range 0 to 1.0 for an environmental-risk population. In the latter case, individuals could potentially be exposed to a learning environment containing very few training patterns.
Variations in Network Learning Capacity Fourteen neurocomputational parameters were allowed to vary between individuals, serving to alter the learning capacity of each network. The available parameter settings allowed for more than 2,000 billion unique combinations. Detailed descriptions of the computational role of each parameter can be found in Thomas, Ronald, and Forrester (2011). Here, we broadly categorize them by function and indicate the range used. The parameters were as follows: Network construction: Architecture (two-layer network, three-layer network incorporating a layer of hidden units, or a fully connected network incorporating a layer of hidden units and also direct input– output connections); number of hidden units (10 to 500); range for initial connection weight randomization (⫾0.01
Table 1 Probability Distribution Used to Determine the Pruning Threshold Parameter Value for Individuals in the Low-Regression-Risk and High-Regression-Risk Populations Probability
0.1
0.2
0.3
0.4
0.5
0.75
1.0
1.25
1.5
2.0
2.5
3.0
3.5
4.0
Low-risk population (%) High-risk population (%)
0.1 11.1
1.0
4.4
11.7
65.6
11.7 11.1
4.4 11.1
1.0
0.1 11.1
11.1
11.1
11.1
11.1
11.1
Note. In the low-risk population, the median value was more frequent and extreme values were rarer. In the high-risk population, each of the values had equal probability. When pruning commenced, connections with magnitude less than the threshold were vulnerable to pruning. The most common value for initially randomized weights before training commenced was in the range ⫾0.5.
THOMAS, KNOWLAND, AND KARMILOFF-SMITH
642
flat probability distribution that included much higher threshold values (see Table 1). Note that because initial, random weight values were typically around ⫾0.5, a pruning threshold exceeding 0.5 would place many connections at risk of pruning. However, because pruning did not commence until an epoch specified by each individual’s onset parameter, early experience could serve to strengthen connection weights before pruning commenced, reducing the risk of connection loss. Atypical pruning thresholds up to 4.0 were included in the high-risk population. Finally, an environmental-risk population was created. This used the same network parameter sets as the low-risk population but exposed these individuals to potentially much more impoverished learning environments. The family quotient range for the environmentalrisk population was 0 to 1.
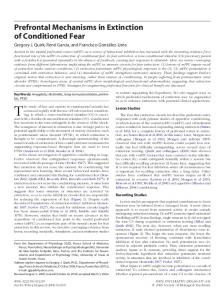
Results Measuring Developmental Regression We plotted each of the 1,000 individual developmental trajectories in the high-risk population and coded them by hand for whether they exhibited developmental regression. Regression was defined as a noticeable drop in performance over development in one or more of the five behavioral measures (easy, generalization, hard, harder, hardest-practiced).2 Figure 1 depicts sample trajectories for four typically developing networks and four networks showing regression. We found that it was not possible to automate the classification of regression because, whether regression was present or not, development was very often nonmonotonic (i.e., sometimes it got worse before it got better). Regular and exception pattern types could interfere with each other during development, causing performance on one or the other to temporarily decline. In addition, one of the neurocomputational parameters was the level of internal processing noise, which could cause performance to oscillate between measurement points. In individuals with noisy processing, performance could show large oscillations. A judgment of the presence of regression was made against the degree of developmental variation exhibited by that network. To ensure consistency, a random sample of 20% of the trajectories was rated by a second coder who was blind to the ratings of the first coder. Both coders were blind to the parameter set and environmental conditions of each individual, including the actual onset of the pruning process. Interrater reliabilities for onset and size of regression ranged from r ⫽ .81 to .98 (all ps ⬍ .001). When regression was observed for a given pattern type, six measurements were made: the level of performance just prior to the onset of regression; the epoch at which regression occurred; the size of the drop in accuracy; the number of epochs over which that drop occurred; the rate of recovery (five qualitative categories were used: no recovery, slow recovery, medium recovery, fast recovery, and almost instant recovery); and the final level of performance at the end of training (1,000 epochs). On the basis of the size of the drop in accuracy, we defined four levels of severity of regression: Level 1, corresponding to a drop in accuracy between 0% and 20%; Level 2, corresponding to a drop in accuracy of 20% to 40%; Level 3, corresponding to a drop in accuracy between 40% and 60%; and Level 4, corresponding to a drop in accuracy of 60% to 100%. For the high-risk population, 641 cases of regression were recorded. In the low-risk population, there were
46 cases. In the environmental-risk population, there were 67 cases.
Regression and Variability Figure 1 illustrates the large variations found in developmental trajectories in the typically developing individuals (by which, in this context, we mean networks not showing regression). Variations in computational parameters and learning environments produced differences in the rate of development, the smoothness of developmental trajectories, and the uniformity of performance increases across different mapping types. Cases of regression, also shown in Figure 1, similarly exhibited a great deal of variability. Variations were observed in the onset of regression, its severity, its specificity to pattern type, the subsequent rate of recovery, and the final level of recovery. Although Figure 1 demonstrates clear cases of regression, there were also less obvious patterns. These included a slow decline in performance; slight dips in performance in all pattern types that, given the variability in the trajectory of development, would not constitute regression except for the simultaneous appearance in all pattern types; and regression in early developing patterns with development in the other patterns occurring only as the early developing patterns recovered. The onset of regression in the high-risk population showed a normal distribution, with a mean of 106 epochs and a standard deviation of 56 epochs. Counting all cases of regression in the five behavioral metrics among the 641 individuals, 16% were at Severity Level 1, 20% at Severity Level 2, 24% at Severity Level 3, and 40% at Severity Level 4. Where regression occurred, in 22% of cases it was found across all five pattern types, whereas in 78% of cases it was found only in subsets. Again, collapsing across all cases of regression, 51% of cases showed no recovery, 6% slow recovery, 19% medium recovery, 18% fast recovery, and 6% very fast recovery. The variability observed in the typically developing networks was generated by the implemented parameter and learning environment variations. It seems reasonable to conclude that the variation observed in the nature of regression arose from the same cause: population-wide individual variation (see Thomas, Knowland, & Karmiloff-Smith, 2011, for discussion). Of course, analytically, we know that the pruning threshold was the sole process that caused developmental regression in these simulations. And we know that the only difference between the low-risk and high-risk populations was in the sampling of the pruning threshold parameter values: The increases in the size of the threshold shown in Table 1 led to a 14-fold increase in the incidence of regression between the low-risk and high-risk populations. The pruning threshold is thus obviously the cause of regression in these networks. However, it is interesting to establish exactly how increases in the pruning threshold parameter affected the incidence of developmental regression. The discovery of mechanisms is clearly a major point of the simulations. Figure 2 plots 2
Raters were given the following definition: Regression is present when any one of the pattern types shows a systematic drop in performance at any point in development. This may range from a temporary dip in one pattern type to a complete collapse in performance across all types. The dip should be noticeable compared to the developmental variation exhibited by that individual.
MODELING REGRESSION IN AUTISM
643
Figure 1. Example developmental trajectories for four typically developing individuals and four individuals exhibiting regression. Each plot includes the pruning threshold parameter setting for that individual.
this relationship, depicting the cumulative probability of exhibiting regression at each severity level for each level of the pruning threshold parameter. The panel on the left plots the incidence of regression in the most robust behavior (easy), whereas the panel on the right plots the incidence for the most vulnerable behavior (i.e., if any one of the five showed regression). For each panel, the first line shows the incidence at Severity Level 1 (the mildest), the second line Severity Levels 1 and 2 combined, the third line Severity Levels 1, 2, and 3 combined, and so forth. The difference between adjacent lines shows how many cases are present at each
severity level. Two points from this figure are of note. First, the relationship between pruning threshold and regression was probabilistic. Even with more extreme values of the pruning threshold parameter, there was no guarantee that regression would be observed. For example, at the most extreme threshold value of 4.0, 4.3% of those individuals (five networks) showed no evidence of regression at any level of severity in any behavior. Second, the relationship between incidence and parameter value was nonlinear, jumping up after a threshold of 1.0 was reached; and the exact pattern of the relationship was modulated by the robustness of the
Figure 2. The cumulative probability of regression per severity level plotted against the value of the pruning threshold parameter, for the most robust behavior (easy patterns) and the most vulnerable behavior (presence of regression in any pattern type). Regression was defined on the basis of behavior (1 ⫽ least severe, 4 ⫽ most severe).
THOMAS, KNOWLAND, AND KARMILOFF-SMITH
644
target behavior. Such nonlinear relationships between parameter variations and behavior are a common characteristic of nonlinear processing systems like neural networks. Next we sought to unpack the precise role of population-wide variation in producing this probabilistic outcome: What were the protective and risk factors? We used the statistical technique of stepwise logistic regression (forward Wald method) to evaluate which neurocomputational parameters predicted the presence or absence of regression (including, in this case, any developmental regression observed in any behavior). We also included each individual’s family quotient value in the statistical model. Table 2 shows the results of this analysis, listing the parameters in decreasing size of the variance in outcome that they explained. As expected, the pruning threshold value predicted most of the variance in outcome. Six further parameters then served as protective or risk factors. They fell into three types: (a) The pruning probability parameter determined the likelihood of a connection being pruned if it was sufficiently small. A very low probability directly ameliorated the negative effects of a high pruning threshold, whereas a high probability exacerbated it. (b) The processing unit threshold function and the momentum were both parameters that altered how quickly connection weights grew during learning. If weights grew slowly, their small size rendered them more vulnerable to pruning. (c) Three parameters affected the number of connections in the network. First, sparseness determined how many connections were initially created between any two layers of processing units. Second, the number of hidden units also contributed to a greater number of connections. In both cases, these connections operated in parallel. Roughly speaking, if there are twice as many connections wired up in parallel, then the connections need to be only half the magnitude to produce the same effect at the output. Large numbers of parallel connections therefore increase the risk of pruning because they reduce connection size. Third, the architecture determined how many layers of weights were arranged in series. When additional weights are arranged in series, as in the three-layer and fully connected networks compared with the two-layer networks, there is a further risk for developing connections with small sizes. Connections between input and hidden units are more remote from the error signal that is driving learning. They therefore change more slowly and retain a smaller size for longer (see Thomas & McClelland, 2008, for an algebraic account). Lower layers in multilayer networks are therefore more at risk of pruning.
In terms of the mapping to actual neural constraints, we should be clear about the level of abstractness intended. To take the last example of lower layers in the network, we do not assume this to offer a direct parallel to the six layers of the neocortex or to lower level processing in the perceptual stream; rather, we assume it to demonstrate that neurocomputational constraints that serve to modulate connection magnitude in the normal case will become implicated as risk or protective factors for an atypical process that operates on connection size. At this stage we can draw two preliminary conclusions. The first is that developmental regression showed a probabilistic relationship to its cause (large values of the pruning threshold parameter) because of the interaction with population-wide individual variation in other neurocomputational parameters. Only one of the six risk factors directly modulated the pruning process. The other five modulated the risk of regression by acting on the size of connections achieved during the early phase of development prior to the onset of pruning. Larger connections were less vulnerable to pruning. The second preliminary conclusion is that variability arose through protective and risk factors acting via the common causal pathway of connectivity. Regression was also observed in the low-risk and environmental-risk populations. A similar statistical analysis suggested that the presence of regression was once more mostly predicted by the pruning threshold parameter, even when it took on smaller values (the parameter explained approximately 20% of the variance for each population). The population-wide individual variation that conspired to generate regression in the low-risk population comprised the number of hidden units (7.7% of the variance), the learning rate (5.6%), the unit threshold function (4.1%), and the learning algorithm (3.8%). In terms of mechanism, these factors conspired to encourage very small weights and so make even a modest pruning threshold damaging to network structure and function. The environmental-risk analysis produced similar results, with the addition of one further factor: Family quotient now explained 2.1% of the variance. Specificity was a marked characteristic of regression in the simulations, with the majority of cases impacting on selective behaviors. We used one-way analyses of variance (ANOVAs), with pattern type as a single five-level factor, to investigate which aspects of regression exhibited the strongest effects of specificity. Effects were found in all the measures we took, including the timing of onset, F(4, 3194) ⫽ 3.03, p ⫽ .017, 2p ⫽ .004; the size
Table 2 Statistical Stepwise Logistic Regression Analysis for Neurocomputational Parameters That Modulate Probability of Developmental Regression in the High-Risk Population Parameter Pruning threshold Unit threshold function Architecture Pruning probability Hidden unit number Sparseness Momentum Family quotient (environment)a a
⫺2 log likelihood of the model Nagelkerke R2 change Significance of model 734.8 642.2 624.9 611.2 603.7 598.9 594.8 —
.597 .068 .012 .010 .005 .003 .003 —
Not included in model. The p value shows significance at the seventh step.
⬍.001 ⬍.001 ⬍.001 ⬍.001 ⬍.001 .029 .042 .593
MODELING REGRESSION IN AUTISM
of the drop in accuracy, F(4, 3194) ⫽ 80.1, p ⬍ .001, 2p ⫽ .091; the duration over which regression took place, F(4, 3194) ⫽ 23.3, p ⬍ .001, 2p ⫽ .028; the rate of recovery, F(4, 3194) ⫽ 106.7, p ⬍ .001, 2p ⫽ .118; and the final level of performance, F(4, 3194) ⫽ 242.5, p ⬍ .001, 2p ⫽ .233. Specificity was most apparent in the drop size, the rate of recovery, and the final level of recovered performance. It was least apparent in the timing of onset of regression. In all these cases, vulnerability echoed the difficulty of the pattern type. The three types of exception patterns were lost more easily and recovered more poorly. High type frequency and consistency of behaviors were protective factors against regression. Idiosyncratic behaviors, even highly practiced ones, were more vulnerable to loss. In sum, although neurocomputational parameters were general to the system, their effects on behavior (via a developmental process) were uneven. A series of statistical linear regression (SLR) analyses was carried out to see which computational parameters modulated the onset of regression, the drop size, the speed of decline, the rate of recovery, and the final level. The onset was relatively impervious to the effects of learning, with the pruning onset parameter explaining most of the variance. This indeed reflected our initial thesis that the timing of the cause of regression should be relatively independent from factors causing variation in learning. The speed with which behavior declined also pertained mainly to the constraints of the pruning process. By contrast, the size of the drop in behavior, the recovery rate, and the final outcome were mutually determined by many of the factors involved in experiencedependent change, as well as by the details of the pruning process. Features of regression modulated by several causal factors would be expected to show greater variability in the population. Notably, in all these analyses, variations in the environment featured only in the final level of performance following recovery and even in this case, explained only around 1% of the variance. For the high-risk population, then, variation in the quality of the environment had little influence on the characteristics of regression. These characteristics were instead influenced by intrinsic properties. One salient empirical issue in the autism literature is the relationship between the age at which regression occurs and the prognosis for the child, with reports suggesting that later onset may be associated with poorer prognosis (e.g., Pickles et al., 2009). In the simulations, we investigated whether the final outcome level was altered by differences in the timing of onset. We compared the size of recovery for 118 cases of regression occurring before 50 epochs of training with the size of recovery for 112 cases occurring after 140 epochs of training. We assessed recovery for the easy patterns and the harder patterns and measured recovery based on the accuracy difference at the end of training (1,000 epochs) compared with the peak performance prior to regression. A value of zero would indicate that behavior had returned to its preregression peak. Positive numbers would indicate further progress beyond the preregression peak. Negative numbers would indicate a lasting deficit. The results are shown in Figure 3. The evidence indicates that in the model, later regression was indeed associated with poorer outcome, and this effect was independent of the vulnerability of the behavior; main effect of timing: F(1, 432) ⫽ 13.4, p ⬍ .001, 2p ⫽ .030; main effect of vulnerability, F(1, 432) ⫽ 20.8, p ⬍ .001, 2p ⫽ .046; interaction, p ⫽ .877. To some extent, this might be explained by the shorter time available for recovery in the later onset group. However, in most cases there
645
Figure 3. Recovery level compared with preregression peak, for easy and harder patterns, split by timing of regression (early ⫽ before 50 epochs, n ⫽ 112; late ⫽ after 140 epochs, n ⫽ 118). Error bars show the standard error of the mean.
was sufficient training time for recovered performance to reach asymptotic levels. Moreover, the value of the pruning threshold parameter was reliably higher in the late onset group compared with the early onset group (means of 2.74 vs. 2.45), t(228) ⫽ 2.189, p ⫽ .021. This suggests that for regression to occur later in development, when connection weights were typically stronger, it had to be caused by an even more aggressive pruning process.
Links to the Broader Autism Phenotype In this section we report three findings from the simulations that are relevant if developmental regression is in fact an overt manifestation of a mechanism that also underlies the broader phenotype of autism (as per the hypothesis of Pickles et al., 2009). These findings take the behavioral manifestation of regression as the marker of the atypical process responsible for the wider phenotype. We later discuss under what conditions overaggressive pruning would lead to a failure to progress developmentally (as occurs in the wider autism phenotype) rather than development followed by regression. First, for the low-risk population, we used an SLR analysis to evaluate which parameters predicted individual differences in the rate at which development occurred. We used the dependent variable of performance on the harder pattern type after 50 epochs of training, as this was the most sensitive measure. Table 3 lists a subset of the factors explaining reliable amounts of variance at the .05 level. These were the factors that made development faster or slower. In the low-risk population, variation in the pruning process predicted very little of the variance in rate of development, with pruning onset and probability not significant predictors at the .05 level and the pruning threshold explaining only 0.3% of the variance. This reflects the fact that in its normal operation, pruning just removed unused connectivity resources. Comparison of Tables 2 and 3 indicates that several of the computational parameters that served as risk factors for regression also served as direct causes of variations in the rate of development. If we take the former to stand for autism and the latter to stand for language delay, this model
THOMAS, KNOWLAND, AND KARMILOFF-SMITH
646
Table 3 A Subset of the Computational Parameters That Predicted Rate of Development in the Low-Risk Population (for Comparison With Table 2) Parameter
R2 change
Significance
Pruning threshold Unit threshold function Architecture Pruning probabilitya Hidden unit number Sparseness Momentum Family quotient (environment)
.003 .057 .055 — .018 .008 .028 .023
.014 ⬍.001 ⬍.001 .096 ⬍.001 ⬍.001 ⬍.001 ⬍.001
Note. Values show the R2 change taken from a statistical stepwise linear regression analysis. The learning rate parameter explained most of the variance in rate of development (R2 change ⫽ .113). a Not included in model. The p value shows significance at the seventh step.
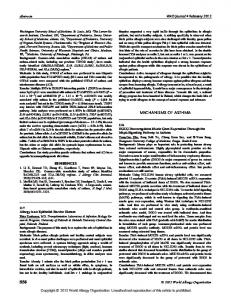
provides one means to explain why there might be some shared common gene variants between autism and SLI (Vernes et al., 2008). Under this view, the genes would contribute to variation in a neurocomputational parameter that was a direct cause of SLI but only a risk factor for autism. We can classify such parameters as risk factors in the second case because they do not cause autism (here, regression) provided the pruning process is not overaggressive. Rare mutations linked with both autism and global delay (mental retardation) might be related in the same way. Comparison of Tables 2 and 3 also yielded another interesting result. The number of hidden units and the sparseness of connectivity were predictors of both regression and developmental rate in the same direction. That is, more hidden units made it both more likely that an individual would experience regression (if the pruning process was overaggressive) and more likely that an individual would develop at a faster rate (if the pruning process was normal). Similarly, more dense initial connectivity made it more likely that an individual would experience regression (if the pruning process was overaggressive) but also more likely that an individual would develop more quickly (if the pruning process was normal). This is a surprising yet important demonstration that a neurocomputational parameter can be positively correlated with outcome in the typically developing population but negatively correlated with outcome in a disordered population. As we pointed out earlier, exactly this paradox arises in the positive relationship between brain size and intelligence in the typically developing population, against the larger brain sizes observed in early development in children with autism. As we saw above, whereas parallel resources increase computational power, they also encourage smaller connection sizes that are more at risk of being pruned.3 Empirically, it is also puzzling that larger brain size is a feature only of early development in autism (Redcay & Courchesne, 2005). Such a pattern encouraged Courchesne et al. (2007) to propose that from early childhood onward in autism, there might be slowing or arrest of brain growth; this would explain the absence of a difference compared with controls in older individuals with autism. The connectionist networks employed in the current simulations are relatively abstract and obviously bear only an analogous relationship to actual neural circuits. Nevertheless, if
one postulated that the number of connections in an artificial neural network is analogous to brain size, an assessment of how connection numbers changed across development might be informative. Figure 4 displays these data for the high-risk population, comparing the number of connections at various points in development for individuals exhibiting regression (split by the level of severity) with typically developing controls. All individuals showed initially high levels of connectivity that declined following the onset of pruning. However, in line with the fact that high levels of initial connectivity elevate the risk for regression, Figure 4 also shows that for networks yielding the most severe level of regression, there were initially more connections than in the control population. Once the (overaggressive) pruning process began, the number of connections in this severely affected group fell below the level found in the control group. Elevated network size in the group with severest regression was only a feature of early development. Figure 4 shows that regression also occurred in smaller networks at less severe levels. The link between these simulation results and the brain size data for autism is, of course, speculative. The simulations have the limitation of predicting that there should be shrinkage in overall network size with age, whereas this pattern is observed only for gray matter volume, while white matter volume increases across development (Giedd et al., 1999; Paus et al., 2001). Nonetheless, the simulation results would reconcile both (a) how brain size could have the opposite correlation with outcome in a typically developing population compared with a disordered population, and (b) how the larger brain size in autism could be a feature only of early development. This account differs from those that have identified brain size as a primary cause of the behavioral deficits in autism. In the current simulations, the larger network size in affected individuals was not a direct cause of deficit but an artifact of sampling in a behaviorally defined disorder: Because network size was a risk factor for regression, individuals with large networks were overrepresented in the regression group compared with controls. Moreover, because network size was only a risk factor for regression rather than a direct cause, there was a great deal of overlap in the network sizes found in typical and disordered networks. This pattern is also found for studies comparing brain size of children with and without autism (e.g., Schumann et al., 2010). Such a degree of overlap tends to undermine the potential role of brain size as a direct cause of the phenotype. Third, we considered whether extremely impoverished environments could increase the likelihood of regression in a population that shared the same computational parameters as the low-risk population. Figure 5 compares the incidence of regression at each severity level for the low-risk and the environmental-risk populations. Twenty-one additional cases of regression were observed in the environmental-risk population, a 45% increase in population risk. These new cases exhibited regression with mainly mild or medium severity and with good ultimate outcome. Recovery levels, comparing final outcome with preregression accuracy peak, yielded means of ⫹13.6% for easy and ⫹8.0% for harder pattern types; means for the high-risk population were –24.9% and 3 Not all parameters showed the paradoxical correlations: The unit threshold function contributed to risk of regression in the high-risk population and risk of developmental delay in the low-risk population.
MODELING REGRESSION IN AUTISM
647
Figure 4. The mean number of connections in networks across development, shown for typically developing individuals and individuals exhibiting each level of severity of regression. The insert shows the early crossover for individuals with the severest level of regression, with initially higher and later lower numbers of connections compared with controls.
–36.8%, respectively. The additional cases corresponded to individuals exposed to impoverished environments, with a mean family quotient value of .32 (i.e., only a third of the training set). The mean family quotient value for the 46 cases of regression in the low-risk population was .78. Mechanistically, the impoverished training sets caused these networks to develop smaller than usual connection weights, making them vulnerable to the less aggressive pruning process present in this population. The pattern of results is certainly suggestive of the “quasi-autism” identified by Rutter et al. (2007). Quasi-autism was seemingly caused by extreme environmental deprivation but was not universal to the children who experienced this deprivation. From the perspective of the simulations, two points are noteworthy. First, the environmental effect still operated via the common causal pathway of connectivity.
Figure 5. The incidence of regression split by severity level, for low-risk and environmental-risk populations.
Second, as indicated in an earlier analysis, variations in the pruning threshold parameter still explained most of the incidence of regression in the environmental-risk population. That is, not all individuals were affected by the impoverished environment because, in affected cases, it also required marginally elevated underlying risk for aggressive synaptic pruning. Poor environment only exaggerated underlying risk that would have remained latent in a normal environment. For both the simulations and the cases of quasi-autism reported by Rutter et al., the impairments were less severe and the outcome more positive than that observed for many core cases of autism. These three findings provide a parsimonious explanation of several empirical phenomena in the broader autism phenotype. However they rest, of course, on the assumption that regression can be linked to the broader autistic phenotype. Autism is more often characterized by a failure to progress than by regression. Under what circumstances could overaggressive pruning cause failure to progress, rather than development followed by regression? We believe this link can be made if the mechanism damaging neural circuits is the same in the two cases but its timing is different. Under this view, autism will occur without regression if developmentally the overt behavior has not yet appeared by the time pruning begins. This may be either because the emergence of the overt behavior is itself delayed (as per the hypothesis of Pickles et al., 2009) or because there are individual differences in the timing of onset of pruning. Earlier occurring pruning will damage circuits before they have had time to give rise to many overt behaviors. Indeed, the idea of individual differences provides a way to link mechanistically a number of phenomena hitherto treated separately: autism without regression, the regressive subtype, and some cases of childhood disintegrative disorder where regression occurs after the age of 3 years. In the first case, the aggressive pruning
648
THOMAS, KNOWLAND, AND KARMILOFF-SMITH
occurs before many overt behaviors are apparent. In the second case, it occurs after some salient behaviors have emerged (such as vocabulary development and social interactions). In the third case, the aggressive pruning occurs after 3 years of age. The later it appears, the more extreme pruning would need to be, in order to damage the more established functional circuits of older children, explaining the poorer prognosis of children with CDD. In our final simulation analysis, we investigated whether some cases that were not rated as instances of regression but that exhibited delay or a developmental plateau might in fact have been caused by overaggressive pruning that had occurred early in development. We identified several candidate cases in the high-risk population based on a combination of behavioral delay and either a high pruning threshold or early pruning onset parameter value. These analyses are different in kind from the preceding analyses because cases were identified by a combination of behavior and a priori knowledge of the individual’s neurocomputational parameter set. Four candidate individuals are illustrated in Figure 6, with the trajectories illustrating delay and plateau shown in the upper row. To verify the contribution of the pruning process, these networks were rerun with identical parameters and environmental conditions, with the exception of the pruning threshold parameter, which was lowered to a value of 0.1. Pruning would therefore occur only for very small connections. The lower row in Figure 6 demonstrates the trajectories for each individual under these conditions. With this one parameter altered, these cases yielded much more successful developmental outcomes, thereby implicating overaggressive pruning as a cause of the delay. (Other cases of
delay identified in the population were not altered by changing the pruning threshold parameter.) In three of the four illustrated cases, the onset of pruning was earlier than that found in regression (at 50, 75, and 25 epochs, compared with the regression mean of 106). Pruning thresholds were high for two of these cases (2.5), but for the third and earliest occurring case, the threshold was only 1.0. The fourth case experienced pruning onset at 100 epochs but had a high threshold of 4.0. These case studies offer cautious support that delay rather than regression can result from overaggressive pruning if it occurs earlier in development. The fourth case shows that a plateau in development rather than regression is a possible consequence of later occurring pruning at more aggressive levels. There were a number of more extreme cases where development failed completely. We identified 21 such cases in the high-risk population, where no learning was apparent (which we refer to as flatliners). For these networks, the mean onset of pruning was 70 epochs and the mean pruning threshold was 2.7. Once more, we reran these networks with the sole change of a reduction in the pruning threshold parameter to 0.1. In 15 cases, the networks now showed some degree of development, whereas in six others there was no change. The mean trajectory averaging across these 15 cases of “recovered development” is shown in Figure 7 (right panel), with the mean trajectory from all typically developing (i.e., nonregression) networks shown for comparison (left panel). The mean typically developing trajectory includes the 21 flatliners. These extreme cases demonstrate a number of points. First, early overaggressive pruning can contribute to a failure to progress in an experience-dependent learning system. Second, the failure to prog-
Figure 6. Top row: Trajectories of individuals who exhibited a pattern of delay or plateau rather than a clear pattern of regression, and where early aggressive pruning was implicated as a cause. Bottom row: the same networks rerun with identical parameters and environmental conditions except for the pruning threshold parameter, which was reduced to 0.1. Stronger performance confirmed the potential role of early pruning in causing delays and plateaus in development.
MODELING REGRESSION IN AUTISM
649
Figure 7. Left panel: Average trajectories for all individuals not classified as showing regression (n ⫽ 359). Right panel: Average trajectories for individuals in whom development failed completely, but who showed some level of development when the networks were rerun with the pruning threshold parameter reduced to 0.1 (n ⫽ 15). The pattern of delay indicates that failure was due to a combination of aggressive pruning and underlying slow development.
ress can have other neurocomputational causes than pruning, corresponding to a critical accumulation of risk factors for delay. Third, as Figure 7 illustrates, in cases of failure, had the overaggressive pruning process not operated, development would have been delayed in any case. That is, the failure to progress in the 15 cases resulted from a “double hit” of delay and overaggressive pruning. The simulation result provides computational support for Pickles et al.’s (2009) hypothesis that cases of regression may represent faster developing cognitive systems, with the same mechanism causing slower developing cognitive systems to fail to progress. Although this final analysis can only be provisional due to its post hoc nature, it nevertheless provides support for the hypothesis that regression and the wider autism phenotype may be linked by a common underlying mechanism, with the more usual autism pattern occurring when there is earlier overaggressive pruning or slower underlying development.
General Discussion Our account of regression in autism extends the approach of placing the developmental process at the heart of the explanation of developmental deficits (Karmiloff-Smith, 1998, 2009) and using implemented neurocomputational models to specify the details of that process (Mareschal et al., 2007; Thomas & KarmiloffSmith, 2002). It is novel in its use of population modeling, where large numbers of individuals are simulated to capture the contribution of intrinsic and extrinsic sources of variation on behavior (neurocomputational parameters and the learning environment, respectively). This technique permitted the investigation of heterogeneity in regression and the influence of risk factors and protective factors in modulating the relationship between disorder cause and deficit outcome. Such factors could not be described as directly causal because, importantly, they also varied in unaffected individuals. We were therefore able to model the subsequent probabilistic relationship between cause and effect in a mechanistic rather than statistical model. Bishop (2006) recently advocated a causal framework for developmental deficits based on protective
and risk factors. Although this framework is familiar in medicine, it stands in contrast to previous approaches in neuropsychology that have appealed to dissociation methodology, seeking to identify necessary and sufficient conditions for developmental deficits to arise. We believe that the use of population modeling to explore the statistical distribution of possible developmental trajectories given particular intrinsic conditions and particular environments has much to offer in understanding the causes of individual variation in behavior and that the same technique could be used to explore the origins of other developmental disorders. The main findings of the current simulations can be summarized as follows. We hypothesized that the loss of previously established behaviors in early childhood observed in some children with autism is the result of overaggressive synaptic pruning. A normal threshold led to the pruning of connections without a negative impact on development. Setting the threshold too high allowed established functional circuits to be pruned, thereby damaging behavior. The simulations showed that (a) the pruning threshold parameter bore only a probabilistic relationship to the behavioral manifestation of regression; (b) the relationship was also nonlinear, so that variations in the parameter up to a certain point had little effect, but over a certain level increasingly led to regression; (c) the probabilistic nature of regression was due to an interaction of the pruning threshold parameter with population-wide variation in other computational parameters that could serve as risk or protective factors; (d) such factors produced heterogeneity in many of the characteristics of regression, including the timing of onset, the severity, the behavioral specificity, and the recovery; and (e) late onset regression had a poorer prognosis for recovery. Both the latter characteristics have been noted in the empirical literature on autism (Goldberg et al., 2003; Lord et al., 2004; Rogers, 2009). The heterogeneity arose because computational effects converged on the common causal pathway of connectivity size; (f) some computational parameters that were only risk factors for regression were the direct cause of developmental delay. This would provide an explanation of the finding that some common gene variants have been found that are more frequent in both autism and SLI
650
THOMAS, KNOWLAND, AND KARMILOFF-SMITH
(Vernes et al., 2008); (g) a larger number of parallel connections produced more powerful learning when pruning operated normally but increased the risk of regression when pruning was overaggressive. This would provide an explanation of why larger brain size is correlated with greater intelligence in the typically developing population but is also associated with increased risk of autism (McDaniel, 2005; Redcay & Courchesne, 2005). Large brain size would not be a cause of autism, as some have claimed, but merely a risk factor for overaggressive pruning; (h) an extremely impoverished learning environment exaggerated the risk that regression would occur in a low-risk population, because in such an environment, networks developed small connections that were more at risk of pruning. Such regression was milder and with better prognosis for recovery. This would explain why Rutter et al. (1999, 2007) identified a condition of “quasi-autism,” affecting some but not all children exposed to extreme physical and social deprivation while in Romanian orphanages. Finally, (i) supporting the contention that overaggressive pruning might also underlie the broader autism phenotype, we found that if pruning commenced early, or development was delayed for other neurocomputational reasons, overaggressive pruning could result in patterns of delay, plateau, or failure to develop. The proposed mechanistic explanation of developmental regression reconciles a number of disparate and sometimes paradoxical findings. It reconciles how cognitive abilities can decline after the onset of development; how the decline can occur while an adaptive mechanism, which is always seeking to improve the child’s adaptive fit to his or her environment, continues to operate; and how the cognitive system can then show some level of recovery. It reconciles how regression in autism can have late onset yet have nothing to do with environmental factors (such as parenting): In the highrisk population with normal environmental variation, there was little effect of variations in experience. It is worth noting that the presence of recovery following regression is less easy to explain than one might imagine: How can an atypical process with a late onset be severe enough to cause an overt decline in behavior yet then allow the cognitive system to exhibit recovery— has the atypical process suddenly ceased to operate? The current hypothesis has a straightforward explanation of recovery in these children. Overaggressive pruning removes connections that encode established behaviors, so causing the decline. But eventually, all connections that fall beneath the pruning threshold will have been pruned. The cognitive system can then use those that remain to acquire abilities as best it can. Importantly here, in our simulations, the atypical mechanism causing the decline in behavior never ceased to operate—once activated, pruning was active through each network’s life span—yet in many cases recovery followed regression nonetheless. The model reconciles paradoxical findings, in particular demonstrating how a neurocomputational parameter can be positively correlated with outcome in the typically developing population but negatively correlated with outcome in a developmentally disordered population.
Biological Mechanisms and Heritability Although the causal process underlying developmental regression in autism is currently unknown, there has already been speculation that gene-based mechanisms may impair the anatomical remodeling of the brain, altering synaptic growth and pruning
during the second year of life (Baird et al., 2008; Carper & Courchesne, 2005). In the broader autism phenotype, hypotheses concerning synaptic pruning and remodeling are being investigated via genetic disorders of known cause that show elevated incidence of the symptomatology of autism, such as Rett and Fragile X syndromes (Glaze, 2004; Kelleher & Bear, 2008). Although ASDs show high heritability (see Ronald & Hoekstra, 2011, for a review), a large percentage of this heritability remains unaccounted for, with candidate genes explaining little phenotypic variability in genome-wide association studies. The majority of cases of autism are believed to result from probabilistic genetic interactions, with multiple common variants of small effect contributing marginally to the behavioral phenotype (Abrahams & Geschwind, 2008). However, around 10%–20% of cases can be accounted for by known genetic effects, including (transmitted or de novo) medium-effect mutations or copy number variations (Sebat et al., 2007). Continued discoveries of specific mutations (Awadalla et al., 2010; O’Roak et al., 2011) suggest that estimates of their contribution to heritability may be adjusted in the future. The complex genetic picture raises the important question of how a large number of single mutations, or the interplay between many common variants, can each give rise to a very similar phenotype; for although a great deal of behavioral heterogeneity is seen in autism, the diagnostic commonality between individuals suggests a common underlying cause. If cases with different genetic causes share a neurobiological basis, then that process, anomalous in autism, must rely on a wide variety of genes that also contribute to typical development. Atypical pruning is a plausible candidate mechanism from this perspective. Courchesne et al. (2007) noted that although there has been speculation that the cause of autism lies at the synapse (Garber, 2007), there have been few quantitative studies that have investigated cortical synapses in children with autism. The regulation of synaptic function depends on potentially thousands of genes (Rouleau, 2011), the expression of which is likely to change most dramatically during developmental periods of modifications in synaptic structure. Many of the genes identified as being associated with autism are also known to be involved in the regulation of synaptic function, or to control the expression of these genes. For example, in individuals with an ASD, transmitted or de novo mutations have been found in a number of genes that are involved in synaptogenesis, neurotransmitter release, or pruning, including Synapsin 1 (Fassio et al., 2011), SynGAP1 (Hamdan et al., 2011), SHANK3 (Bozdagi et al., 2010; Durand et al., 2006), and NLGN4 (Laumonnier et al., 2004); moreover, some of these are X-linked (Fassio et al., 2011; Piton et al., 2010). The current proposal implicates the pruning of connectivity as the common causal pathway and also the mechanism by which both risk and protective factors can operate. The model is consistent with a genetic account in which variation in risk and protective factors is the result of the common gene variants, whereas the cause of overaggressive pruning may either be the accumulation of risk from common variants (as in the low-risk population; see Table 1) or the targeting of this process via mutations that increase population risk (as in the high-risk population). Because in this view the risk factors and the cause of overaggressive pruning can in principle be inherited independently, this predicts that some biological markers of autism may be observed in siblings or other individuals who nevertheless do not present with the disorder.
MODELING REGRESSION IN AUTISM
Such a pattern has been observed both for common gene variants (Scott-Van Zeeland et al., 2010) and for variations in white matter structure (Barnea-Goraly, Lotspeich, & Reiss, 2010). Similarly, the model predicts that if brain size is a risk factor and independently heritable from the direct cause of autism, siblings of affected individuals may also show larger than average brain size; but in this case, without overaggressive pruning, our model predicts that it should persist in siblings across development. This remains to be verified empirically.
Modeling Limitations As with all modeling, the work presented here has some limitations. Theoretically, several of the findings depend on the assumption that regression indexes mechanisms at work also in the broader autism phenotype. Although our results support the viability of this link, regression could of course constitute a subtype, requiring a separate mechanistic explanation of the broader phenotype. Additionally, the current proposal is that in regression, autistic symptoms have later onset because they do not emerge until pruning begins. This would predict that phases of development prior to regression should be normal, but whether early development is indeed normal prior to regression is the subject of continuing debate (Luyster et al., 2005; Pickles et al., 2009; Wilson, Djukic, Shinnar, Dharmani, & Rapin, 2003). In terms of the simulations themselves, the modeling is both abstract and high level. Although we used a computational architecture that has been employed in a number of models of cognitive development, it obviously bears only an analogous relationship to the properties of actual neural circuits. For example, we did not simulate the early phase of synaptogenesis (the growth of connections). Other constructivist neural network models would be required to investigate the possibility of anomalies in this earlier phase (Shultz, 2003). Moreover, as mentioned earlier, in real neural circuits, pruning itself is a change in the balance of two concurrent processes of synapse formation and elimination (Hua & Smith, 2004). The model used the supervised learning algorithm of backpropagation, which is only indirectly biologically plausible (see Thomas & McClelland, 2008, for discussion). And we relied upon the metric of connection size to determine whether a connection was unused. In neural circuits, it is possible to conceive of other properties guiding pruning, such as how recently or often a synapse has been utilized. Furthermore, in common with all accounts that posit the cause of autism as a low-level computational anomaly, it remains to be demonstrated why such an anomaly should lead to the particular triad of deficits in communication, socialization, and a restricted repertoire of behaviors that seem to be syndrome-specific to autism. The assumption is usually that these cognitive domains must rely on the computational property that is compromised in autism, but this remains to be demonstrated. In the case of a pruning account, one might posit that the pruning process differentially affects different types of connections. If the overaggressive pruning process particularly impacted long-range connectivity over short-range connectivity, then the current hypothesis would fit into existing (dis)connectivity hypotheses about autism and its associated cognitive formulations (e.g., Courchesne & Pierce, 2005; Happe´, 1999; Ozonoff et al., 1994; Rippon, Brock, Brown, & Boucher, 2007;
651
Williams & Casanova, 2010), which posit that the triad are cognitive domains that require the integration of nonlocally available cues or interactions between remote brain regions for the development of typical behavior. We described the learning problem employed in our simulations in abstract terms. The results indicated that internally consistent behaviors with high type frequency were more robust to regression than idiosyncratic/exceptional behaviors, even if the latter were highly practiced. Future simulations would need to incorporate features of target cognitive domains to show how they interact with compromised connectivity and lead to domain-specific phenotypic outcomes. Other low-level deficits should produce other phenotypic outcomes, such as global delay or language impairment. Lastly, any full account needs to consider the extended developmental trajectory, incorporating the adaptive response of the individual to changes in processing properties, proactive control of behavior, and emotional regulation (see Grossberg & Seidman, 2006, for a computational account of the latter).
Novel Predictions The model generates a prediction that is not found in any current theory of autism. Our central hypothesis is that regression is triggered by atypical synaptic pruning. In humans, data suggest that the timing of synaptic pruning is different across brain areas, with primary sensory and motor areas experiencing the earliest pruning, followed by temporal and parietal associative areas, and lastly frontal cortex (Huttenlocher, 2002; Huttenlocher & Dabholkar, 1997). Behaviors are not typically generated by the operation of a single brain area. Nevertheless, to the extent that behaviors rely differentially on certain brain areas, our prediction is that the order of appearance of the behavioral symptoms of autism should follow the onset of pruning in relevant brain areas. Thus, we hypothesize that sensory and motor anomalies should appear first. This novel prediction contradicts the usual claim that social deficits (e.g., in communicative eye gaze behavior) are the first overt symptoms to emerge in autism. It is likely that retrospective parental reports will be insufficiently sensitive to test our hypothesis, because very early sensory and motor anomalies may be subtle. Instead, prospective studies examining the early development of infants at risk for autism are better suited to probe for the earliest atypical behaviors for children who subsequently turn out to present with autism. Several such studies are underway, but it is premature to draw strong conclusions. The preliminary evidence, however, is suggestive. Rogers (2009) reviewed the findings to date from studies of infant siblings of children with autism, noting the surprising lack of overt behaviors at 6 months of age that would point to later autism and highlighting the actual presence of social behaviors in these infants, alongside atypicalities in other areas. Indeed, referring to findings from Bryson et al. (2007) on nine infants who subsequently developed autism, Rogers noted that the earliest atypicalities were in two areas: delayed motor development and unusual visual interest or reactivity to objects. Further data are required, but the indication is that deficits in sensory and motor behaviors may precede social impairments, consistent with the fact that pruning takes place earlier in the sensory and motor brain systems, and thus supporting our hypothesis.
THOMAS, KNOWLAND, AND KARMILOFF-SMITH
652 Intervention
Finally, are there any implications for intervention based on the hypothesis we have developed? Several types of intervention might be conceived that differ from those currently pursued in developmental disorder remediation approaches in general. Rather than target domain-specific deficits known to be part of a syndrome’s profile (e.g., social communication in autism), intervention might target very basic-level processes that subsequently have a cascading impact on domain-specific outcomes (KarmiloffSmith, 2009). These would include a very early behavioral intervention to enhance connectivity prior to the onset of pruning, a pharmacological intervention to lessen the severity of pruning, and very early visuo-motor training rather than focusing on communicative deficits. Baird et al. (2008) recently concluded that it was unknown whether regressive processes are influenced by environmental factors. Our simulations of autism showed that environmental stimulation had an asymmetric role: Although a very impoverished environment could elevate risk, a good environment was insufficient to prevent loss of function. However, we did not consider the possible effects of increased stimulation of at-risk systems. Turning to autism itself, a speculative and optimistic vision from our current simulations would be that risk status for aggressive synaptic pruning could be identified on the basis of genotype and a pharmacological intervention applied in early infancy to normalize the pruning process.
References Abrahams, B. S., & Geschwind, D. H. (2008). Advances in autism genetics: On the threshold of a new neurobiology. Nature Reviews Genetics, 9, 341–355. doi:10.1038/nrg2346 Awadalla, P., Gauthier, J., Myers, R. A., Casals, F., Hamdan, F. F., Griffing, A. R., . . . Rouleau, G. A. (2010). Direct measure of the de novo mutation rate in autism and schizophrenia cohorts. American Journal of Human Genetics, 87, 316 –324. doi:10.1016/j.ajhg.2010 .07.019 Baird, G., Charman, T., Pickles, A., Chandler, S., Loucas, T., Meldrum, D., . . . Simonoff, E. (2008). Regression, developmental trajectory and association problems in disorders in the autism spectrum: The SNAP study. Journal of Autism and Developmental Disorders, 38, 1827–1836. doi:10.1007/s10803-008-0571-9 Baird, G., Simonoff, E., Pickles, A., Chandler, S., Loucas, T., Meldrum, D., & Charman, T. (2006). Prevalence of disorders of the autism spectrum in a population cohort of children in South Thames: The Special Needs and Autism Project (SNAP). Lancet, 368, 210 –215. doi:10.1016/ S0140-6736(06)69041-7 Barnea-Goraly, N., Lotspeich, L. J., & Reiss, A. L. (2010). Similar white matter aberrations in children with autism and their unaffected siblings. Archives of General Psychiatry, 67, 1052–1060. doi:10.1001/ archgenpsychiatry.2010.123 Belmonte, M. K., Allen, G., Beckel-Mitchener, A., Boulanger, L. M., Carper, R. A., & Webb, S. J. (2004). Autism and abnormal development of brain connectivity. Journal of Neuroscience, 24, 9228 –9231. doi: 10.1523/JNEUROSCI.3340-04.2004 Ben Bashat, D., Kronfeld-Duenias, V., Zachor, D. A., Ekstein, P. M., Hendler, T., Tarrasch, R., . . . Ben Sira, L. (2007). Accelerated maturation of white matter in young children with autism: A high b value DWI study. NeuroImage, 37, 40 – 47. doi:10.1016/j.neuroimage.2007.04.060 Beversdorf, D. Q., Narayanan, A., Hillier, A., & Hughes, J. D. (2007). Network model of decreased context utilization in autism spectrum disorder. Journal of Autism and Developmental Disorders, 37, 1040 – 1048. doi:10.1007/s10803-006-0242-7
Bishop, D. V. M. (2006). Developmental cognitive genetics: How psychology can inform genetics and vice versa. Quarterly Journal of Experimental Psychology, 59, 1153–1168. doi:10.1080/17470210500489372 Bishop, D. V. M. (2010). Overlaps between autism and language impairment: Phenomimicry or shared etiology? Behavior Genetics, 40, 618 – 629. doi:10.1007/s10519-010-9381-x Bozdagi, O., Sakurai, T., Papapetrou, D., Wang, X., Dickstein, D. L., Takahashi, N., . . . Buxbaum, J. D. (2010). Haploinsufficiency of the autism-associated Shank3 gene leads to deficits in synaptic function, social interaction, and social communication. Molecular Autism, 1, 15. doi:10.1186/2040-2392-1-15 Bryson, S. E., Zwaigenbaum, L., Brian, J., Roberts, W., Szatmari, P., Rombough, V., & McDermott, C. (2007). A prospective case series of high-risk infants who developed autism. Journal of Autism and Developmental Disorders, 37, 12–24. doi:10.1007/s10803-006-0328-2 Carper, R. A., & Courchesne, E. (2005). Localized enlargement of the frontal cortex in early autism. Biological Psychiatry, 57, 126 –133. doi:10.1016/j.biopsych.2004.11.005 Cohen, I. L. (1994). An artificial neural network analogue of learning in autism. Biological Psychiatry, 36, 5–20. doi:10.1016/00063223(94)90057-4 Cohen, I. L. (1998). Neural network analysis of learning in autism. In D. J. Stein & J. Ludik (Eds.), Neural networks and psychopathology (pp. 274 –315). New York, NY: Cambridge University Press. doi:10.1017/ CBO9780511547195.012 Courchesne, E., & Pierce, K. (2005). Why the frontal cortex in autism might be talking only to itself: Local over-connectivity but long-distance disconnection. Current Opinion in Neurobiology, 15, 225–230. doi: 10.1016/j.conb.2005.03.001 Courchesne, E., Pierce, K., Schumann, C. M., Redcay, E., Buckwalter, J. A., Kennedy, D. P., & Morgan, J. (2007). Mapping early brain development in autism. Neuron, 56, 399 – 413. doi:10.1016/j.neuron .2007.10.016 Cowan, W. M., Fawcett, J. W., O’Leary, D. D. M., & Stanfield, B. B. (1984, September 21). Regressive events in neurogenesis. Science, 225, 1258 –1265. doi:10.1126/science.6474175 Davidovitch, M., Glick, L., Holtzman, G., Tirosh, E., & Safir, M. P. (2000). Developmental regression in autism: Maternal perception. Journal of Autism and Developmental Disorders, 30, 113–119. doi:10.1023/ A:1005403421141 Durand, C. M., Betancur, C., Boeckers, T. M., Bockmann, J., Chaste, P., Fauchereau, F., . . . Bourgeron, T. (2006). Mutations in the gene encoding the synaptic scaffolding protein SHANK3 are associated with autism spectrum disorders. Nature Genetics, 39, 25–27. doi:10.1038/ng1933 Fassio, A., Patry, L., Congia, S., Onofri, F., Piton, A., Gauthier, J., . . . Cossette, P. (2011). SYN1 loss-of-function mutations in autism and partial epilepsy cause impaired synaptic function. Human Molecular Genetics, 20, 2297–2307. doi:10.1093/hmg/ddr122 Folstein, S. E., & Mankoski, R. E. (2000). Chromosome 7q: Where autism meets language disorder? American Journal of Human Genetics, 67, 278 –281. doi:10.1086/303034 Fombonne, E., & Chakrabarti, S. (2001). No evidence for a new variant of measles-mumps-rubella-induced autism. Pediatrics, 108, E58. doi: 10.1542/peds.108.4.e58 Frazier, T. W., & Hardan, A. Y. (2009). A meta-analysis of the corpus callosum in autism. Biological Psychiatry, 66, 935–941. doi:10.1016/ j.biopsych.2009.07.022 Frith, C. D. (2003). What do imaging studies tell us about the neural basis of autism? In G. Bock & J. Goode (Eds.), Autism: Neural basis and treatment possibilities: Novartis Foundation Symposium 251 (pp. 149 – 176). Chichester, England: Wiley. doi:10.1002/0470869380.ch10 Garber, K. (2007, July 13). Autism’s cause may reside in abnormalities at the synapse. Science, 317, 190 –191. doi:10.1126/science.317.5835.190 Giedd, J. N., Blumenthal, J., Jeffries, N. O., Castellanos, F. X., Liu, H.,
MODELING REGRESSION IN AUTISM Zijdenbos, A., . . . Rappaport, J. L. (1999). Brain development during childhood and adolescence: A longitudinal MRI study. Nature Neuroscience, 2, 861– 863. doi:10.1038/13158 Glaze, D. G. (2004). Rett syndrome: Of girls and mice—lessons for regression in autism. Mental Retardation and Developmental Disabilities Research Reviews, 10, 154 –158. doi:10.1002/mrdd.20030 Goldberg, W. A., Osann, K., Filipek, P. A., Laulhere, T., Jarvis, L., Modahl, C., . . . Spence, M. A. (2003). Language and other regression: Assessment and timing. Journal of Autism and Developmental Disorders, 33, 607– 616. doi:10.1023/B:JADD.0000005998.47370.ef Grossberg, S., & Seidman, D. (2006). Neural dynamics of autistic behaviors: Cognitive, emotional, and timing substrates. Psychological Review, 113, 483–525. doi:10.1037/0033-295X.113.3.483 Gustafsson, L. (1997). Inadequate cortical feature maps: A neural circuit theory of autism. Biological Psychiatry, 42, 1138 –1147. doi:10.1016/ S0006-3223(97)00141-8 Hamdan, F. F., Daoud, H., Piton, A., Gauthier, J., Dobrzeniecka, S., Krebs, M. O., . . . Michaud, J. L. (2011). De novo SYNGAP1 mutations in nonsyndromic intellectual disability and autism. Biological Psychiatry, 69, 898 –901. doi:10.1016/j.biopsych.2010.11.015 Happe´, F. (1999). Autism: Cognitive deficit or cognitive style? Trends in Cognitive Sciences, 3, 216 –222. doi:10.1016/S1364-6613(99)01318-2 Hill, A. E., & Rosenbloom, L. (1986). Disintegrative psychosis of childhood: Teenage follow-up. Developmental Medicine & Child Neurology, 28, 34 – 40. doi:10.1111/j.1469-8749.1986.tb03827.x Hua, J. Y., & Smith, S. J. (2004). Neural activity and the dynamics of central nervous system development. Nature Neuroscience, 7, 327–332. doi:10.1038/nn1218 Huttenlocher, P. R. (2002). Neural plasticity: The effects of environment on the development of the cerebral cortex. Cambridge, MA: Harvard University Press. Huttenlocher, P. R., & Dabholkar, A. S. (1997). Regional differences in synaptogenesis in human cerebral cortex. Journal of Comparative Neurology, 387, 167–178. doi:10.1002/(SICI)1096-9861(19971020)387:2⬍167:: AID-CNE1⬎3.0.CO;2-Z Johnson, M. H., & Karmiloff-Smith, A. (1992). Can neural selectionism be applied to cognitive development and its disorders? New Ideas in Psychology, 10, 35– 46. doi:10.1016/0732-118X(92)90046-3 Just, M. A., Cherkassky, V. L., Keller, T. A., & Minshew, N. J. (2004). Cortical activation and synchronization during sentence comprehension in high-functioning autism: Evidence of underconnectivity. Brain: A Journal of Neurology, 127, 1811–1821. doi:10.1093/brain/awh199 Ka´rado´ttir, R., Hamilton, N. B., Bakiri, Y., & Attwell, D. (2008). Spiking and nonspiking classes of oligodendrocyte precursor glia in CNS white matter. Nature Neuroscience, 11, 450 – 456. doi:10.1038/nn2060 Karmiloff-Smith, A. (1998). Development itself is the key to understanding developmental disorders. Trends in Cognitive Sciences, 2, 389 –398. doi:10.1016/S1364-6613(98)01230-3 Karmiloff-Smith, A. (2009). Nativism versus neuroconstructivism: Rethinking the study of developmental disorders. Developmental Psychology, 45, 56 – 63. Kelleher, R. J., & Bear, M. F. (2008). The autistic neuron: Troubled translation? Cell, 135, 401– 406. doi:10.1016/j.cell.2008.10.017 Koshino, H., Kana, R. K., Keller, T. A., Cherkassky, V. L., Minshew, N. J., & Just, M. A. (2008). fMRI investigation of working memory for faces in autism: Visual coding and underconnectivity with frontal areas. Cerebral Cortex, 18, 289 –300. doi:10.1093/cercor/bhm054 Laumonnier, F., Bonnet-Brilhault, F., Gomot, M., Blanc, R., David, A., Moizard, M. P., . . . Briault, S. (2004). X-linked mental retardation and autism are associated with a mutation in the NLGN4 gene, a member of the neuroligin family. American Journal of Human Genetics, 74, 552– 557. doi:10.1086/382137 Lewis, J. D., & Elman, J. L. (2008). Growth-related neural reorganization and the autism phenotype: A test of the hypothesis that altered brain
653
growth leads to altered connectivity. Developmental Science, 11, 135– 155. doi:10.1111/j.1467-7687.2007.00634.x Lord, C., Shulman, C., & DiLavore, P. (2004). Regression and word loss in autistic spectrum disorders. Journal of Child Psychology and Psychiatry, 45, 936 –955. doi:10.1111/j.1469-7610.2004.t01–1-00287.x Luyster, R., Richler, J., Risi, S., Hsu, W. L., Dawson, G., Bernier, R., . . . Lord, C. (2005). Early regression in social communication in autism spectrum disorders: A CPEA study. Developmental Neuropsychology, 27, 311–336. doi:10.1207/s15326942dn2703_2 Mareschal, D., Johnson, M., Sirios, S., Spratling, M., Thomas, M. S. C., & Westermann, G. (2007). Neuroconstructivism: How the brain constructs cognition. Oxford, England: Oxford University Press. Mareschal, D., & Thomas M. S. C. (2007). Computational modeling in developmental psychology. IEEE Transactions on Evolutionary Computation (Special Issue on Autonomous Mental Development), 11, 137– 150. doi:10.1109/TEVC.2006.890232 McClelland, J. L. (2000). The basis of hyperspecificity in autism: A preliminary suggestion based on properties of neural nets. Journal of Autism and Developmental Disorders, 30, 497–502. doi:10.1023/A: 1005576229109 McDaniel, M. A. (2005). Big-brained people are smarter: A meta-analysis of the relationship between in vivo brain volume and intelligence. Intelligence, 33, 337–346. doi:10.1016/j.intell.2004.11.005 Melrose, R. J., Tinaz, S., Castelo, J. M. B., Courtney, M. G., & Stern, C. E. (2008). Compromised fronto-striatal functioning in HIV: An fMRI investigation of semantic event sequencing. Behavioural Brain Research, 188, 337–347. doi:10.1016/j.bbr.2007.11.021 Molloy, C. A., Morrow, A. L., Meinzen-Derr, J., Dawson, G., Bernier, R., Dunn, M., . . . Lord, C. (2006). Familial autoimmune thyroid disease as a risk factor for regression in children with autism spectrum disorder: A CPEA study. Journal of Autism and Developmental Disorders, 36, 317–324. doi:10.1007/s10803-005-0071-0 O’Roak, B. J., Deriziotis, P., Lee, C., Vives, L., Schwartz, J. J., Girirajan, S., . . . Eichler, E. E. (2011). Exome sequencing in sporadic autism spectrum disorders identifies severe de novo mutations. Nature Genetics, 43, 585–589. doi:10.1038/ng.835 Ozonoff, S., Strayer, D. L., McMahon, W. M., & Filloux, F. (1994). Executive function abilities in autism and Tourette syndrome: An information processing approach. Journal of Child Psychology and Psychiatry, 35, 1015–1032. doi:10.1111/j.1469-7610.1994.tb01807.x Pachou, E., Vourkas, M., Simos, P., Smit, D., Stam, C. J., Tsirka, V., & Micheloyannis, S. (2008). Working memory in schizophrenia: An EEG study using power spectrum and coherence analysis to estimate cortical activation and network behavior. Brain Topography, 21, 128 –137. doi: 10.1007/s10548-008-0062-5 Paus, T., Collins, D. L., Evans, A. C., Leonard, G., Pike, B., & Zijdenbos, A. (2001). Maturation of white matter in the human brain: A review of magnetic resonance studies. Brain Research Bulletin, 54, 255–266. doi:10.1016/S0361-9230(00)00434-2 Pickles, A., Simonoff, E., Conti-Ramsden, G., Falcaro, M., Simkin, Z., Charman, T., . . . Baird, G. (2009). Loss of language in early development of autism and specific language impairment. Journal of Child Psychology and Psychiatry, 50, 843– 852. doi:10.1111/j.14697610.2008.02032.x Piton, A., Gauthier, J., Hamdan, F. F., Lafrenie`re, R. G., Yang, Y., Henrion, E., . . . Rouleau, G. A. (2010). Systematic resequencing of X-chromosome synaptic genes in autism spectrum disorder and schizophrenia. Molecular Psychiatry, 16, 867– 880. doi:10.1038/mp.2010.54 Redcay, E., & Courchesne, E. (2005). When is the brain enlarged in autism? A meta-analysis of all brain size reports. Biological Psychiatry, 58, 1–9. doi:10.1016/j.biopsych.2005.03.026 Richards, T. L., & Berninger, V. W. (2008). Abnormal fMRI connectivity in children with dyslexia during a phoneme task: Before but not after
654
THOMAS, KNOWLAND, AND KARMILOFF-SMITH
treatment. Journal of Neurolinguistics, 21, 294 –304. doi:10.1016/ j.jneuroling.2007.07.002 Richler, J., Luyster, R., Risi, S., Hsu, W.-L., Dawson, G., Bernier, R., . . . Lord, C. (2006). Is there a “regressive phenotype” of autism spectrum disorder associated with the measles-mumps-rubella vaccine? A CPEA study. Journal of Autism and Developmental Disorders, 36, 299 –316. doi:10.1007/s10803-005-0070-1 Rippon, G., Brock, J., Brown, C., & Boucher, J. (2007). Disordered connectivity in the autistic brain: Challenges for the “new psychophysiology.” International Journal of Psychophysiology, 63, 164 –172. doi: 10.1016/j.ijpsycho.2006.03.012 Rogers, S. J. (2009). What are infant siblings teaching us about autism in infancy? Autism Research, 2, 125–137. doi:10.1002/aur.81 Ronald, A., & Hoekstra, R. A. (2011). Autism spectrum disorders and autistic traits: A decade of new twin studies. American Journal of Medical Genetics Part B. Advance online publication. Rouleau, G. (2011, April). Genomic studies in neurodevelopmental disorders. Paper presented at the conference Wiring the Brain: Making Connections, Powerscourt, County Wicklow, Ireland. Rutter, M., Anderson-Wood, J., Beckett, C., Bredenkamp, D., Castle, J., Goothues, C., . . . O’Connor, T. (1999). Quasi-autistic patterns following severe early global privation. Journal of Child Psychology and Psychiatry, 40, 537–549. doi:10.1111/1469-7610.00472 Rutter, M., Kreppner, J., Croft, C., Murin, M., Colvert, E., Beckett, C., . . . Sonuga-Barke, E. (2007). Early adolescent outcomes of institutionally deprived and non-deprived adoptees: III. Quasi-autism. Journal of Child Psychology and Psychiatry, 48, 1200 –1207. doi:10.1111/j.14697610.2007.01792.x Schumann, C. M., Bloss, C. S., Carter Barnes, C., Wideman, G. M., Carper, R. A., Akshoomoff, N., . . . Courchesne, E. (2010). Longitudinal magnetic resonance imaging study of cortical development through early childhood in autism. Journal of Neuroscience, 30, 4419 – 4427. doi: 10.1523/JNEUROSCI.5714-09.2010 Scott-Van Zeeland, A. A., Abrahams, B. S., Alvarez-Retuerto, A. I., Sonnenblick, L. I., Rudie, J. D., Ghahremani, D., . . . Bookheimer, S. Y. (2010). Altered functional connectivity in frontal lobe circuits is associated with variation in the autism risk gene CNTNAP2. Science Translation Medicine, 2, 56ra80. Sebat, J., Lakshmi, B., Malhotra, D., Troge, J., Lese-Martin, C., Walsh, T., . . . Wigler, M. (2007, April 20). Strong association of de novo copy number mutations with autism. Science, 316, 445– 449. doi:10.1126/ science.1138659 Shultz, T. R. (2003). Computational developmental psychology. Cambridge, MA: MIT Press. Simmons, D. R., McKay, L., McAleer, P., Toal, E., Robertson, A., & Pollick, F. E. (2007). Neural noise and autism spectrum disorders [Abstract]. Perception, 36(Suppl.), 119 –120. Siperstein, R., & Volkmar, F. (2004). Brief report: Parental reporting of regression in children with pervasive developmental disorders. Journal of Autism and Developmental Disorders, 34, 731–734. doi:10.1007/ s10803-004-5294-y
Stanfield, A. C., McIntosh, A. M., Spencer, M. D., Philip, R., Gaur, S., & Lawrie, S. (2008). Towards a neuroanatomy of autism: A systematic review and meta-analysis of structural magnetic resonance imaging studies. European Psychiatry, 23, 289 –299. doi:10.1016/j.eurpsy .2007.05.006 Stiles, J. (2008). The fundamentals of brain development. Cambridge, MA: Harvard University Press. Thomas, M. S. C., & Johnson, M. H. (2008). New advances in understanding sensitive periods in brain development. Current Directions in Psychological Science, 17, 1–5. doi:10.1111/j.1467-8721.2008.00537.x Thomas, M. S. C., & Karmiloff-Smith, A. (2002). Are developmental disorders like cases of adult brain damage? Implications from connectionist modelling. Behavioral and Brain Sciences, 25, 727–787. doi: 10.1017/S0140525X02000134 Thomas, M. S. C., Knowland, V. C. P., & Karmiloff-Smith, A. (2011). What causes variability in the severity of developmental disorders? A neurocomputational account using the example of developmental regression in autism. In E. J. Davelaar (Ed.), Connectionist models of neurocognition and emergent behavior: From theory to applications. London, England: World Scientific. Thomas, M. S. C., & McClelland, J. L. (2008). Connectionist models of cognition. In R. Sun (Ed.), Cambridge handbook of computational cognitive modelling (pp. 23–58). Cambridge, England: Cambridge University Press. Thomas, M. S. C., Ronald, A., & Forrester, N. A. (2011). Modelling associations between levels of description: What can gene-behaviour associations tell us about cognitive process? Manuscript submitted for publication. Vernes, S. C., Newbury, D. F., Abrahams, B. S., Winchester, L., Nicod, J., Groszer, M., . . . Fisher, S. E. (2008). A functional genetic link between distinct developmental language disorders. New England Journal of Medicine, 359, 2337–2345. doi:10.1056/NEJMoa0802828 Wass, S. (2011). Distortions and disconnections: Disrupted brain connectivity in autism. Brain and Cognition, 75, 18 –28. doi:10.1016/ j.bandc.2010.10.005 Werner, E., Dawson, G., Munson, J., & Osterling, J. (2005). Variation in early developmental course in autism and its relations with behavioural outcome at 3– 4 years of age. Journal of Autism and Developmental Disorders, 35, 337–350. doi:10.1007/s10803-005-3301-6 Williams, E. L., & Casanova, M. F. (2010). Autism and dyslexia: A spectrum of cognitive styles as defined by minicolumnar morphometry. Medical Hypotheses, 74, 59 – 62. doi:10.1016/j.mehy.2009.08.003 Wilson, S., Djukic, A., Shinnar, S., Dharmani, C., & Rapin, I. (2003). Clinical characteristics of language regression in children. Developmental Medicine and Child Neurology, 45, 508 –514. doi:10.1111/j.14698749.2003.tb00950.x
Received February 11, 2011 Revision received July 8, 2011 Accepted July 11, 2011 䡲