Cognitive, Affective, & Behavioral Neuroscience 2002, 2 (4), 283-299
Mechanisms underlying dependencies of performance on stimulus history in a two-alternative forced-choice task RAYMOND Y. CHO Princeton University, Princeton, New Jersey and University of Pittsburgh, Pittsburgh, Pennsylvania LEIGH E. NYSTROM and ERIC T. BROWN Princeton University, Princeton, New Jersey ANDREW D. JONES and TODD S. BRAVER Washington University, St. Louis, Missouri PHILIP J. HOLMES Princeton University, Princeton, New Jersey and JONATHAN D. COHEN Princeton University, Princeton, New Jersey and University of Pittsburgh, Pittsburgh, Pennsylvania In choice reaction time tasks, response times and error rates demonstrate differential dependencies on the identities of up to four stimuli preceding the current one. Although the general profile of reaction times and error rates, when plotted against the stimulus histories, may seem idiosyncratic, we show that it can result from simple underlying mechanisms that take account of the occurrence of stimulus repetitions and alternations. Employing a simple connectionist model of a two-alternative forcedchoice task, we explored various combinations of repetition and alternation detection schemes in an attempt to account for empirical results from the literature and from our own studies. We found that certain combinations of the repetition and the alternation schemes provided good fits to the data, suggesting that simple mechanisms may serve to explain the complicated but highly reproducible higher order dependencies of task performance on stimulus history.
The latency and accuracy of human responding in simple choice reaction time (RT) tasks have long served as important sources of data regarding the mechanisms underlying human cognitive performance (Luce, 1986; McClelland, 1979; Posner, 1978; Ratcliff, 1978; Ratcliff, Van Zandt, & McKoon, 1999; Sternberg, 1969). In particular, such data have been critical in the formulation of theories regarding the mechanisms responsible for monitoring performance and making necessary adjustments in cognitive control (Botvinick, Braver, Barch, Carter, & Cohen, 2001; Laming, 1979; Rabbitt & Rodgers, 1977). For example, following an error, subjects exhibit more cautious behavior, manifest as an increase in RT and accuracy. Such adjustments in behavior suggest the operation of mechaThis study was supported by National Institute of Mental Health Conte Center Grant P50MH62196. We thank Anika Binnendijk for valuable help in the collection of experimental data for this study. Correspondence concerning this article should be addressed to R. Y. Cho, Department of Psychiatry, University of Pittsburgh, 3811 O’Hara St., Pittsburgh, PA 15213 (e-mail:
[email protected]).
nisms responsible for the monitoring of performance and the strategic adjustment of cognitive control. Computational models have recently been proposed that describe the specific mechanisms underlying monitoring and control (Botvinick et al., 2001; Yeung, Botvinick, & Cohen, 2002). A central feature of these models is that the degree of conflict in processing is an important signal of the need for adjustments in control. Conflict occurs when two mutually incompatible response alternatives compete for expression. This competition slows processing and lends uncertainty to its outcome, thus degrading performance. This can be rectified by increasing the allocation of cognitive control to the processes underlying task performance (e.g., Cohen, Dunbar, & McClelland, 1990). Thus, monitoring of processing conflict can be used to adaptively allocate cognitive control. Models that incorporate a mechanism for conflict monitoring and use this to drive the allocation of control accurately simulate adjustments in performance that are observed in a variety of cognitive tasks (Botvinick et al., 2001).
283
Copyright 2002 Psychonomic Society, Inc.
284
CHO ET AL.
One task factor that seems to strongly influence both performance and control is stimulus history. For example, regular patterns (such as stimulus repetition or simple alternation) produce progressive improvements in performance, whereas the violation of such patterns produces poor performance (Bertelson, 1961; Hyman, 1953; Kornblum, 1967; Laming, 1968; Remington, 1968; Soetens, Boer, & Hueting, 1985). Such degradation is presumed to be due to conflict between the expected and the actual stimuli. Importantly, such violations (and concomitant conflict) are followed by improvements in performance on subsequent trials (Laming, 1979) that are thought to reflect the strategic allocation of cognitive control (Botvinick et al., 2001). However, to date, models of conflict monitoring and cognitive control have not incorporated mechanisms that are sensitive to stimulus history and thus have been unable to directly address the influence of this factor on conflict monitoring, cognitive control, and overt behavior. The purpose of this study was to identify plausible mechanisms for encoding stimulus history that can be incorporated into models of performance in simple choice RT tasks. In this paper, we focus on the ability of such mechanisms to predict performance, without taking into account the effects of conflict monitoring or cognitive control. In related work, we use the mechanisms developed here to address interactions between stimulus history (such as frequency effects) and mechanisms responsible for conflict monitoring and cognitive control (Jones, Cho, Nystrom, Cohen, & Braver, 2002). We begin by briefly reviewing what is known about the influence of stimulus sequence on performance. We then consider several simple mechanisms that could account for such effects and assess their ability to predict human performance in simple twoalternative forced-choice (2AFC) tasks. The effects of stimulus sequence on the performance on choice RT tasks were originally characterized by examining first-order relationships—that is, those limited to the influences of the trial just previous to the current one. In choice tasks with two alternatives, first order effects arise from either repetitions or alternations, and with more than two choices, from repetitions or nonrepetitions (the possibility of nonrepetitions with more than two stimuli will henceforth be implied by any mention of alternations). A natural extension is to investigate higher order effects that extend further back into stimulus histories. Varying the permutations of up to four preceding stimuli has been shown to have systematic effects on RTs and error rates (ER; Kirby, 1976; Remington, 1968; Soetens et al., 1985). Dependencies on recent stimulus history can explain much of the variability in performance even of tasks involving the learning of regularly structured sequences, where significant trial-to-trial effects owing to stimulus repetitions and alternations are observed, independent of those sensitive to the experimenter-determined regularities in the stimulus orderings (Cleeremans, 1993). Indeed, the broad range of conditions under which these sequential dependencies are observed suggests a potential relevance to all experimental paradigms involving local variations in the orderings of stimulus presentation.
Explanations of sequential effects have been divided broadly into two types: facilitation and expectancy (Luce, 1986). Facilitation is thought to involve a low-level mechanism by which past presentations of a particular stimulus augment the processing of its recurrence (e.g., Kirby, 1976); in other words, facilitation favors repetitions. Facilitation is thought to predominate at short response– stimulus intervals (RSIs), in keeping with the notion that it involves automatic activation of a trace that fades at longer RSIs. In contrast, expectancy effects are attributed to higher level strategic processes that set up expectations for either repetitions or alternations and may require a minimum time to establish (Vervaeck & Boer, 1980), thus influencing task performance at longer RSIs.1 Although invoking such notions as facilitation and expectation may aid in understanding the generally monotonic relationships2 between the numbers of prior repetitions and alternations and the associated RTs and ERs, it is unclear how they would explain the complex pattern of higher order effects observed in the data (see Figure 1). The reproducibility of many of these effects across studies suggests that they are not simply idiosyncrasies of particular datasets but, rather, that they reflect the operation of specific sequence detection mechanisms. In one of the first analyses of higher order effects, Laming (1968) performed a multiple regression to assess the impact of stimulus identities on task performance at incremental steps in the trial history. Repetition and alternation effects were inferred from regression coefficients and the behavioral data, but without proposing what basic mechanisms might give rise to these sequential effects. Falmagne, Cohen, and Dwivedi (1975) proposed a more mechanistic account based on Markov chains. In their model, the orderings of comparisons of newly presented stimuli with stored representations of each stimulus were dependent on the identity of the penultimate stimulus. However, this model required the adjustment of numerous parameters to provide an adequate fit to the empirical data. Thus, although previous models have offered reasonable fits to data, they have lacked in either mechanistic detail or parsimony. In this article, we consider the possibility that the pattern of RT and ER effects observed in response to sequences of stimuli may reflect the operation of relatively simple mechanisms that respond only to highly local regularities (e.g., the relationship of the current stimulus to the immediately preceding one). On this account, the complexity of the observed effects would result from the interaction of these simple mechanisms as they respond to different sequences of stimuli. There are several possible schemes by which simple repetition and alternation detectors might operate. For example, given a sequence involving two stimuli—for example, 1112212—there are at least two ways in which repetitions may be detected and influence performance. One scheme would simply track single occurrences of a stimulus, perhaps mediated by residual activation of the representation of that stimulus (akin to facilitation, as was discussed above). In this case, the fourth 1 would by itself increase the tendency to respond 1 in the next trial. The first three
MODEL OF SEQUENTIAL DEPENDENCIES
285
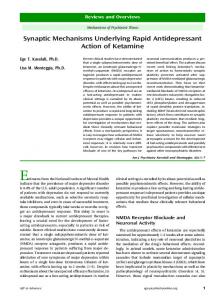
Figure 1. Human subject median reaction times (RTs) and error rates (ERs) over varying stimulus histories at long response–stimulus intervals (RSIs): (A) Soetens, Boer, and Hueting (1985), Figure 2; (B) present study; (C) Jones, Cho, Nystrom, Cohen, and Braver (2002). RSIs for the three studies were 1,000, 800, and ~900 msec (estimated from interstimulus intervals), respectively. Noted along the abscissa are all of the possible five-stimulus-long sequences; each sequence, read from top to bottom, proceeds from the earliest stimulus progressively toward the present stimulus. For example, RRAR could represent sequences 11122 or 22211. The first-order trends are similar across the data sets. However, the greatest similarity is between data collected for the present study and those presented in Soetens et al.; the differences in some of the higher order variations in Jones et al. may be due to subtle influences from their choice of stimulus–response mappings (many to one for one alternative and one to one for the other) and asymmetric stimulus probabilities employed in other blocks of their experiment (the data presented here are based on symmetric probabilities, as in panels A and B).
1s would produce a greater tendency to respond 1, not because they were repetitions per se, but because of the accumulated effects of each 1’s individually priming for another 1. A different scheme accounting for repetition effects might base facilitation on first-order transitions, requiring a detection of two consecutive occurrences of the same stimulus. In our example, the first two 2s would produce a bias toward another 2 response, but the third 2, lacking a pairing with a preceding 2, would not do so. Similarly, there are a variety of means by which alternations could be detected and used to prime subsequent ones. Given the variety of mechanisms that are possible for the detection of even simple patterns of repetition and alternation and the potential complexity of their interactions, the effects that these mechanisms may have on behavior are not immediately obvious. Our aim in this study was to explore these effects by explicitly implementing an array of simple detection devices, incorporating these into an existing model of responding in a 2AFC RT task and then examining the behavior of the model as a function of different stimulus sequences. By so doing, we hoped to determine whether the combinations of simple repetition and alternation detectors could account for the complex pattern of findings observed in empirical studies and, if so, which combinations of mechanisms were most successful. Our target empirical data were taken from an example in the literature, Soetens et al. (1985) and from ex-
periments of our own, which consistently exhibited similar first-order and higher order repetition and alternation effects. We focused on data from the longer RSI conditions of these studies, since it was in this regime that both repetition and alternation effects appeared in a robust, regular fashion, providing a more straightforward initial test of our models. Also, following the tendency of most previous studies in which sequential effects have been examined, we based our analyses on stimulus, and not response, histories. OVERVIEW OF MODEL We based our model on the architecture used by Usher and McClelland (2001) for simulating behavior in a 2AFC task. This model involves leaky, stochastic, nonlinear accumulation of activation in two mutually inhibitory decision units and successfully captures many important statistical properties of subjects’ RTs and error distributions within single trials (Usher & McClelland, 2001). However, this model does not address sequential effects observed from one trial to the next. That is, there is no component of the Usher and McClelland model that performs a stimulus-history–dependent biasing of processing in favor of one stimulus or the other. Our contribution was to add a component to the model that performs stimulus-history–dependent biasing. This
286
CHO ET AL.
component responds to local occurrences of repetitions and alternations in the stimulus sequence and primes the decision units in the network accordingly. This has the effect of changing the initial conditions from which the decision units’ activities evolve when the next stimulus is presented, thus producing modulations in the RTs and ERs that are dependent on the identities of the preceding stimuli. We then explored the extent to which the accrual of these biases, across trials, could account for the empirical data concerning such sequence effects. Particular pairings of repetition and alternation detection schemes were explored with regard to their ability to fit the empirical data, in order to evaluate whether such an approach can be fruitful in revealing simple mechanisms that underlie complex higher order variations in the observed data. The method of this study not only helps in determining plausible mechanisms underlying sequential effects in simple choice RT tasks, but also suggests a general approach for examining sequential dependencies in any tasks in which such effects play a prominent role in the trial-to-trial dynamics. The advantage of such mathematical models is that their assumptions must be clearly formulated and that conclusions regarding their behavior follow rigorously from these assumptions. This makes them clearly refutable and, sometimes, provably adequate, if not provably correct (for other models may lead to the same behavior). Verbal models rarely offer such clarity. Another important benefit is that once the sequence effects in a task are characterized, other factors influencing performance can then also be better understood, particularly if they are known to interact with such dependencies on stimulus history. We have taken this approach, for example, by incorporating the most successful of the repetition– alternation detection combinations of this paper into an augmented model, to explore mechanisms of conflict monitoring and cognitive control (Botvinick et al., 2001; Carter et al., 1998) in 2AFC task performance (Jones et al., 2002). METHOD First, we will describe the experimental method used in our replication of the empirical sequential effects. Then, we will describe the general form of the Usher and McClelland (2001) model of the 2AFC task and will detail the different repetition and alternation detection methods we added to their model to produce the sequential dependencies of RTs and ERs. In the final section, we will provide the details of the actual simulations performed. Our collected data, together with those of Soetens et al. (1985) and Jones et al. (2002; see Figures 1B, 1A, and 1C, respectively), make up the empirical dataset with which we optimize parameter fits, employing the methods of the final section. Experimental Method Subjects Six Princeton University undergraduates (3 male, 3 female; ages, 18–21) participated in the study in exchange
for partial fulfillment of a course requirement. Each subject gave informed consent in accordance with the Institutional Review Panel for Human Subjects at Princeton University. Task Design and Procedure The task was modeled after the 2AFC tasks of Laming (1968), substituting an upper- or lowercase “o” character (1.28 or 0.97 cm tall, respectively) for Laming’s tall or short rectangles. The two stimuli were presented in a random order, with the constraint that each stimulus should appear with equal frequency in each series of trials. The subjects viewed stimuli displayed in white on a black background in the center of an Apple Macintosh monitor, at a distance of approximately 60 cm, using the Psyscope experimental presentation software (Cohen, MacWhinney, Flatt, & Provost, 1993). The subjects were told to press one of two response keys with their index fingers whenever they saw the “o” and the other key with their middle fingers for the “0.” They were instructed to respond as quickly and accurately as possible. The stimuli remained on the screen until a response was made, up to a maximum time limit of 2,000 msec. The only performance feedback given was a beep sound to indicate any buttonpress and a buzzing sound to warn the subjects if they have failed to respond within the allowable 2,000-msec limit. Following each buttonpress, the next stimulus appeared after a delay (RSI) of 800 msec. After each series of 120 trials, the subjects were allowed a short break; 13 series of 120 trials were collected from each subject, for a total of 1,560 trials. Model of the 2AFC Task Usher and McClelland’s (2001) model of the 2AFC task uses two decision units whose respective activations represent the propensity for producing one response or the other. Each unit’s activation is influenced by passive decay, inhibition by activation of the other unit, input activation once a stimulus is presented, and a noise term that is responsible for the variability in RTs, as well as for producing errors in performance. All these effects are summarized by the following set of stochastic differential equations:
and
dx1 = - kx1 - bf ( x 2 ) + r1 + x1 dt
(1) dx 2 = - kx2 - bf ( x1 ) + r 2 + x2 , dt where xi is the state of unit i 5 1 or 2, k represents passive decay, b is the mutual inhibition term, f is the activation function3 for both units, which takes the form f (xi ) 5 1/{1 1 exp[2G(x 2 d )]} with a gain (G ) and offset (d), ri represents the nonnegative input stimuli, and xi represents the uncorrelated noise terms (formal derivatives of Wiener processes with zero mean, variance s 2t). This network, similar in many respects to the cascade model of McClelland (1979), implements a mixed deterministic drift-random diffusion process in which each unit moves
MODEL OF SEQUENTIAL DEPENDENCIES toward threshold at a rate determined by the relative input strengths and is also influenced by noise. The values of the inputs r1 and r2 are fixed such that r1 1 r2 5 1. The simulated response is determined by the first unit to reach a fixed threshold—that is, xi 5 q —or equivalently, when f (xi ) 5 f(q ); the corresponding RT is the time (number of iterations of our numerical integrator) at which this threshold is crossed. We chose this as our basic framework, since it had compared favorably with other models based on independent, nonleaky accumulation of activation and a response criterion based on activation differences instead of absolute thresholds (Usher & McClelland, 2001). Further motivations for this architecture are detailed in Usher and McClelland, with an in-depth analysis of the within-trial dynamics provided by Brown and Holmes (2001). Sequence Detection General Description To realize effects of stimulus history, we add separate bias terms, bi, to each decision unit in Equation 1: dx1 = - kx1 - b f ( x 2 ) + r1 + x1 dt and
(2) dx2 = - kx2 - b f ( x1 ) + r 2 + b2 + x2 . dt In our simulations, we divide each trial into a preparatory period and a response period. During the preparatory period, the units’ activations evolve in the absence of any stimulus inputs, r i: they are driven only by biases, b i ( Equation 2, with r1 5 r2 5 0). Thus, in the absence of input from the sequence detectors, bi will decay from trial to trial, implementing a fading memory of prior effects. The duration of this period represents the task RSI,4 whereas the subsequent response period models the portion of the trial during which the stimulus is actually presented by adding inputs ri (Equation 2, with r1 randomly assigned 0.85 or 0.15 for a given trial and r2 5 1 2 r2 ; see the Simulations and Parameter Fitting section below ). The biases bi remain fixed during the preparatory and response periods and are discretely updated following each trial. Updating occurs by adding inputs from the sequence detectors (see below) to a fraction of the biases’ current values. We explored six possible schemes for updating bi , with three types of repetition detectors and three types of alternation detectors. They further divide into two classes: (1) individual, in which there is a separate repetition and alternation detector for each of the decision units, and (2) shared, in which a single repetition and alternation detector is shared by both decision units. Detectors are also distinguished by whether they depend solely on the identity of the previous trial’s stimulus (one-back) or on the identities of the two stimuli just preceding the current one (two-back). All the schemes emphasize more recent events by the use of exponentially weighted averages.
287
We first will give a brief overview of each type of detector, followed by more precise formal descriptions, and will provide diagrammatic depictions to aid the reader in distinguishing how each respective scheme first detects repetitions or alternations (Table 1) and then, subsequently, biases the decision units accordingly (Figure 2). Individual Detectors Individual repetition, one-back (IR1). A simple repetition detector5 that increases b1 following every occurrence of stimulus 1, with no input to b2 (and conversely for b2 following stimulus 2). Individual repetition, two-back (IR2). A strict repetition detector that increases b 1 only following two (or more) sequential occurrences of stimulus 1, with no input to b2 (and conversely for b2 following stimulus 2). Individual alternation, one-back (IA1). A simple alternation detector exactly analogous to IR1, but that increases b2 following every occurrence of stimulus 1, with no input to b1 (and conversely for b1 following stimulus 2). Individual alternation, 2-back (IA2). A strict alternation detector that increases b1 only after the sequence 12, with no input to b2 (and conversely for b2 following the sequence 21). To implement these detector types, four separate running tallies are maintained as b R1 , b R2 for repetitions and b 1A, b 2A for alternations. At the end of each trial, each decision unit bias bi is increased by an amount proportional to b Ri plus b Ai . Shared Detectors Shared repetition, two-back (SR2). A strict repetition detector that increases its tally for any repeat (e.g., the sequence 11 or 22) and then increases only the bi for the decision unit corresponding to the most recent stimulus. Shared alternation, two-back (SA2). A strict alternation detector that increases its tally for any alternation (e.g., the sequence 12 or 21) and then increases only the bi for the decision unit corresponding to the opposite of the most recent stimulus. To implement these detector types, only two running tallies are maintained, b R and b A. At the end of each trial, only the bi for the decision unit corresponding to either the repeat or the alternation is updated. Figure 2 further describes schematically how bias units are updated with each respective method of detecting repetitions and alternations. The changes made to each bias bi for the individual and shared detectors are more precisely defined as follows. For individual detectors, bi (n + 1) = b Ri (n + 1) + b iA (n + 1), where R b iR (n + 1) = l b iR ( n ) + (1 - l )bmax f Ri ( n )
and
(3) b iA ( n + 1) =
l b Ri ( n ) + (1 -
A l )bmax
f
A i (n ).
288
CHO ET AL. Table 1 Repetition and Alternation Detection Schemes Sample Stimulus History Detection Scheme Individual IR1
IR2
IA1
IA2
Shared SR2
Unit
1
1 2 1 2 1 2 1 2 1 2 1 2 1 2 1 2
x
0 0
0 0
x 1 0
1 2
0 0
1 2
0 0
0 0 x 0 0
0 0 x 1 0
0 0
0 0 x 0 0
SA2
2
1
2
1
1
1
x
x
x
2 2
3 2 x
4 2 x
0 0
0 0
1 0
x 2 2
x 2 3
x 2 4
1 1
x 2 1
2 2
2 2
0 0 x 1 1
0 0 x 2 1
x 0 0
x 1 0
2 2
2 2
x x 1 0
0 0 x 0 1 x
1 1
0 0 x 1 1
x 2 1
0 0 x 1 2 x
2
2
2
x 5 2
x 5 3
x 5 4
2 0 x
x 2 0 x
x 2 1 x
2 5 x
3 5
4 5
2 2
3 2
3 2
x 2 0
x 2 1
3 2
3 2
2 0 x 2 2
Note—Shown are the responses of each of the various detection schemes to the stimulus history “. . .1212111222.. . .” The xs denote detections ( f iR,A (n) 5 1; see the Method section) for the respective schemes. The resulting biases are then updated as defined by Equations 3 and 4 prior to the next trial. Running tallies of the applications of these biases are shown below the respective rows of xs; the tally for the appropriate unit is incremented on trial n 1 1 each time the scheme makes a detection on trial n. Note that for the individual unit based schemes, there is a separate detector for each of the two units; for the shared detection schemes, only one unit is responsible for the detection of either repetitions or alternations, respectively.
R and A stand for repetitions and alternations, respectively, l is the exponential decay parameter with value between 0 and 1, bmax is a scaling parameter, and f i (n) is the function that updates the bias for unit i, to be described below. For shared detectors, ìb R ( n + 1) if r i ( n ) > 0.5ü bi ( n + 1) = í A ý, îb ( n + 1) if r i ( n ) < 0.5þ
bias terms, since there is only one repetition detector and one alternation detector shared by both the decision units. Formal Descriptions of the Sequence Detectors f (n) Here, we describe each of the sequence detectors in greater detail and work through the sample stimulus history given in Table 1 to illustrate the workings of each detector type.
A b A ( n + 1) = l b A (n ) + (1 - l )bmax f A ( n ).
Individual Detectors Repetition detectors. IR1. This implements simple facilitation, with each occurrence of a stimulus acting individually as evidence for recurrence of the same stimulus in subsequent trials. This form of priming is tantamount to a self-excitatory connection for each decision unit:
In this case, the first expression denotes the fact that all of the bias accrued for repetitions is directed toward the decision unit whose identity is the same as the stimulus that was presented in the previous trial and similarly that all of the bias accrued in evidence of alternations is directed toward the unit whose identity is opposite to that of the stimulus presented in the previous trial. Note that the second expression in Equation 4 lacks a subscript for the
ì1 if r i ( n ) > 0.5 ü f Ri (n ) = í (IR1) ý. î0 if ri ( n ) < 0.5þ In Table 1, we see that for IR1, decision units 1 and 2 each has its own repetition detector and that each separately detects an occurrence of the respective stimuli (marked by xs). The repetition detector for unit 1 detects an occurrence of stimulus 1 at the first, third, fifth, sixth,
where R b R (n + 1) = l b R ( n ) + (1 - l )bmax f R (n)
(4)
and
MODEL OF SEQUENTIAL DEPENDENCIES
289
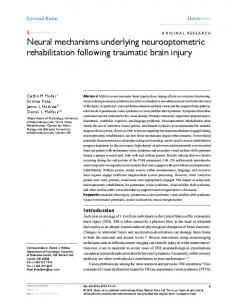
Figure 2. Bias updating protocol. Shown is a schematic of Equations 3 and 4, detailing how biases are updated for each trial. For individual biasing, the first row shows the various detection schemes (IR1, IR2, IA1, and IA2), and the second row shows the required stimulus history to elicit a detection by the respective schemes. All possible cases are shown, and the arrows point to the specific bias that is incremented as a result of a detection. For example, IA2 would increment b1(n) if the last two stimuli were . . .12. A similar format is used for shared biasing. Here, SR2 and SA2 detect repetitions and alternations, respectively, over the last two trials. The specific bias that is incremented depends on the identity of the present stimulus, as is illustrated. For example, SA2 would detect an alternation with the stimulus history . . .12 and increment b 1(n).
and seventh points in the stimulus history, and the repetition detector for unit 2 accordingly detects occurrences of stimulus 2 at all other points. To make explicit which units actually receive the resultant increments in bias, Table 1 includes running tallies of the applications of these biases (shown below the respective rows of xs); the tally for the appropriate unit is incremented on trial n each time the scheme makes a detection on trial n 2 1. IR2. This detects immediate repeats of a stimulus, requiring a comparison of the stimulus identities of trials n and n 2 1: ì1 if r i ( n ) > 0.5 and r i (n - 1) > 0.5ü f Ri (n ) = í ý. (IR2) î0 otherwise þ
In our sample history of Table 1, there are no consecutive occurrences of stimuli until S 5 1 is presented in the fifth and sixth trials, when the repetition detector for unit 1 correctly records its first repetition. Another repetition is detected on the seventh trial as stimulus 1 is presented again. Two similar detections of repetitions are made subsequently by unit 2. Alternation detectors. IA1. This has exact symmetry with IR1, with each occurrence of a stimulus acting indi-
vidually as evidence for an occurrence of the alternate stimulus in subsequent trials: ì1 if r i (n ) < 0.5 ü f Ai ( n ) = í (IA1) ý. î0 if r i (n ) > 0.5 þ In Table 1, we see that for IA1, both the detections and the running tallies of bias applications are exactly symmetrical to those for IR1. This symmetry suggests that IR1 and IA1 are a priori incompatible as a possible combination of repetition and alternation detectors, since their effects would cancel each other. However, each can be combined with others of a different type. IA2. This detects an immediate alternation in the two preceding stimuli: ì1 if r i ( n ) > 0.5 and r i ( n - 1) > 0.5ü f Ai ( n ) = í ý. (IA2) î0 otherwise þ Here, the alternation detector for unit 1 records an alternation on the second trial, since stimulus 2 is preceded by stimulus 1. This increases the bias for decision unit 1. Similarly, the next stimulus elicits a detection by the alternation detector for unit 2, since stimulus 1 is preceded by stimulus 2. This increases the bias for decision unit 2.
290
CHO ET AL.
This pattern continues until the alternations cease, interrupted by a short run of repetitions of stimulus 1. The last detection of an alternation is made by the detector for unit 1, when stimulus 2 follows stimulus 1. Shared Detectors Repetition detector. SR2. This detector responds to the occurrence of repetitions of either stimulus. Its value is then applied in its entirety to the bias for the decision unit corresponding to the most recent stimulus: ì1 if r i (n ) > 0.5 and r i (n - 1) > 0.5, i = 1or 2 ü f R (n ) = í ý. î0 otherwise þ (SR2)
In our example of Table 1, notice that xs mark the occurrence of repetitions for either stimulus 1 or stimulus 2. In effect, SR2 collapses IR2 detections of repetitions across units 1 and 2. Alternation detector. SA2. This detector responds to the occurrence of an alternation of either stimulus, and the resulting value is applied in its entirety to the bias for the decision unit opposite the most recent stimulus: ì1 if r i ( n ) < 0.5 and r i ( n - 1) > 0.5, i = 1or 2 ü f A (n) = í ý. î0 otherwise þ (SA2)
Analogous to SR2, we can think of SA2 as collapsing the individual detections of IA2 across units 1 and 2. To summarize, we have described three repetition detectors (IR1, IR2, and SR2) and three alternation detectors (IA1, IA2, and SA2). In the simulations described below, we paired each of the repetition detectors with each of the alternation detectors to produce a total of nine combinations of possible repetition–alternation detection schemes. Each of these combinations provides a unique way of accounting for stimulus sequence dependencies in the following manner: Repetitions and alternations are detected by the respective methods described above to produce f R(n) and f A(n). Equations 3 and 4 then scale these detections by their bmax terms and incorporate them into a running, exponentially weighted average of occurrences of repetitions and alternations. The results of Equations 3 and 4 (bias terms bi ) exert their influence on stimulus processing through their inclusion in Equation 2, which describes the complete model. Simulations and Parameter Fitting In order to assess which sequence detection combination would most successfully account for the empirical data of Figure 1, we performed simulations of the model (Equation 2), exhaustively assessing each of the nine possible combinations of repetition and alternation detectors. The only free parameters adjusted were the scale factors for the repetition and alternation detectors, b Rmax , b Amax , and the noise strength s, for a total of three free parameters to be determined for any given repetition–alternation detection pair. The model’s performance employing the
optimal set of parameters for each detection pair is summarized in Figure 3. Values for the other parameters were taken directly from Usher and McClelland’s (2001) and Botvinick et al.’s (2001) studies and were kept fixed for all simulations at the following values: k 5 0.2, b 5 0.75, stimulus r 5 .85, G 5 4, d 5 0.5. D t, the time step for the model, was 0.1, q was 1.05 (yielding f (q ) 5 0.9), and the number of preparatory period timesteps was 60 (see note 4). l , the decay parameter for the exponential weighting of sequence effects in Equations 3 and 4, was set at 0.5. This corresponds to an essentially four-trial stimulus history (at n 2 4 trials back, exponential weighting of bmax is at most l4 5 0.54 5 0.0625), consistent with the finding that stimulus variations further back have negligible effects (Kirby, 1980; Laming, 1968; Remington, 1968). Simulations were numerically integrated (cf. Strogatz, 1994) with 25,000 trials for each sequence detection combination, so that the data point for each of the 16 sequence variants in Figure 1 included, on average, 25,000/16 5 1,563 trials. Parameter adjustments first targeted the replication of RTs, since these had finer dependencies on the varying stimulus histories. These initial adjustments of b Rmax and A b max were performed using noise-free (s 5 0) versions of the model, since the presence of noise in the nonlinear Equation 2 was not found to significantly affect the means of RT distributions (cf. Brown & Holmes, 2001). In this way, the computational expense of Monte Carlo simulation was avoided in determining initial estimates. In determining the ER profiles, the sequence detection parameters were fixed to their optimal values, and the third parameter, noise strength (s), was adjusted to obtain levels of error comparable to those of the empirical data. At this stage, simulations were run for many more trials, since ERs were relatively low and required a large number of iterations in order to obtain stable estimates for each sequence variant. RESULTS Empirical Data Our study of human subject performance in the 2AFC produced RT and ER profiles (Figure 1B) similar to those observed in the literature (Figure 1A). Both RT and ER generally increase with a decrease in the number of repetitions that precede a final repetition (left half of Figure 1B). This trend is mirrored by an analogous increase in RT and ER with a decrease in the number of alternations that precede a final alternation (i.e., the right half of Figure 1B is a reflection of the left half). There is also a slight predominance of repetition over alternation effects. For example, RT and ER are consistently lower for RRRR,6 as compared with AAAA trials, and highest for violations of a run of repetitions (RRRA), as compared with a violation of a run of alternations (AAAR). With regard to higher order effects, we found that these were preserved across successive experimental blocks (not shown). This was also observed by Soetens et al. (1985) in their study. This suggests that these higher order effects
MODEL OF SEQUENTIAL DEPENDENCIES are not random variations but, rather, reflect reproducible patterns of behavior within the context of a particular experimental paradigm. Furthermore, there are substantial similarities between the higher order effects observed in our study and those of Soetens et al. For example, in Figure 1 (panels A and B), it is apparent that the largest differences in RT occur between corresponding pairs of adjacent data points in the two plots. The one exception is the middle pair of data points (for the AAAR and RRRA sequences—i.e., at the transition from those ending in repetitions to those ending in alternations). This may reflect the general trend in the present study toward showing better performance on trials ending in a repetition versus an alternation. The similarity across these two experiments suggests that similar mechanisms may underlie the sensitivity of performance to stimulus history, as was explored in our simulations, discussed below. In addition to similarities across studies, there are also noticeable differences—in particular, between the data from Jones et al. (2002; Figure 1C) and those from the other two studies. In the Jones et al. study, the effects of repetitions predominated over those of alternations, as evidenced by a number of patterns in the data: The best performance was associated with a run of repetitions (RRRR), the poorest performance occurred with a violation of a run of repetitions (RRRA), and subjects exhibited significantly better performance with sequences ending with repetitions versus alternations. Interestingly, this plot (Figure 1C) bears resemblance to the plot of short RSI data in Soetens et al. (1985; see Figure 2 in their paper), where it was also noted that repetition effects predominated over those of alternations. These differences in behavioral data may reflect the influence of task-specific factors that differed across studies, such as the nature of the stimulus–response mapping (overlearned in the Soetens et al., 1985, study relative to the other two), stimulus set size (large in the Jones et al., 2002, study relative to the other two), and stimulus and response frequencies (varied in the Jones et al. study, but not in the other two). We will consider how these factors may have interacted with the effects of stimulus history in our discussion of the simulation results below. Simulations To determine which detector mechanisms would produce results that best fit the empirical data, we paired each of the three repetition detectors with each of the three alternation detectors and conducted simulations, using the procedures described above. For each pairing, a search was conducted over a broad range of values for the three critical parameters of the model (the detector scale facA , and the noise strength s). Figure 3 tors, b Rmax and b max shows the best fit to the empirical data from the present study (Figure 1B) for each of the nine combinations of detectors. Figure 4 shows analogous plots for the data from Soetens et al.’s (1985) and Jones et al.’s (2002) studies, from the detector combination that produced the best
291
overall fit to the three data sets (IR1–SA2, for the data acA quired in the present study, with b Rmax 5 0.08, b max 5 0.06, s 5 0.72; overall, r 2 5 .92 for RT and .62 for ER). Table 2 provides the results of individual fits for each detector combination to the RT and ER data from each of the three studies. As was noted above, the best overall fit to the data was achieved with the IR1–SA2 combination. This combination also produced the best f it to the data from Soetens et al. (1985) (r 2 5 .98 for RT and .34 for ER). The best f it to the data collected in the present study was achieved with the SR2–IA2 combination (with b Rmax 5 A 0.055, b max 5 0.07, s 5 0.75: r 2 5 .96 for RT and .81 for ER), whereas for the data from Jones et al. (2002), it was A achieved with IR2–IA1 (with b Rmax 50.035, b max 5 0.005, s 50.97: r 25.92 for RT and .87 for ER). We emphasize that all of the fits to the RT and ER data, for all 16 sequence histories, were obtained by adjustment of only A three parameters of the model (b Rmax , b max , and s). DISCUSSIO N The purpose of this study was to explore how simple mechanisms for detecting stimulus repetitions and alternations behave when they are used in various combinations to bias responding, and whether this behavior can explain the effects of stimulus history on human performance. In the discussion that follows, we first will consider the overall ability of different combinations of detectors to account for behavioral performance. We then will consider what the simulation results can tell us about the similarities and differences observed in the empirical findings across studies. Figure 3 shows that certain combinations of detectors provided a reasonably good account of human performance, whereas others did not. By examining the pattern of results, we can identify properties of the detectors, and their combinations, that may account for their ability to capture the empirical data. For example, we see from Figure 3 that all of the combinations involving repetition and alternation detectors of the same type (i.e., IR1–IA1, IR2–IA2, and SR2–SA2) produced poor fits. For the combinations involving individual detectors, this is because they failed to produce any consistent modulation of performance as a function of stimulus history (the small differences observed are presumably due to noise). This most likely reflected the symmetric influence of the repetition and alternation detectors in these combinations. This is easily seen for the IR1–IA1 combination. In this case, the occurrence of a given stimulus caused IR1 to bias the response corresponding to that stimulus on the next trial (i.e., it predicted a repetition). However, this was exactly offset by the prediction of an alternation and the biasing of the opposite response by IA1. A similar situation held for the IR2–IA2 combination. In this case, however, the fact that the detectors responded to actual repetitions or alternations led to a slight improvement of performance for long runs of one type of sequence or the other. This effect was greater for repeti-
292
CHO ET AL.
Figure 3. Simulation reaction times (RTs) and error rates (ERs) over varying stimulus histories. Shown are the results of simulation fits (circles joined by solid lines) to the empirical data shown in Figure 1B (shown in squares with dotted lines for comparison), following the format of that figure, with each plot representing a different repetition–alternation detector combination. The empirical RTs (Figure 1B) shown for comparison are scaled to the range of simulation RTs (in simulation timesteps) observed for the overall best detection scheme, IR1–SA2. The empirical ERs are the original values, without scaling.
tions, because a run of repetitions by definition involves only one of the stimuli and thus produces a consistent bias toward the corresponding response. In contrast, a run of alternations involves both stimuli, offset by one trial; thus, biasing occurs for both responses. Since the response
units are in competition with one another, there is no (or only a small) net gain in advantage by one over the other. The situation was slightly different for the SR2–SA2 combination. Note that this produced the appropriate monotonic changes but that they were too “smooth”—that is,
MODEL OF SEQUENTIAL DEPENDENCIES
293
Figure 4. Simulation fits of reaction time (RT) and error rate (ER) profiles for Soetens, Boer, and Hueting (1985) and Jones, Cho, Nystrom, Cohen, and Braver (2002), respectively, utilizing IR1–SA2. The format follows that of Figure 3, with simulation results represented by circles (with solid lines) and empirical data shown in squares (with dotted lines) for comparison.
they did not exhibit any higher order effects of stimulus history. Recall that for shared detectors, the accumulated effects of prior history are used to bias only one response unit or the other on a given trial. Thus, the offsetting effects that individual detectors can have on one another for a given trial cannot occur for shared detectors. Furthermore, because shared detectors are necessarily two-back detectors and, therefore, respond only to actual repetitions or alternations, a given sequence of two stimuli will in-
crement only one detector or the other. Thus, longer runs of a sequence of a given type (i.e., of repetitions or alternations) will produce greater values for the detector of that type. This, in turn, will progressively improve performance when the current stimulus conforms to that sequence type. Insofar as the SR2 and SA2 detectors respond in a perfectly complementary way to a given sequence, we would expect their influence to be a simple and monotonically increasing function of the length of the
Table 2 Simulation Fits to Empirical Data for Each Sequence Detection Combination Detection Schemes Repetitions
Alternations
IR1
IA1
IR1
IA2
IR1
SA2
IR2
IA1
IR2
IA2
IR2
SA2
SR2
IA1
SR2
LA2
SR2
SA2
Soetens et al. (1985)
Present Study
Jones and Braver (2001)
Average
.11 .03 .77 .15 .98 .34 .71 .00 .74 .23 .96 .29 .05 .00 .85 .26 .95 .29
.34 .53 .67 .53 .92 .77 .72 .46 .77 .56 .85 .49 .41 .63 .96 .81 .94 .85
.38 .61 .77 .77 .86 .79 .92 .87 .92 .77 .85 .81 .63 .61 .67 .59 .69 .66
.28 .39 .74 .44 .92* .62* .78 .45 .81 .49 .88 .51 .36 .41 .82 .53 .86 .57
Note—The top number of each pair is the R 2 for the reaction times, and the lower number is the R2 for the error rates. *The overall highest R 2s—those for the IR1–SA2 combination.
294
CHO ET AL.
run of each type. This pure monotonicity is precisely what is observed in Figure 3 for the SR2–SA2 combination. IR1–IA2 fared somewhat better than the symmetric detectors. However, like the IR1–IA1 and IR2–IA2 combinations, it too failed to produce the strong monotonicities seen in the empirical data. This may have been due again to the offsetting influences of individual detectors on the responses for each stimulus. These observations suggest that at least one shared detector is needed to break symmetry and produce results closer to those observed empirically. Finally, we can see from Figure 3 that none of the combinations involving the IA1 detector produced good fits. In general, this detector failed to produce the appropriate benefits for trials that ended in an alternation when these were preceded by progressively longer sequences of alternations (i.e., the monotonicity in the right half of the plots). This is not surprising, since this mechanism fails to detect actual alternations (see note 5). It simply predicts an alternation following each trial and primes the corresponding response. In other words, it is insensitive to the number of preceding alternations and, therefore, does not produce the corresponding improvement in performance seen in the empirical data for trials ending in an alternation. In contrast to the symmetric combinations and those involving the IA1 detector, the results from the IR1–SA2 and, to lesser degrees, the IR2–SA2 and SR2–IA2 combinations produced reasonably good fits to the empirical data. All of these combinations reproduced the prevailing monotonicities seen in the data, as well as many of the higher order effects. Nevertheless, no single combination provided the best fit to all of the datasets individually. This is not surprising, since there are notable differences across datasets. As was discussed above, the reproducibility of the effects within each study suggests that the differences across studies may be due, at least in part, to factors specific to the tasks used in each study. The fits of the simulations to the individual datasets may reveal something about these task-specific factors and how they interact with stimulus history. The data from Jones et al.’s (2002) study showed the greatest differences from the others. The monotonicities were less pronounced, and the higher order effects were more so. This study used a larger stimulus set for one response relative to the other (25:1) and manipulated the relative frequency of the stimuli associated with one response relative to the other (target/nontarget frequencies: 13/87, 50/50, 87/13). These factors may have diminished sensitivity to alternations. That is, the large number of varying stimuli associated with one of the responses may have diluted sensitivity to alternations between those stimuli and the one associated with the other response. Furthermore, although only data from the 50/50 response frequency condition are presented in Figure 1C, performance in this condition may have been influenced by the preponderance of repetitions (of the more frequent stimulus) in blocks employing asymmetric frequencies. Consistent with these observations, the IR2–IA1 combination of de-
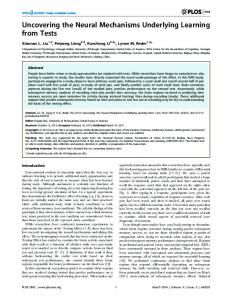
tectors provided the best individual fit to these data, and R for this fit was substantially greater than the b A the b max max (as compared with their relative values for the fits to the other data sets). Recall that IA1 is insensitive to actual alternations, whereas IR2 is sensitive to actual repetitions. Another difference across studies was overall better performance in Soetens et al.’s (1985) study relative to the other two: Both RTs and ERs were substantially lower in this study. There were two obvious factors impacting ERs: Subjects were given feedback about their ERs between blocks and were also encouraged to keep overall ER below 4%. For RTs, this difference was likely due to the use of over-learned stimulus–response mappings in their task (respond with a buttonpress on the same side as the appearance of a left- or right-sided light, respectively). In contrast, versions of the 2AFC tasks used in the Jones et al. (2002) and the present studies studies used novel mappings (e.g., alphanumeric characters arbitrarily assigned to buttons). Differences in the strength of the stimulus–response mapping are represented in the model by the input strengths (ri ). This parameter was not varied in the present study, which may account for the relatively poor fits to the error data from the Soetens et al. study. In ongoing work, we are exploring the use of mathematical techniques in an effort to develop deeper insight into the behaviors exhibited by different combinations of detectors observed in the simulations. As Audley (1973) has shown, valuable inferences concerning the differential expectancies built up during the preparatory period can be made by examination of resultant RTs across varying trial histories. Along similar lines, we have constructed two-dimensional phase portraits displaying the state of the system relative to the two response thresholds following the influence of the biases during the preparatory interval and then have used these to make linear approximations regarding the influence of the biases on RT. These methods have begun to provide some insights into the behavior of different combinations of detector systems. However, this approach assumes that the behavior of the system proceeds linearly following the response preparation phase. This assumption is violated by the presence of competition between the responses, which introduces significant nonlinearities into the system and shapes performance. For instance, in the phase plot of the model’s activation states in Figure 5, points X and Y mark two possible response phase starting points following the preparatory interval; during the response phase, despite being equal in their perpendicular distances to the threshold of unit 1 (q1), X and Y will have different arrival times at q1, owing to nonlinearities in their trajectories. Thus, more powerful mathematical approaches are needed to fully characterize these systems and to determine what underlying factors are most important for explaining the pattern of results observed in the empirical data (Brown & Holmes, 2001). However, even without a full analytic understanding of the behavior of the sequence detectors we have modeled, the simulation results address the two initial goals of this work: (1) to determine whether
MODEL OF SEQUENTIAL DEPENDENCIES
295
Figure 5. Map of activation trajectories. This is a vector field showing representative velocity vectors for a stimulus presentation, S 5 1; activation trajectories “flow” along this field. Despite being equidistant to the response threshold (q1) for x1 , the initial conditions represented by Points X and Y will result in different response times, owing to the nonlinear dynamics of the ensuing activations.
a combination of simple detectors that respond only to highly local sequential events can account for the sensitivity of human performance to longer stimulus sequences and, if so, (2) to identify which combinations of detectors best fit the empirical data, as a guide to the incorporation of such mechanisms into models that address other phenomena of interest. GENERAL DISCUSSIO N Factors that are known to affect performance during RT tasks include the number of stimulus–response alternatives, RSI, stimulus–response compatibility, and the probability of repetitions and alternations (Kirby, 1980). We have explored a subset of these factors, by focusing on tasks involving two response alternatives, each associated with a single stimulus (or set of stimuli) presented with equal overall probability at long RSIs. We have specified a set of simple mechanisms that detect local repetitions and alternations in the stimulus sequence and have explored their ability to explain regularities observed in subjects’ RT and ER profiles as a function of stimulus history. The results of simulations using various combinations of these mechanisms revealed that only a limited subset produces behaviors that match the empirical data. The finding that certain combinations could account for detailed variations in performance over 16 different stimulus histories demonstrates that seemingly idiosyncratic, higher order, sequencedependent variations in performance can be explained by the interaction of two relatively simple mechanisms for detecting stimulus repetitions and alternations.
In the discussion below, we first will consider one important question about the significance of our results for addressing sequential effects in other studies. We then will consider a variety of more general issues concerning the relationship of our findings to psychological and neurobiological processes relevant to sequence effects in performance, as well as alternative approaches to addressing these phenomena. Generality of Simulation Findings One of the principal aims of this paper was to determine the pairing of repetition and alternation detectors that would produce the overall best fit to the three sets of empirical data examined in this study. However, in surveying the summary of the fits for each of the three sets (Table 2), we see that IR1–SA2—the overall best candidate pairing—provided the best fit only for the data of Soetens et al. (1985), whereas SR2–IA2 and IR2–IA1 produced optimal fits for the data of the present study and Jones et al. (2002), respectively. As was discussed in the previous section, we believe that differences in task design between studies have led to some of the variations in the profiles of the RTs and ERs. Despite these task differences, in this paper, we purposely fixed all the parameters at values inherited from previous modeling studies employing our general framework (Botvinick et al., 2001; Usher & McClelland, 2001). However, it may be useful to explore whether changes to a subset of these parameters (e.g., input strengths, number of input stimuli, etc.) can interact with our favored mechanism (IR1–SA2) to produce better fits to individual datasets with the same combination of
296
CHO ET AL.
detectors. However, given the early stage of the exploration, the most conservative approach at present would be to investigate what progress can be made employing the combination that produces the overall best fit. This is the strategy that was fruitfully adopted in Jones et al. (2002). Relationship to Psychological Processes In contrast to our approach of exploring explicitly defined sequence detection schemes, past accounts of repetition and alternation effects have appealed to broader constructs, such as facilitation and expectancy (Bertelson, 1961; Kirby, 1976; Soetens et al., 1985). Typically, facilitation has been offered as an explanation for repetition effects. Facilitation has been thought to occur only at short RSIs (less than 100 msec), involving a simple, low-level mechanism, with rapid decay (Soetens et al., 1985). However, even though our data sets all came from long RSI trials, our overall best detector combination (IR1–SA2) employs a facilitation-like mechanism for repetitions. This suggests that facilitation may exist at two different time scales: a short RSI version based on low-level mechanisms— say, sensory or motor based—and another at long RSIs mediated by higher, decisional-level processes. More elaborate combinations of sequence detection schemes (with different decay parameters) would be required to explore this possibility. Higher level expectancy-based mechanisms have been thought to manifest behaviorally at long RSIs (Soetens et al., 1985) and have usually been offered as an account of alternation effects. However, it is possible that such expectancies are, in fact, established at short RSIs but simply do not have sufficient time to affect performance. Sommer, Leuthold, and Soetens (1999) provided electrophysiologic evidence that stimulus alternations—which affect behavioral performance only at longer RSIs—are indeed detected even at short RSIs. This suggests that detections of alternations, even at longer RSIs, do not necessarily have to rely on slow, high-level expectancy-based mechanisms, since these patterns can be discerned even at such brief time scales. One interesting possibility, then, is that our optimal detection schemes, which have only been tested at long RSIs, may operate across both short and long RSI conditions. In summary, contrary to earlier proposals, facilitation-based mechanisms may account for long RSI data and expectancy-based effects may appear also at short RSIs, questioning the adequacy of simple notions of facilitation and expectancy in providing a comprehensive account of the sequential effects observed in the behavioral and neurophysiologic data. Neurophysiological Evidence Studies in nonhuman primates have produced corroborative evidence that both behavior (Dorris, Taylor, & Klein, 1999) and electrophysiologic measurements (Dorris & Munoz, 1998; Dorris, Pare, & Munoz, 2000) are influenced by trial history. This appears to occur whether previous trials have the predictive value of the present one (Dorris & Munoz, 1998) or not (Dorris et al., 2000; Dorris et al., 1999). Dorris et al. (1999) reported both stimulus-
and response-related effects, indicating that both stimulusand response-based mechanisms should be considered in accounting for the influences of trial history. Of particular relevance to the present study are the results of Dorris et al. (2000). They showed that during the motor preparatory phase in a saccadic response task, activity in superior colliculus neurons increased as a function of the number of previous repetitions of stimulus presentations in the respective neuron’s receptive field. Unfortunately, owing to insufficient sample size, the effects of trials histories further than two trials back could not be examined, thus hindering an adjudication between a simple facilitation of responses, using a scheme like IR1, and a more elaborate combination of repetition and alternation schemes (which could equally account for their data but would depart from IR1 in predictions of higher order stimulus effects). Studies employing human subjects have also found modulations in neural activity that track the variations in behavioral indices over different stimulus histories. For instance, variations in the amplitude of the P300, a parietally distributed event-related potential component that is thought to index subjective expectations (Donchin & Coles, 1988), exhibit a sensitivity to repetitions and alternations similar to those explored in this paper (Squires, Wickens, Squires, & Donchin, 1976; Sommer et al., 1999). Squires et al. formally modeled these effects as a combination of the influence of stimulus repetition, alternation, and overall frequency of each stimulus type and arrived at a model very similar to our IR1–SA2 model.7 More recently, the Sommer et al. study produced a plot of P300 amplitudes over varying stimulus histories that bears remarkable resemblance to the patterns shown in Figure 1. Further work is needed to determine the exact relationship between the variations in the P300 and the associated behavioral data, but these ERP studies indicate that such lawful relationships do exist and suggest potential neuroanatomical sites that may be involved in these processes. Recent functional neuroimaging studies of human subjects performing the 2AFC task afford significantly greater spatial resolution, raising the possibility of providing anatomical localization of the sequence-detecting mechanisms that we have formalized in the present paper. In a PET imaging study of novelty detection, we have demonstrated that the implicit learning of predictable sequences is associated with activations of the right prefrontal cortex and the right inferior parietal lobe/superior temporal gyrus, whereas violations of the learned regularities elicited greater response from the premotor and anterior cingulate cortex and the basal ganglia (Berns, Cohen, & Mintun, 1997). However, the task used in this study differed significantly from the present one in that the sequencedependent expectancies were based on true regularities in the stimulus history as specified by an experimenterdetermined grammar. A more recent fMRI study employed a typical 2AFC paradigm with random presentations of two stimuli (Huettel, Mack, & McCarthy, 2002). Violations of repeating sequences of stimuli were shown to elicit activations in the prefrontal cortex and the basal ganglia, with activations increasing with increasing pat-
MODEL OF SEQUENTIAL DEPENDENCIES tern length. Violations of alternating sequences elicited activation in the prefrontal cortex alone. It is unclear whether more posterior regions, such as the parietal areas implicated in Berns et al.’s study and the P300 ERP work (Sommer et al., 1999; Squires et al., 1976), were also activated in Huettel et al.’s study, since they did not collect scans in the posterior half of the brain. An important question, however, is whether the results of Huettel et al. (2002) generalize to a wider range of stimulus histories. Analyses in their study were limited to violations of histories consisting solely of either repetitions or alternations. It is unclear, then, whether the observed brain activations were elicited specifically in response to violations of two simple patterns or, rather, were a result of a general sequence detection mechanism that could produce appropriate responses in a variety of scenarios. Jones et al. (2002) performed an analysis relevant to this issue, incorporating data from all the possible sequences of stimuli starting from four trials back. One of the aims of this study was to examine how conflict in processing (Botvinick et al., 2001) modulated over varying stimulus sequence contexts. They found that activations in the anterior cingulate cortex (ACC), which is thought to track the degree of conflict (Botvinick et al., 2001), varied predictably over the different sequences. Predictions of ACC activity were made employing the optimal repetition and alternation detectors of the present study (IR1– SA2), demonstrating that the interactions of two simple detectors could serve as a general mechanism that could account for the modulations in brain activity observed over a wide range of stimulus histories. Alternative Approaches Stimulus- versus response-based accounts. Our choice to study stimulus-based effects follows the vast majority of studies in which sequential effects have been examined. There is evidence that dependencies on trial history are at least partly due to stimulus-based mechanisms. The neurophysiologic studies in nonhuman primates described above suggest that dependencies on stimulus history can manifest independently of those associated with overt motoric responses (Dorris et al., 1999). Similarly, the P300— commonly thought to reflect stimulus evaluation—is clearly modulated by stimulus history (Sommer et al., 1999). One obvious alternative to a stimulus-based account is a response-based analysis of sequential dependencies. When error rates are low, these two approaches may not produce significantly different results, given that it is only with errors that response histories diverge from stimulus histories. However, performance exhibiting higher ERs offers the opportunity to distinguish between sequential effects that are due to stimulus and to response orderings, respectively. Laming (1968) did include the effects of past responses in his regression equations but found no conclusive patterns. Rabbitt and Rogers (1977) also investigated response-related modulations in performance but focused on error-related performance and did not examine higher order dependencies. However, was as noted above, Dorris et al. (1999) reported response-based sequential
297
dependencies, over and above effects that were due to the stimulus presentations. Clearly, further research is required to determine the relative contributions of responseversus stimulus-based mechanisms to the observed dependencies on trial history. Abstract models. Our model of sequential dependencies lies between more abstract mathematical characterizations and specific neural implementations, providing a guide for further work at each level. We have employed analytic methods from dynamical systems approaches (Brown & Holmes, 2001) to gain insights into the behavior of our sequence detection schemes in the context of the complex nonlinearities that drive performance (Usher & McClelland, 2001). Along similar lines, in other studies, sequential dependencies have been examined, using alternative nonlinear frameworks. Falmagne et al. (1975) analyzed sequential effects in terms of a Markov chain model. Their model produced responses that varied according to the outcomes of comparisons of the presented stimulus with stored representations of the stimulus set; how these comparisons were made in a given trial depended solely on parameter values in the previous trial. This method bears similarity to ours in that a temporally local mechanism was used to explain an array of higher order variations in performance. However, reasonable fits to their empirical data were gained at the expense of a large number of free parameters (ranging from 8 to 12, in contrast to our 3), raising the question of whether simpler models might also suffice in accounting for the observed data. Other, more sophisticated formalisms may serve to reduce the complexity of models. For example, Mozer, Colagrosso, and Huber (2002) employed a Bayesian framework to explain sequential dependencies by rapidly adapting the model’s prior probability estimates to the local statistics of the environment—that is, the local stimulus history. This relatively simple model was able to achieve good fits to the empirical data of Jones et al. (2002; Figure 1C of the present study). However, it would be interesting to see how well the performance of this model generalizes to other datasets. For instance, Mozer et al. noted that their model did not require an explicit mechanism to facilitate alternations, but this may have been a function of the particular dataset that was fitted—recall that alternation effects were minimal in the data of Jones et al. It is of interest, then, what additional assumptions, if any, might be required for their model to account for data in other studies, including ones with more prominent alternation effects. It may also be instructive to explore the relationship between such abstract statistical approaches and models such as ours, which detail specific mechanisms by which repetitions and alternations affect performance. Learning mechanisms. An interesting question is whether the mechanisms responsible for the observed stimulus sequence effects are hardwired, as opposed to being learned over the course of development or certain task contexts. Pertinent to this question is the model of Cleeremans (1993), which employed a connectionist learning mechanism that detected sequence dependencies using fast weights (Hinton & Plaut, 1987). This method
298
CHO ET AL.
involves relatively large adjustments in connection weights that also have a very quick decay rate. Consequently, local regularities can quickly be discovered but have only shortterm impacts on performance. Thus, the detections of repetitions and alternations may arise from a general learning mechanism in which a narrow temporal window constrains the learning to only the most basic of patterns.8 The use of such simple learning algorithms may place limits on the complexity of the specific mechanisms by which repetitions or alternations are detected. For instance, in the Cleermans (1993) model, the learning algorithm produced a fairly rudimentary implementation of alternation detections. Specific ordinal relationships were learned (e.g., a response to Stimulus A following Stimulus B would be facilitated after one or more instances of A’s following B, akin to our IA2), instead of a more generalized detection of alternations, as is implemented, for example, by the most successful of our alternation detectors, SA2. Thus, sequence detections that arise from temporally local learning may give a reasonable account of the empirical data but may fall short of more optimal fits that might be afforded by more complex mechanisms that may be either hardwired or require learning over more extended time frames. CONCLUSIONS In this paper, we have explored a number of mechanisms for repetition and alternation detection in attempting to account for the complex but highly reproducible modulations in performance over varying stimulus histories. A number of important issues remain to be clarified, such as the generalizability of our particular detection schemes and how these mechanisms relate to more traditional psychological constructs, such as facilitation and expectancy. However, the success of our better detector combinations in accounting for the behavioral data of three separate studies provides encouraging initial support for the proposal that simple mechanisms can interact to produce the seemingly complex sequence-dependent patterns in performance. The careful characterization of the mechanisms that underlie sequential dependencies serves one of our broader aims of exploring how such dependencies interact with the higher level mechanisms that subserve strategic adjustments in cognitive control. As was mentioned above, we have already employed the insights gained from the present work, by incorporating detectors of repetitions and alternations (IR1–SA2) into larger simulations of attentional tasks that also include the mechanisms of conflict monitoring and cognitive control (Jones et al., 2002). Our hope is that, as in the present study, in which the detectors were added to an otherwise unmodified model of the forced-choice task, one can assemble models of more complex cognitive tasks in an incremental fashion from simpler units that have been tested individually. It is hard to see how this approach could proceed without the clarity afforded by precise (mathematical) specifications.
REFERENCES Audley, R. J. (1973). Some observations on theories of choice reaction time: Tutorial review. In S. Kornblum (Ed.), Attention and performance IV (pp. 509-549). New York: Academic Press. Berns, G., Cohen, J., & Mintun, M. (1997). Brain regions responsive to novelty in the absence of awareness. Science, 276, 1272-1275. Bertelson, P. (1961). Sequential redundancy and speed in a serial twochoice responding task. Quarterly Journal of Experimental Psychology, 13, 90-102. Botvinick, M. M., Braver, T. S., Barch, D. M., Carter, C. S., & Cohen, J. D. (2001). Conflict monitoring and cognitive control. Psychological Review, 108, 624-652. Brown, E., & Holmes, P. (2001). Modeling a simple choice task: Stochastic dynamics of inhibitory neural groups. Stochastics & Dynamics, 1, 159-191. Carter, C. S., Braver, T. S., Barch, D. M., Botvinick, M. M., Noll, D., & Cohen, J. D. (1998). Anterior cingulate cortex, error detection, and the online monitoring of performance. Science, 280, 747-749. Cleeremans, A. (1993). Mechanisms of implicit learning: Connectionist models of sequence processing. Cambridge, MA: MIT Press. Cohen, J. D., Dunbar, K., & McClelland, J. L. (1990). On the control of automatic processes: A parallel distributed processing account of the Stroop effect. Psychological Review, 97, 332-361. Cohen, J. [D.], MacWhinney, B., Flatt, M., & Provost, J. (1993). PsyScope: An interactive graphic system for designing and controlling experiments in the psychology laboratory using Macintosh computers. Behavioral Research Methods, Instruments, & Computers, 25, 257-271. Donchin, E., & Coles, M. G. (1988). Is the P300 component a manifestation of context updating? Behavioral & Brain Sciences, 11, 357-427. Dorris, M. C., & Munoz, D. P. (1998). Saccadic probability influences motor preparation signals and time to saccadic initiation. Journal of Neuroscience, 18, 7015-7026. Dorris, M. C., Pare, M., & Munoz, D. P. (2000). Immediate neural plasticity shapes motor performance. Journal of Neuroscience, 20, 1-5. Dorris, M. C., Taylor, T. L., & Klein, R. M. (1999). Influence of previous visual stimulus or saccade on saccadic reaction times in monkey. Journal of Neurophysiology, 81, 2429-2436. Falmagne, J. C., Cohen, S. P., & Dwivedi, A. (1975). Two-choice reactions as an ordered memory scanning process. In P. M. A. Rabbitt & S. Dornic (Eds.), Attention and performance V (pp. 296-344). New York: Academic Press. Hinton, G. E., & Plaut, D. C. (1987). Using fast weights to deblur old memories. In Program of the Ninth Annual Conference of the Cognitive Science Society (pp. 177-186). Hillsdale, NJ: Erlbaum. Huettel, S. A., Mack, P. B., & McCarthy, G. (2002). Perceiving patterns in random series: Dynamic processing of sequence in prefrontal cortex. Nature Neuroscience, 5, 485-490. Hyman, R. (1953). Stimulus information as a determinant of reaction time. Journal of Experimental Psychology, 45, 188-196. Jones, A. D., Cho, R. Y., Nystrom, L. E., Cohen, J. D., & Braver, T. S. (2002). A computational model of anterior cingulate function in speeded response tasks: Effects of frequency, sequence, and conflict. Cognitive, Affective, & Behavioral Neuroscience, 2, 300-317. Kirby, N. H. (1976). Sequential effects in two-choice reaction time: Automatic facilitation or subjective expectancy? Journal of Experimental Psychology: Human Perception & Performance, 2, 567-577. Kirby, N. H. (1980). Sequential effects in choice reaction time. In A. T. Welford (Ed.), Reaction times (pp. 129-172). London: Academic Press. Kornblum, S. (1967). Choice reaction times for repetitions and nonrepetitions: A re-examination of the information hypothesis. Acta Psychologica, 27, 178-187. Laming, D. (1968). Information theory of choice reaction times. London: Academic Press. Laming, D. (1979). Choice reaction performance following an error. Acta Psychologica, 43, 199-224. Luce, R. D. (1986). Response times. New York: Oxford University Press. McClelland, J. L. (1979). On the time relations of mental processes:
MODEL OF SEQUENTIAL DEPENDENCIES An examination of systems of processes in cascade. Psychological Review, 86, 287-330. Mozer, M. C., Colagrosso, M. D., & Huber, D. H. (2002). A rational analysis of cognitive control in a speeded discrimination task. In T. Dietterich, S. Becker, & Z. Ghahramani (Eds.), Advances in neural information processing systems XIV. Cambridge, MA: MIT Press. Posner, M. I. (1978). Chronometric explorations of mind. New York: Oxford University Press. Rabbitt, P., & Rodgers, B. (1977). What does a man do after he makes an error? An analysis of response programming. Quarterly Journal of Experimental Psychology, 29, 727-743. Ratcliff, R. (1978). A theory of memory retrieval. Psychological Review, 85, 59-10. Ratcliff, R., Van Zandt, T., & McKoon, G. (1999). Connectionist and diffusion models of reaction time. Psychological Review, 106, 261-300. Remington, R. J. (1968). Analysis of sequential effects in choice reaction times. Journal of Experimental Psychology, 82, 250-257. Soetens, E., Boer, L. C., & Hueting, J. E. (1985). Expectancy or automatic facilitation? Separating sequential effects in two-choice reaction time. Journal of Experimental Psychology: Human Perception & Performance, 11, 598-616. Sommer, W., Leuthold, H., & Soetens, E. (1999). Covert signs of expectancy in serial reaction time tasks revealed by event-related potentials. Perception & Psychophysics, 61, 342-353. Squires, K. C., Wickens, C., Squires, N. K., & Donchin, E. (1976). The effect of stimulus sequence on the waveform of the cortical eventrelated potential. Science, 193, 1142-1146. Sternberg, S. (1969). Memory-scanning: Mental processes revealed by reaction time experiments. American Scientist, 57, 421-457. Strogatz, S. (1994). Nonlinear dynamics and chaos. Reading, MA: Perseus. Usher, M., & McClelland, J. (2001). The time course of perceptual choice: The leaky, competing accumulator model. Psychological Review, 108, 550-592. Vervaeck, K. R., & Boer, L. C. (1980). Sequential effects in two-choice reaction time: Subjective expectancy and automatic aftereffect at short response–stimulus intervals. Acta Psychologica, 44, 175-190. Yeung, N., Botvinick, M. M., & Cohen, J. D. (2002). The neural basis of error detection: Conflict monitoring and the error-related negativity. Manuscript submitted for publication. NOTES 1. The association of expectation effects with longer RSIs is limited to effects that depend on the identity of the immediately preceding stimulus. Expectations already engendered by earlier stimuli could, of course, have an immediate impact on the processing of the current stimulus.
299
2. By monotonicity, we refer to the pattern in the RTs and ERs, in plots such as Figure 1, of progressive increases for sequences ending with repetitions (left halves) and decreases for those ending with alternations (right halves). 3. xi, the state of each decision unit, corresponds to the net input of a processing unit in connectionist models; f (xi) is a function that transforms xi to the activation state of each unit. 4. The RSIs of the empirical data of Figure 1 were approximately two to three times the average RTs. To ensure a comparable “RSI” for the model, the preparatory period was set to 60 timesteps, three times that of the average model RT, which was approximately 20 timesteps. 5. This device (and the IA1 device described further on) is not a detector in the literal sense. That is, it does not detect repetitions as such; rather, it simply predicts that the next stimulus will be the same as the current one (and for the IA1 device, that the next stimulus will be the opposite one). This was included to implement the simplest possible mechanism that might be sensitive to repetition (i.e., by implementing automatic repetition priming), and the IA1 device was included as its analogue for alternations for completeness. 6. We use the nomenclature of Soetens et al. (1985) where R and A represent repetitions and alternations, as explained in the caption to Figure 1. Read from left to right (or in the figures, from top to bottom), the sequence proceeds from the earliest stimulus progressively toward the present stimulus. 7. However, there are some important differences. In their model, biases based on alternation effects were assigned discrete values (integers between 23 and 13), depending on the number of consecutive alternations in the recent stimulus sequence. Although this method could adequately account for lower order alternation effects, it is limited in accounting for many of the higher order ones. These subtler effects could be better addressed by schemes that employ continuous bias values that result from exponentially weighted averages (favoring more recently presented stimuli) of any occurrences of alternations in the stimulus history, regardless of order. Also, Squires et al.’s (1976) model included an explicit term for the overall frequency of each stimulus type and found that the term for overall stimulus frequency accounted for a significant portion of variance in the behavioral data. In contrast, sensitivity to global stimulus frequency emerges naturally in our model as a consequence of local detections of repetitions (Jones et al., 2002). 8. In principle, by using slower decay times, more intricate patterns could be learned, although with random stimulus presentations, the relevance of this possibility quickly diminishes with sequences of increasing length, since their consecutive occurrence becomes increasingly improbable. (Manuscript received October 2, 2001; revision accepted for publication September 23, 2002.)