Advances in Engineering Research (AER), volume 143 6th International Conference on Energy and Environmental Protection (ICEEP 2017)
Medium-scale ex suit electrokinetic remediation of Cd and Zn polluted soil enhanced by EDTA, tartaric acid, citric acid and acetic acid Guannan Liu1,a, Xiaosai Li1,b, Jibo Wang1,2,c, Ming Chen1,d* 1
MLR Key Laboratory of Metallogeny and Mineral Assessment, Institute of Mineral Resources, Chinese Academy of Geological Sciences, Beijing 100037, China 2
The college of resources, Hebei GEO University, Shijiazhuang 050031, China
a
[email protected],
[email protected],
[email protected], d*Corresponding author:
[email protected]
Keywords: Heavy metals, Soil, Electrokinetic remediation, Enhancement, Speciation
Abstract: The effect of enhancement agents on the efficiency of electrokinetic (EK) remediation of contaminated soils has been extensively studied in the past few years. However, the larger scale ex suit EK remediation with enhancement agents has been rarely reported. In this study, medium-scale EK remediation tests (20 kg dry soil at a single test) enhanced by EDTA, tartaric acid, citric acid and acetic acid were carried out to remove Cd and Zn from the contaminated soil. The removal efficiencies of Cd and Zn were enhanced by EDTA, tartaric acid and citric acid, and the enhanced effect of acetic acid on removal efficiencies of Cd and Zn was less. The highest removal efficiencies of Cd and Zn were 22.2% (citric acid) and 23.3% (tartaric acid), respectively. Low removal efficiencies were ascribed to the accumulations of Cd and Zn in F1 (exchangeable) and F2 (carbonate-associated) fractions in the middle section soils after EK remediation for all tests. After EK remediation, the F3 (reducible) concentrations of Cd and Zn, lower than initial concentrations, increased with the distance from the anode for all tests. The results suggested that F3 fraction can be transformed into F1 and F2 fractions, and F1, F2 and F3 fractions were removable during the EK remediation. Comparing with the control test (CT), more variations of total concentration and speciation of Cd and Zn were found, indicating apparent effects of enhancement agents on heavy metal removal during EK remediation. The results are significant for the enlargement of ex suit EK remediation. Introduction In the past few decades, soil pollution by heavy metals has become one of the major concerns as heavy metals are of bioaccumulation, high toxicity, and non-degradation [1-3]. Human activities such as transport, fertilization, mining activities and other industrial production often result in a large accumulation of heavy metals in soils [4]. Soil pollution by heavy metals can trigger a series of concerns for environment and public health. It is therefore of great importance to remediate the lands polluted by heavy metals. Electrokinetic (EK) remediation is a kind of cost-effective in situ or ex situ remediation technology [5, 6]. It can remediate the low-permeability clays and heterogeneous soil polluted by heavy metals, organic compounds or a combination of these contaminants [7]. Basically, electrodes are mounted in contaminated soils and the electric field is generated between electrodes by applying a low-level DC potential gradient or an electric current. In the electric field, the pollutants such as heavy metals and organic pollutants are removed from the soil through electromigration, Copyright © 2017, the Authors. Published by Atlantis Press. This is an open access article under the CC BY-NC license (http://creativecommons.org/licenses/by-nc/4.0/).
1348
Advances in Engineering Research (AER), volume 143
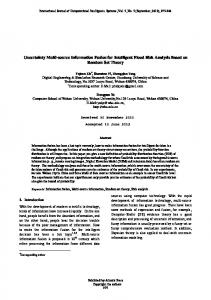
electroosmosis, electrophoresis and diffusion [8, 9]. However, the current induces variation to the soil pH due to water electrolysis at electrodes. The high pH in the soil near the cathode causes metal hydroxides to precipitate in the soils, decreasing soil conductivity and limiting metal extraction from soil [10]. Enhancement method by adding chemical reagents, such as chelating agents and low-molecular-weight organic acids, to improve metal solubility is an effective way to improve the removal efficiency of heavy metals [11]. The effect of enhancement agents on heavy metal removal efficiency of EK remediation was extensively studied [8, 10, 12, 13]. However, most studies were lab-scale, the larger scale ex suit EK remediation with enhancement agents has been rarely reported. In this paper, medium-scale EK remediation tests (20 kg dry soil at a single test), enhanced by EDTA, tartaric acid, citric acid and acetic acid, were carried out to investigate the variations of total concentration and speciation of Cd and Zn during the EK remediation; the effect of the enhancement agents on the EK remediation of Cd and Zn polluted soil and the transport mechanisms of Cd and Zn during EK remediation with enhancement agents were discussed. The results should be significant for the enlargement of ex suit EK remediation. Material and methods Soils The contaminated soil was collected from a chemical plant in Hunan province, China. The production of chemical reagents and pesticides had led in severe soil pollution with Cd and Zn. The soil was air-dried, and sieved through a 1 cm polyethylene sieve. The concentrations of Cd and Zn in the soil were 7.2±0.2 and 1580.1±122.2 mg/kg, respectively. Soil pH value is 5.54. The soil is silt loam soil, and the percentages of clay, silt and sand are 9.26%, 63.38% and 27.36%, respectively. The organic matter content is 1.16%. EK test The main device (Fig. 1), includes a heavy metal trapper, a soil chamber (cylinder of 30 cm and 120 cm length) and two electrodes. The soils were packed into the chamber by 40 kg slurry (soil:water:1:1,w/w) with 60 g enhancement agent, i.e. EDTA, tartaric acid, citric acid and acetic acid (0.3%, enhancement agent: dry soil, w/w). A control test (CT), no enhancement agent, was also performed. The tests were performed under 220 V for 96 h. To avoid high electric current, the remediation was performed under 110 V for 0~4 h. The soil samples and soil waters were collected in the various location in the chamber as shown in Fig. 1.
Fig.1 Schematic diagram of EK test setup Analytical methods The soil temperature was measured using a thermometer. The pH of soil water was measured by a pH meter. The Cd and Zn concentrations in soils were measured by flame atomic absorption spectrometry (FAAS, PinAAcle 900, PerkinElmer, America) after the samples were digested with 1349
Advances in Engineering Research (AER), volume 143
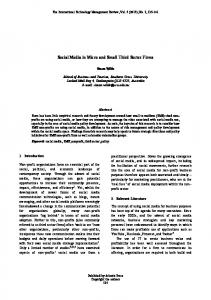
HNO3-HClO4-HF (3:1:1, v/v/v). The sequential extraction of heavy metals in soils was carried out following Tessier’s sequential extraction procedure [14]. This procedure separates heavy metals in soils into four fractions, i.e., exchangeable (F1), carbonate-associated (F2), reducible (bound to Fe/Mn oxides, F3) and oxidizable (bound to OM, F4) fractions. The details of the sequential extraction procedure can be found in the Tessier’s paper [14]. To obtain the mass balance of heavy metals in the soils, the residual fraction (F5) was measured after acid digestion using the procedure above for total metal determination. Results and discussion Electric current, soil pH and temperature changes The electric current changes with various enhancement agents were shown in Fig.2. The electric current increased rapidly before reaching maximum values, and then gradually decreased as reported by Song et al. [8]. The initial high values are caused by the large amount of ions in the soil solution. Over time, the ion concentrations reduced because the ions were moved by electromigration. In addition, activation polarization, resistance polarization, and concentration polarization can result in electric current decrease [9]. The maximum electric currents were 0.498, 0.434, 0.533, 0.510 and 0.302 A for EDTA, tartaric acid, citric acid, acetic acid and CT, respectively. It is noting that the electric current of EDTA was higher after 15 h, indicating that EDTA may be greatly enhanced removal efficiencies owing to persistent electric current. 110V
0.6 EDTA Tartaric acid Citric acid Acetic acid CT
220V
Electric current (A)
0.5 0.4 0.3 0.2 0.1 0.0 0
10
20
30
40
50 60 Time (h)
70
80
90 100
Fig.2 Electric current variation of the soil during the EK tests
1350
Advances in Engineering Research (AER), volume 143
12
12
Citric acid
10
10
8
8
8
6
6
6
pH
10
pH
pH
12
Tartaric acid
EDAT
4
4
4
2
2
2
0
0 0
20
40
60 Time (h)
100
0 0
20
40
60 Time (h)
80
100
0
20
40
60 Time (h)
80
100
12
Acetic acid
10
10
8
8
6
6
pH
pH
12
80
4
4
2
2 CT 0
0 0
20
40
60 Time (h)
80
100
0
20
40
60 Time (h)
80
100
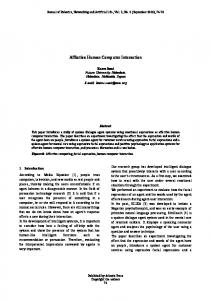
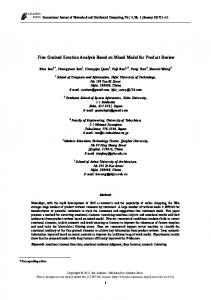
Fig.3 pH variation of the soil during the EK tests For all tests, the pH values in cathode were alkaline and all apparently higher than other sites; whereas the pH values in the anode was gradually decreased with the remediation time, ranging in 1-3 after EK remediation (Fig. 3). In the middle section, the pH values were decreased and then increased except acetic acid test. For the acetic acid test, the pH values were relatively low and changed slightly with the remediation time. The production of H+ and OH- ions at the anode and cathode, respectively, resulted in polarization [13]. The pH value of the test with acetic acid was different from other tests suggesting higher acidification. Low soil pH is favorable to heavy metals’ mobility [11]. Temperature for all tests increased firstly, and then gradually decreased to a low value, which was similar to the change of electric current. The results indicated that the Joule effect was the reason of high temperature. The high temperature was found at S6 site of acetic acid test with value 43.7 oC. High temperature contributes to ionic velocities [15]. In addition, high temperature can lead to soil water reduction through water evaporation during the remediation, and then affect ionic transport. For different section, the temperature at S6 was generally higher than other sites. The production of hydroxide and carbonate of heavy metals in the heavy metal trapper (S6) generated lots of heat resulting in high temperature at S6.
1351
Advances in Engineering Research (AER), volume 143
50
50
50 Tartaric acid
40
30
20
Citric acid Temperature (℃)
Temperature (℃)
Temperature (℃)
EDAT 40
30
20
0
20
40
60 Time (h)
80
100
30
20
0
20
40
60 Time (h)
50
80
100
0
20
40
60 Time (h)
80
100
50 Acetic acid
CT Temperature (℃)
Temperature (℃)
40
40
30
20
40
30
20
0
20
40
60 Time (h)
80
100
0
20
40
60 Time (h)
80
100
Fig.4 Temperature variation of the soil during the EK tests Distributions of Cd and Zn in the soils The distributions of Cd and Zn across the soil chamber for the duration of the EK tests using the enhancement agents EDTA, tartaric acid, citric acid and acetic acid were shown in Fig. 5 and Fig. 6, respectively. It was observed that the Cd and Zn concentrations in the soil (S1) near the anode were all decreased with time. After remediation, the Cd removals were 66.7% (EDTA), 69.4% (tartaric acid), 66.7% (citric acid), 61.1% (acetic acid) and 47.2% (CT), respectively; the Zn removals were 79.2% (EDTA), 76.2% (tartaric acid), 76.2% (citric acid), 74.7% (acetic acid) and 68.8% (CT), respectively. The soil near the anode presented low pH reaching 1-3 after EK remediation, resulting in the Cd2+ and Zn2+ were desorbed from the soil particle surface and removed from the soil close to the anode [4]. The concentrations of Cd and Zn in the S2 soil in the case of EDTA were also decreased with time. For the other tests, the Cd and Zn concentrations were changed less with time except the soil at S1 site. The apparent accumulation of Cd and Zn in the middle section soils was found after 56 h of the treatment, and the concentrations of Cd and Zn were still higher than the untreated soils after EK remediation. As the pH increase with the distance from the anode, the Cd2+ and Zn2+ transported from the anode towards the cathode can form hydroxides and carbonates to hinder Cd and Zn removal. Therefore, the accumulation of Cd and Zn in the middle section soils was found. EDTA is an anionic complex, which can desorb heavy metals from soil particle surfaces and dissolved metal hydroxides and carbonates by forming strong water-soluble complexes [11]. In addition, it was reported that more alkaline environment can make more EDTA dissolve to enhance the removal efficiency [16]. However, Cd and Zn were also accumulated in the middle section soils for the case of EDTA. Me-EDTA complexes were negatively charged, and transported to the anodic region from the cathode [17], which diminished the transport of Cd2+ and Zn2+ resulting in the accumulation Cd and Zn in the middle section soils. Tartaric acid and citric acid not only reduce the soil pH to solubilize heavy metals, but also form coordination complexes [8, 9, 18, 19]. However, the stability constants of Cd and Zn with them are lower than that with EDTA, indicating less heavy metals on the soil particle surface can be desorbed through formation complexes. The stability constants of Cd with tartaric acid is: 2.8 (CdH-tartaric 1352
Advances in Engineering Research (AER), volume 143
acid+), with citric acid: 3.10 (Cd-citric acid-) and 12.6 (CdH2-citric acid +). Likewise, the stability constants of Zn with TA is 2.68 (ZnH- tartaric acid +) and 8.32 (Zn- tartaric acid 22-), with citric acid: 13.3 (ZnH2-citric acid+) [20-22]. After the EK remediation enhanced by tartaric acid and citric acid, Cd and Zn were also accumulated in the middle section soils, which was closely related to the pH variation of the middle section soils. As the discussion above, except the soil near the anode, the pH values of other section soils became increase after 56 h of the treatment with tartaric acid and citric acid. The H+ from the hydrolysis of tartaric acid and citric acid was exhausted by OH- generated from the cathode, leading to forming metal hydroxides and carbonates. Nevertheless, for the cases of tartaric acid and citric acid, the removal efficiencies of Cd and Zn were higher than the CT. 2.0
2.0
2.0
EDTA
Tartaric acid
Citric acid 1.5
1.0 0.5
C/C0(Cd)
1.5
C/C0(Cd)
C/C0(Cd)
1.5
1.0
0.5
0.5
0.0
0.0
0.0
0
20
40 60 Time (h)
80
100
0
20
40 60 Time (h)
80
100
0
20
40 60 Time (h)
80
100
2.0
2.0 Acetic acid
CT 1.5 C/C0(Cd)
1.5 C/C0(Cd)
1.0
1.0
1.0 0.5
0.5
0.0
0.0 0
20
40 60 Time (h)
80
100
0
20
40 60 Time (h)
80
100
Fig. 5 Distribution of Cd profiles across the soil during the EK tests The Cd and Zn removal efficiencies enhanced by acetate acid were 5.0% and 8.8%, which were comparable with CT test. Furthermore, the accumulation of Cd and Zn in the middle section soils was also observed. Although the complexes, such as Cd-Ac+, Cd-Ac2, Zn-Ac+, were also formed during the EK remediation, the stability constants of Cd-Ac+, Cd-Ac2, Zn-Ac+ were very low with the values of 1.9, 3.2 and 1.5, respectively [20-22]. In view of the lower soil pH than other tests during EK remediation, reducing the soil pH may be the most important effect of acetate acid on enhancing heavy metal removal. Even so, for the case of acetate acid, the soil pH ranged from 4.85 to 7.36, after EK remediation, suggesting Cd and Zn could be adsorbed by the soil surface or form hydroxides and carbonates. Acetate acid content (0.3%, acetate acid: dry soil) is not enough to acidizing the soil and removing Cd and Zn from the soil. The order of Cd removal efficiency was citric acid (22.2%)> tartaric acid (20.0%)> EDTA (16.7%)> CT (5.0%)> acetate acid (5.0%). Likewise, the order of Zn removal efficiency was tartaric acid (23.3%)> EDTA (21.8%)> citric acid (21.7%)> acetate (8.8%)> CT (8.7%). Except the acetate acid test, removal efficiencies were enhanced, but the removal efficiencies were not high because more heavy metals were accumulated in the middle section soils. Adding more enhancement agents and choosing longer remediation time may be able to remove the stagnated heavy metals in the middle section soils. The results are significant for the enlargement of ex suit EK remediation.
1353
Advances in Engineering Research (AER), volume 143
2.0
2.0
2.0
1.5
C/C0(Zn)
1.0
C/C0(Zn)
1.5
1.5 C/C0(Zn)
Citric acid
Tartaric acid
EDTA
1.0
0.5
0.5
0.5
0.0
0.0
0.0 0
20
40 60 Time (h)
80
100
0
20
2.0
40 60 Time (h) 2.0
Acetic acid
80
100
0
20
40 60 Time (h)
80
100
CT 1.5 C/C0(Zn)
1.5 C/C0(Zn)
1.0
1.0 0.5
1.0 0.5
0.0
0.0 0
20
40 60 Time (h)
80
100
0
20
40 60 Time (h)
80
100
Fig.6 Distribution of Zn profiles across the soil during the EK tests Speciation of Cd and Zn in the soils Fig. 7-8 indicated the quantity of metals extracted in each step of the sequential extraction analysis. As we know, the EK process alters heavy metals speciation in soils and the process is strongly influenced by pH and redox potential [4, 23]. F1 and F2 fractions of Cd and Zn were extremely high in the middle section soils for the enhanced EK remediation and slightly high in the middle section soils for the control test. Meanwhile, the concentrations of Cd and Zn in F1 and F2 fractions in the soil close the anode were lower than their concentrations in the untreated soils. The results suggested that Cd and Zn in the F1 and F2 fractions in the soil closed to the anode transported towards to the cathode and stagnated in the middle section soils due to high soil pH. Cd and Zn in the F1 fraction mainly bound to soil particle surface by nonspecific adsorption, and can be removed easily during EK remediation [4, 10]. Moreover, chelating agents can desorb them from soil surface by formation complexes [17, 22, 24]. F2 fraction is a fraction associated to carbonate, which can be released at low soil pH [2]. It was also reported in other studies that the concentrations of F1 and F2 fractions changed significantly during the EK remediation [4, 10]. The concentration of F3 fraction in the treated soils, lower than untreated soil, increased with the distance from anode for all tests, indicating that a part of F3 fraction transformed into F1 and F2 during the EK process. For the F4 and F5 fractions, their concentrations were comparable in the different section soils because of close bond of Cd and Zn in F4 and F5 fractions with organic and soil matrix. It was also observed that the variation of F1, F2 and F3 fractions was more significant for enhancement tests than control test indicating that enhancement agents can facilitate the transformation of soil heavy metals during the EK process. The similar result was also found by other studies [4, 17]. However, the apparent difference of the distribution of heavy metal speciation between enhanced EK tests was not found. It is noting that the Zn concentration in the F2 fraction was higher than that in the F1 fraction for most soils; the Cd concentration in F2 fraction, by contrast, was lower than that in F1 fraction for most soils. F2 fraction is acid dissolvable and contain heavy metal hydroxides and carbonates in the soils. At 25 oC, the solubility product (Ksp) of Cd(OH)2 and Zn(OH)2 are 7.2×10⁻¹⁵ and 3.0×10⁻¹⁷ indicating that Zn(OH)2 as F2 fraction is easily generated. 1354
Advances in Engineering Research (AER), volume 143
8
8
8 Citric acid
6
4
2
0
Cd concentration (mg/kg)
Tartaric acid Cd concentration (mg/kg)
Cd concentration (mg/kg)
EDTA 6
4
2
0 Initial
S1
S2
S3
S4
4
2
0
S5
Initial
S2
S1
S3
S4
S5
Initial
S1
S2
S3
S4
S5
8
8
CT Cd concentration (mg/kg)
Acetic acid Cd concentration (mg/kg)
6
6
4
2
6
4
2
0
0 Initial
S1
S2
S3
S4
Initial
S5
S1
S2
S3
S4
S5
Fig. 7 Spatial of Cd after EK remediation with various enhancement agents 1500
1500
1500 Citric acid
1200 900 600 300 0
Zn concentration (mg/kg)
Tartaric acid Zn concentration (mg/kg)
Zn concentration (mg/kg)
EDTA 1200 900 600 300 0 Initial
S1
S2
S3
S4
S5
900 600 300 0
Initial
S1
S2
S3
1500
S4
S5
Initial
S1
S2
S3
S4
S5
1500 Acetic acid
CT Zn concentration (mg/kg)
Zn concentration (mg/kg)
1200
1200 900 600 300 0
1200 900 600 300 0
Initial
S1
S2
S3
S4
S5
Initial
S1
S2
S3
S4
S5
Fig.8 Spatial of Zn after EK remediation with various enhancement agents Conclusion Medium-scale EK remediation tests (20 kg dry soil at a single test) enhanced by EDTA, tartaric acid, citric acid and acetic acid were carried out to remove Cd and Zn from the contaminated soil. The removal efficiencies of Cd and Zn were enhanced by EDTA, tartaric acid and citric acid. For the case of acetic acid, the removal efficiencies of Cd and Zn were comparable with CT. The highest removal efficiencies were 22.2% (citric acid) and 23.3% (tartaric acid) for Cd and Zn, respectively. Low removal efficiencies were ascribed to the accumulations of Cd and Zn in F1 and F2 fractions in the middle section soils after EK remediation for all tests. Nevertheless, the F1 and F2 concentrations of Cd and Zn in the soil closed to the anode were obviously lower than initial concentrations, indicating the transport of Cd and Zn as F1 and F2 forms during the EK remediation. In addition, after EK remediation, the F3 concentrations of Cd and Zn, lower than initial 1355
Advances in Engineering Research (AER), volume 143
concentrations, increased with the distance from the anode for all tests. The results suggested that F3 can be transformed into F1 and F2. F1, F2 and F3 fractions were removable form during the EK remediation. Comparing with CT, more variations of total concentration and speciation of Cd and Zn were found, indicating apparent effects of enhancement agents on heavy metal removal during EK remediation. Adding more enhancement agents and choosing longer remediation time may be able to further enhanced the removal efficiencies of heavy metals. Acknowledgements This work was financially supported by the Fundamental Research Funds for the Central Public Research Institutes (YK1606) and the Public Sector Special Scientific Research Program of National Ministry of Land and Resources (B1401). References [1] G. Liu, Y. Yu, J. Hou, W. Xue, X. Liu, Y. Liu, W. Wang, A. Alsaedi, T. Hayat, Z. Liu. Ecol. Indic. Vol. 47(2014), p. 210-218. [2] G. Liu, J. Wang, E. Zhang, J. Hou, X. Liu Environ. Sci. Pollut. Res. Vol. 23(2016), p. 8709-8720. [3] L.Rodríguez, E. Ruiz, J. Alonso-Azcárate,J. Rincón J. Environ. Manage. Vol. 90(2009), p. 1106-1116. [4] A. Giannis, D. Pentari, J. Wang, E. Gidarakos J. Hazard. Mater. Vol. 184(2010), p. 547-554. [5] Y.B. Acar, A.N. Alshawabkeh Environ. Sci. Techno. Vol. 27(1993), p. 2638-2647. [6] R.F. Probstein, R.E. Hicks, Science, Vol. (1993), p. 498-503. [7] K.R. Reddy: Coupled Phenomena in Environmental Geotechnics. (Taylor & Francis Group, London 2013). [8] Y. Song, M. T. Ammami,A. Benamar,S. Mezazigh, H. Wang Environ. Sci. Pollut. Res. Vol. (23), p. 10577-10586. [9] J. Virkutyte, M. Sillanpää, P. Latostenmaa, Sci. Total Environ. Vol. 289(2002), p. 97-121. [10] D. Zhou, C. Deng, L. Cang, Chemosphere Vol. 56(2004), p. 265-273. [11] A.T. Yeung, Y.Y. Gu J. Hazard. Mater. Vol. 195(2011), p. 11-29. [12] A. Giannis, A. Nikolaou, D. Pentari,, E. Gidarakos Environ. Pollut. Vol. 157(2009), p. 3379-3386. [13] M. Masi, R. Iannelli, G. Losito Environ. Sci. Pollut. Res. Vol. 23(2016), p. 10566-10576. [14] A. Tessier, P.G.C. Campbell, M. Bisson Anal. Chem. Vol. 51(1979), p. 844-851. [15] F. Baraud, S. Tellier, M. Astruc J. Hazard. Mater. Vol. 64(1999), p. 263-281. [16] F.C. Chang, S.L. Lo, C.H. Ko Sep. Purif. Technol. Vol. 53(2007), p. 49-56. [17] J.C. Yoo, J.S. Yang, E.K. Jeon, K. Baek Environ. Sci. Techno. Vol. 22(2015), p. 9912-9921. [18] C. Cameselle Electrochim. Acta Vol. 181(2015), p. 31-38. [19] S. Yuan, Z. Xi, Y. Jiang, C. Wu, Z. Zheng, X. Li Chemosphere Vol. 68(2007), p. 1289-1297. [20] K.R. Reddy, S. Chinthamreddy J. Geotech. Geoenviron Vol. 129(2003), p. 263-277. [21] E. Gidarakos, A. Giannis Water Air Soil Poll Vol. 172(2006), p. 295-312. [22] J.C. Yoo, C.D. Lee, J.S. Yang, K. Bael Chem. Eng. J. Vol. 228(2013), p. 688-699. [23] Y. Xu, X. Xu, H. Hou, J. Zhang, D. Zhang, G. Qian Environ. Sci. Pollut. Res. Vol. 23(2016), p. 6517-6523. [24] R.A. Wuana, F.E. Okieimen, J.A. Imborvungu Int. J. Environ. Sci. Te. Vol. 7(2010), p. 485-496. 1356