biological phenomena, including morphogenesis and aging, cancer and disease .... The user is required to provide only a list of genes (gene cluster) as input.
MedMeSH Summarizer: Text Mining for Gene Clusters P. Kankar, S. Adak, A. Sarkar∗ K. Murari† , and G. Sharma‡ 1
Introduction
1.1
Microarrays and Gene Expression
Gene Expression is the process by which a gene’s coded information is translated into the proteins present and operating in the cell. Changes in gene expression are associated with many important biological phenomena, including morphogenesis and aging, cancer and disease states, and adaptive responses to the environment. The advent of high density microarrays, introduced by Schena et al.[1] in 1995, made it possible for the first time to measure the expression levels simultaneously of all or most of the genes in a given genome. Since then, cDNA microarrays[2] and GeneChips (also called high-density oligonucleotide arrays)[6] have been used extensively in generating genome-wide expression profiles for different organisms under different environmental conditions. The microarray technologies for whole-genome expression profiling are new and rapidly evolving, and we refer the reader to the recent reviews ([4],[3],[5]). The vast quantity of data being generated using these microarrays provides researchers with a significant opportunity to transform biology, medicine, and pharmacology using systematic computational methods. The availability of genome-wide expression profiles promises to have a profound impact on the understanding of basic cellular processes, the diagnosis and treatment of disease, and the efficacy of designing and delivering targeted therapeutics. Particularly relevant to these objectives is the ability to cross-reference experimental and analytical results with previously known biological facts, theories, and results. Biological and medical literature databases provide the kind of knowledge warehouses required for such extensive crossreferencing. However, the volume of such databases makes the task of cross-referencing very lengthy, tedious, and daunting. The MedMeSH Summarizer system described in this paper is geared precisely for this task of helping a biologist in cross-referencing experimental and analytical results obtained from microarray experiments.
∗ IBM
India Research Lab, Indian Institute of Technology, Hauz Khas, New Delhi, India of Electrical Engineering, IIT Chennai,Chennai, India ‡ Department of Electrical Engineering, IIT Delhi,New Delhi, India † Department
1.2
Data Mining for Microarrays
In a typical microarray experiment set, whole genome-expression profiles are measured under a variety of conditions. These experimental conditions can be different time points during a biological process (such as in the yeast cell cycle[7]) or tissue samples from different patients suffering from a particular disease (such as different types of cancer[8]). The data is in the form of a matrix where the rows represent genes and columns represent the different conditions. Early work on analysis of microarray data were mostly focused on clustering genes based on similarity or identifying genes based on their ability to distinguish different phenotypes (e.g. disease types or cell types). Popular clustering methods used in this context include hierarchical clustering[9], self-organizing maps[11], and K-means clustering among many others. Any of the these analysis methods produce a cluster or group of genes, whose relation to each other has been derived based solely on the microarray experimental data.
1.3
Beyond Clustering and Classification for Microarrays
In order to explain the underlying biological mechanisms and assign “biological meaning” to a clusters of genes obtained by analytical methods, it is necessary to cross-reference genes with “external” information sources. Efforts in this direction are particularly relevant as the clustering/classification methods typically rediscover known associations between genes. It is therefore important to take full advantage of existing knowledge about transcription factors, regulatory elements, sequence or structure information, or assigned gene functions. There are a variety of biological databases that can be mined to find possible functional relationships between genes in a cluster. Efforts along these lines have included cross-referencing clusters gene with known regulatory elements ([12],[13]) and with known biological functions ([14],[15]). These used DNA sequence databases and pathway databases respectively. However, such specialized biological databases only give information about a particular biological domain e.g. sequence or structure or pathway. Literature databases, which are a rich source of information, can be used to discover and analyze biologically significant information on genome-wide scale. Moreover, the biomedical literature consists of multidisciplinary islands of biological expertise that can be used to find important biological concepts spanning different domains. But the huge volume of data makes the traditional search techniques ineffective. For example, PubMed, which is the most widely used biomedical literature database, has more than 11 million citations and is increasing at a super exponential rate. The main challenges in using such a database are: 1. Querying on even a few genes (5-10) retrieves tens of thousands of documents. For genome-wide analysis this becomes unmanageable. 2. Use of multiple names and conventions for referring to genes. 3. Proteins that are the products of the given genes are also of interest. Hence, it is important to know the proteins made by each gene. 4. Non-uniform nomenclature and language usage for same biological concepts in the biology world e.g. cancer and carcinoma are used synonymously. 5. Highly complex and parallel interrelations among biological processes across multiple biological domains. Given these complexity and growth of biomedical literature, we need a system capable of filtering the literature database and extracting and summarizing relevant information in a well-organized and coherent manner.
1.4
Related Work
It is clear that standard text summarization methods ([16],[17],[18]), cannot be imported into this domain without addressing some of the challenges and issues that are characteristic of the domain of biology, genomics, proteomics, and microarrays. Specific solutions for summarizing biological text have been proposed. Most of the current solutions are based on the boolean query paradigm that requires users to specify a very accurate query in order to get good results and has very limited use as they are highly domain dependent and often require use of specific keywords and search terms. TextQuest[19] was one of the first of such solutions, but it is geared to summarize documents retrieved in response to a keyword(s) based search on PubMed. It does not retain the association between the genes(keywords) and the retrieved documents. One of the tools aiming at providing summarized literature information on genes is MedMiner[20]. MedMiner is limited to finding relations between two genes only and also, it returns a few hundred of sentences. Moreover, it requires a relevance keyword list, requiring the user to have prior knowledge of the possible interactions between the two genes. Shatkay et. al.[21] suggested a system, which attempts to find functional relations among genes on genome-wide scale, but this requires user to specify a representative document for each gene, which describes the gene very well. Looking for the representative document may need lot of time, effort and knowledge on part of user. Also as genes have multiple biological functions, it is very rare to find a document that covers all aspect of genes across various biological domains.
2
Materials and Methods
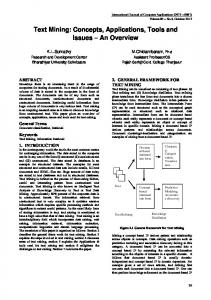
Overview: MedMeSH Summarizer summarizes a group of genes by filtering the biomedical literature and assigning relevant keywords describing the functionality of a group of genes. The system aims to summarize literature information about a group of genes in a concise and coherent manner and has the following key features (as depicted in Fig. 1): • MedMeSH Summarizer can be used to summarize the biomedical citations for genes on a genome-wide scale. • MedMeSH Summarizer generates relevant summaries across multiple biological domains. • It generates very concise, relevant and informative summaries. • MedMeSH Summarizer has been implemented in JAVA with a full functionality user interface. • The user is required to provide only a list of genes (gene cluster) as input. • The system uses PubMed , the most widely used on-line resource for biomedical literature, as the literature database. • It also uses other organism specific databases to automatically generate “synonyms” for gene names. • The user interface has been designed for maximum ease of use and flexibility. It allows customization to the precise interests of the biologist and his requirements for the microarray experiment at hand.
2.1
Understanding a PubMed Citation
PubMed provides access to MEDLINE(http://www.ncbi.nlm.nih/PubMed) through the Entrezquery interface. MEDLINE is the National Library of Medicine (NLM)’s premier bibliographic database covering the fields of medicine, nursing, dentistry, veterinary medicine, the health care system, and the preclinical sciences. MEDLINE contains bibliographic citations and author abstracts from more than 4,000 biomedical journals. MEDLINE currently stands at 11 million citations dating back to the mid-1960’s. In addition to MEDLINE, PubMed also allows access to some additional
Figure 1. The MedMeSH Summarizer System general science, chemistry and life sciences journals. A typical citation in PubMed includes the following information: a unique Medline ID, author, title, journal information (journal name, year, volume, pages, etc.), abstract, and MeSH keywords. Each citation in PubMed is manually curated: an expert assigns an average of 10-15 MeSH keywords which are most relevant to the major points of the article. MeSH or Medical Subject Headings is NLM’s controlled vocabulary thesaurus used for indexing articles in the PubMed database. The MeSH vocabulary is periodically reviewed and updated; currently, the MeSH ontology contains about 19,000 terms. The MedMeSH Summarizer system uses these MeSH terms to annotate a set of genes by summarizing all the terms tagged to documents that refer to the gene in question. The advantages
gained by using MeSH terms instead of the full abstract include: • Consistency and uniformity of terms explaining same concepts which is independent of userspecified keywords. Without MeSH terms, it would be necessary to maintain a synonym list and ontology in the form of a metathesaurus which would run into ≈ 105 to 106 terms. Consistency is particularly important in the biomedical literature as there is no standardized terminology, even for important concepts. For example, authors may use “cancer”, “carcinoma” or “neoplasm” to imply cancer: Neoplasm is the MeSH term for this concept. Another example is “Renal transplantation” and “Kidney transplantation” where the latter is the MeSH term. • MeSH terms are assigned on the subject of the entire document, not just the citation text available in PubMed, which contains merely the title and abstract. • The additional processing of parsing the abstracts, stemming and stop word filtering is not required. The solution for such tasks has to be tailored to the biomedical literature database and be subject to errors. • Problem of words/phrase extraction does not arise. For example, the biologically relevant item in a document may be the phrase “protein kinase C”, but a mere keyword extraction would retrieve the words protein and kinase (and possibly C) separately.
2.2
Information Retrieval
The MedMeSH Summarizer system comes with an in-built wrapper for data retrieval. Given a list of genes (specified by the user), the wrapper retrieves data from PubMed by executing the following steps: 1. Alias Mapping: For each gene in the list, a list of “aliases” is retrieved from organism specific databases. These “aliases” include synonyms for the gene name as well as the names of the proteins that are products of the gene. (For example, the yeast gene OLE1 is referred to in microarray experiments by the ID of YGL055W and it also known as the gene MDM2. In fact, a PubMed search retrieved 35 citations for OLE1 and 1245 citations for MDM2 and 1279 for “OLE1 or MDM2”). 2. PubMed Query: The wrapper connects to the PubMed database and submits consecutive queries for each gene in the list. Each query retrieves documents for a single gene that are associated with one or more of the aliases for the gene. 3. Once the relevant citations for a gene are obtained (in XML format), the wrapper parses the citations to extract the MeSH terms tagged with each of the citations. 4. The wrapper outputs a list of MeSH terms for each gene along with a frequency count for each MeSH term in the list. The gene-specific frequency count for the MeSH term is the number of citations indexed by the MeSH term that are associated with the gene. For computation purposes MeSH subheadings are merged with MeSH heading and their count added. To enhance the speed of the software we look at only the first thousand documents obtained through PubMed. We found that these thousand documents are good enough representation of the gene. However, this can easily be increased based on the user requirements. The MedMeSH Summarizer system can support any resource for alias specification through a customized wrapper. It currently retrieves aliases for yeast genes from the Saccharomyces Genome database (SGD: http://genome-www.stanford.edu/Saccharomyces/) and we are currently developing a specialized wrapper for human genes that will retrieve aliases from the human gene databases.
2.3
Pre-Processing: MeSH Stop Word Filtering
Standard English text summarization requires filtering of the most common English words e.g. the, a, for, this, etc. Such words that are very common yet irrelevant noise in text summarization are referred to as stop words. Initial experimentation showed that certain MeSH terms also are common yet irrelevant from the point of view of the microarray experiment. A MeSH stop word filter was implemented, that was aimed at removing the terms which rather than being associated with the given cluster of genes are associated with genes in general. These terms will be obtained in any query made about genes and are not important for the user. A list of MeSH stop words was created as follows: • We made a query list which contained a large number of genes selected at random, but so that an equal number were chosen from different classes of organisms like Eukaryotes, Prokaryotes and Chordates etc. As the genes in query list are not related we expected the high frequency terms to be related to genes in general and thus not specific to any particular cluster of genes. • We obtained the MeSH terms for this list and ranked them in descending order of their total frequency. • The distribution followed Zipf’s law which is commonly seen in word-frequency distributions[28]. We considered the first region (top 50 terms with high frequency) of Zipf’s curve. A panel of experts examined the terms from this region and few of them which seemed to be biologically important were removed from consideration. • The remaining MeSH terms from this region constituted the MeSH stop word list The final list of MeSH stop words contained 35 MeSH terms. Some examples are: Support U.S. Govt., Support Non U.S. Govt., molecular sequence data, base sequence, DNA, human, animal, etc. Henceforth, we shall assume that all MeSH term lists have been filtered and MeSH stop words removed.
2.4
Pattern Discovery: MeSH Summary of a Gene Cluster
Gene Cluster: Let G = {g1 , g2 , . . . , gN } be the given cluster containing N genes, where gj will be used to denote the j th gene in the cluster. � � � MeSH Term List: Let Ω = Ω1 Ω2 . . . ΩN , where Ωj is the set of MeSH terms associated with the gene gj (j = 1, 2, . . . , N ) (after MeSH stop word filtering). Moreover, let Ω = {ω1 , ω2 , . . . , ωM }, where ωi (i = 1, 2, . . . , M ) denote the MeSH terms associated with the genes in the cluster. Co-Occurrence Matrix: Let F = ((Fij ))M ×N be the co-occurrence matrix, where Fij = Number of citations that are associated with the gene gj by the PubMed database and contain the MeSH term ωi , (i = 1, 2, . . . , M ; j = 1, 2, . . . , N ). Objective: The primary objective is to determine a subset of MeSH terms Ω∗ (G) that can be considered an “optimal” summary of the biological functions and properties of the entire cluster G. Standard text summarization algorithms ([18]) are geared to summarizing all the documents retrieved based on keyword searches. In multi-keyword searches, the association between a document and the keywords(s) is not used. However, in our context, interest lies in capturing significant biological properties that are most relevant to the cluster as a whole. Based on this heuristic, we define a cluster summary as follows: A MeSH cluster summary, Ω∗ (G)of a gene cluster G consists of terms of one of the following three categories:
1. Cluster Topics (Major): These are terms that are “commonly” associated with almost all genes in the cluster. 2. Cluster Topics (Minor): These are terms that are less common than the major topics but still appear with most of the genes are considered important for the cluster as a whole. 3. Particular Topics: These are terms that are not cluster topics, but have “high particularity”, i.e. are frequently associated with a few genes in the cluster. Many times they describe an important part of the cluster and help in deriving complete functionality of the cluster.
2.5
Topic Identification Based on Statistical Information
Co-occurrence of event data is found in many applications including web information retrieval, computer vision, life sciences, etc. For example: In computer vision, G could correspond to locations in an image, and Ω to a set of feature values; In epidemiology, G could be different geographic locations and Ω a list of different diseases. A review of various statistical models for analyzing such co-occurrence data is given in Hofmann et al.[22]. The use of co-occurrence data in information retrieval of text documents was reviewed in Berry et al.[32]. In this paper, we describe a methodology which is geared to identifying an optimal MeSH cluster summary. Starting with Ω, we identify the topics for the MeSH cluster summary by the following steps: 1. The MeSH terms in Ω are ranked by an overall relevance score. The overall relevance score is based on statistical information that takes into account the three categories of topics required for a MeSH cluster summary — the major and minor cluster topics and the particular topics. 2. A “particularity index” is computed for each MeSH term in Ω that measures how common the MeSH term is across all the genes in the cluster. 3. The MeSH terms are further categorized as “generic” terms that describe the whole cluster and “particular” terms which describe partial but important function of the cluster. The proportion of MeSH terms that are categorized as “particular” provides a measure of the (biological)homogeneity of the cluster — the lower the proportion of “particular” terms, the greater the homogeneity. Normalization by Gene Relevance The normalization of MeSH term frequencies is necessary to prevent the MeSH terms of a wellstudied gene, which has a lot of documentation, from skewing the overall results in their favor. If one of the genes in a given cluster is well-studied, the frequency of the MeSH terms associated with the well-studied gene will dominate MeSH terms associated with other genes in the cluster. Thus, a summary obtained for the whole cluster will be almost the same as summary obtained for the dominant gene alone. In such a situation, the summary will not describe the cluster but the dominant genes. This problem of one or two genes skewing the total results in their favor was seen in the case of the fatty acid cluster shown in Table 1. In this cluster , OLE1 was the gene that had far more data then any other gene in the cluster. Summarization without appropriate normalization led to the following: 9(11) of the top 10(20) terms associated with OLE1 occurred among the top 20 terms for the whole cluster. This resulted in total results being almost similar to the results obtained for this gene alone. On the other hand, if a gene is very well-studied, it is an important gene and its functions and properties may be biologically more important than similarly expressed genes in the cluster, which have been less studied. Treating it on par with other genes will totally ignore this fact and loose its relevance. So there are two contradicting requirements for normalization. 1. Dominant genes in cluster should not highly skew results in their favor.
2. Some weight should be given to the fact that the gene is well studied. To achieve normalized frequency of the MeSH term, ωi for gene gj is computed as f˜ij = �� this�the α M . α (0 ≤ α ≤ 1) is a normalization parameter that can be specified by the user and Fij / i=1 Fij controls the weight or relevance of a well-studied gene to the cluster. The default value of α in the system is 0.67, which was determined after extensive experimentation. Note that α = 0 implies no normalization and α = 1 implies complete normalization in which case f˜ij estimates the probability P (MeSH term ωi |gene gj ). By increasing α from 0 to 1, the user can observe the changes to the summary as relevance of the citation volume of individual genes is decreased. Definition 1. �Each MeSH term ωi ∈ Ω, is characterized by the MeSH feature vector ˜ fi = � ˜ ˜ ˜ ˜ fi1 , fi2 , . . . , fiN , where fij (i = 1, . . . , M ; j = 1, . . . , N ) are the normalized frequencies described above. Overall Relevance Ranking Topic identification using weighted averages of skewness and kurtosis has been used by Fukuhura et al.[23] to determine topics of interest. Based on our initial experimental investigations, these measures were not found to perform well in determining appropriate MeSH cluster summaries. An alternate strategy gives each MeSH term an overall relevance rank based on several statistical attributes. The statistical attributes were selected keeping in mind our requirements for a MeSH cluster summary: 1. Cluster Topics (Major): These are MeSH terms that are “commonly” associated with almost all genes in the cluster and hence likely to have a high total frequency of occurrence. For this, the MeSH terms are ranked by the mean of their gene distribution feature vectors as follows: � �� N ˜ • Compute µi = j=1 fij /N, (i = 1, . . . , M ). • Ranking Criterion R1 : Rank the MeSH terms by decreasing order of the means µi ’s so that the MeSH term with the highest mean gets rank 1. 2. Cluster Topics (Minor): These are MeSH terms which had moderate-to-low total frequency but still appear with most of the genes. This type of terms are expected to have moderate mean and low variance. For this, the MeSH terms are ranked by the ratio of mean/standard deviation of their MeSH feature vectors as follows: �� �2 � �N � ˜ • Compute σi = /N , (i = 1, . . . , M ). f − µ ij i j=1 • Ranking Criterion R2 : Rank the MeSH terms by decreasing order of the ratios µi /σi ’s so that the MeSH term with the highest ratio gets rank 1. 3. Particular Topics: These are MeSH terms that were not related to the whole cluster but were strongly associated with a subgroup of the cluster. This type of terms are expected to have high variance and moderate-to-low mean. For this, the MeSH terms are ranked by the ratio of variance/mean of their MeSH feature vectors as follows: • Ranking Criterion R3 : Rank the MeSH terms by decreasing order of the ratios σi2 /µi ’s so that the MeSH term with the highest ratio gets rank 1. Each MeSH term in Ω is ranked based on each of the above three criteria. The terms were then given an overall relevance rank R where: R = wR1 +
1−w 1−w R2 + R3 2 2
(1)
After that the final list of terms in the MeSH cluster summary Ω∗ (G) is obtained as the set of K highest ranked MeSH terms, which are arranged in ascending order of their overall relevance rank. The parameter K is the number of topics that the user would like to view and can be specified in the MedMeSH Summarizer interface [see Fig. 2]. The weight parameters in equation (1) has been assigned so that the major topics are given weight w being the most important set of terms in providing a summary of the cluster. The remaining weight 1 − w is divided equally between the minor topics and the particular topics. The default weights in the MedMeSH Summarizer software system are: w = 0.50 for the first ranking criterion and 0.25 each for the second and third criteria. These weights were arrived at after extensive experimentation and testing. We experimented with different weighting strategies and found this one to give the best results consistently across different clusters of genes. Weighted average of ranks have been used to combine results from different internet search engines ([27],[24]). It is also possible to use more complex rank aggregation methods[24] or tie-breaking strategies for majority rules[25] . However, simple averaging gave adequate results in our experiments and we chose to focus on determining the “particularity” of topics and clusters. The user is allowed to vary the weight parameter in the MedMeSH summarizer interface as shown in Fig. 2. Categorization: Generic and Particular MeSH Terms The objective here is to categorize the MeSH terms obtained in Ω into two separate lists: generic and particular. This is based on the heuristics notion that certain MeSH terms that are associated with a few genes in the cluster may still be considered “biologically significant” and it would be important to report such terms in the summary. However, such “particular terms” should be distinguished from the generic topics that describe the biological properties of the cluster as a whole. Of course, in our approach, the basic underlying assumption is that “biologically significant” topics will be addressed or mentioned in most documents and hence result in “statistically meaningful co-occurrences”. Our first objective here is to propose a formalization of this heuristic notion of “particularity”. Secondly, we also describe certain measures of particularity. Based on a particularity measure, the ranked MeSH terms in Ω will be categorized into generic and particular topics. In the subsequent discussion on particularity, we consider two MeSH terms ω, ω � being compared to each other. We have suppressed the first subscript that indexes for the MeSH term, i.e. so f˜j and f˜j� will be the normalized frequency corresponding to gene gj for ω and ω � respectively. Definition 2. Let ω, ω � be two MeSH terms whose MeSH feature vectors are given by ˜ f, ˜ f � . Sort � � � � ˜ f, ˜ f in ascending order so that f˜(1) ≤ f˜(2) ≤ . . . ≤ f˜(N ) and f˜(1) ≤ f˜(2) ≤ . . . ≤ f˜(N ) . The MeSH term ω is said to be more particular than ω � , denoted by ˜ f � if f �P ˜ N � � j=k
N � � � � � ˜� , ∀k = 1, 2, . . . , N. f˜(N ) − f˜(j) ≥ f˜(N − f ) (j)
(2)
j=k
Note that kurtosis which is a standard measure of peakedness was not found to be an adequate measure of particularity in our experiments. The above formalization of particularity (2) is based on the heuristic idea that more peaked frequency distributions will satisfy equation (2). The particularity criterion defined by equation (2) induces a partial ordering on the space of all MeSH feature vectors. N A particularity measure can be now formally defined as a mapping P : {[0, ∞)} → [0, ∞) that satisfies the following axioms: � � � � �N �N f � and j=1 f˜j = j=1 f˜j� , then P ˜ f ≥P ˜ f� . Axiom 1. If ˜ f �P ˜
� � � � Axiom 2. For any positive constant c, P ˜ f = P c.˜ f . We consider some standard measures of inequality of frequency distributions such as peak-toaverage ratios, Gini coefficient and entropy. Lemma 3. The peak to average ratio measure satisfies the axioms of particularity, where � � f˜(N ) � Peak to average ratio ˜ f = �� N ˜j /N f j=1
(3)
f � , it follows (by putting k Proof: The peak to average ratio clearly satisfies axiom 2. If ˜ f �P ˜ = 1 in equation (2)) N � � j=1
N � N N � � � � � � � ˜ ˜� f˜(N ) − f˜(j) ≥ f˜(N f˜j ≥ N.f˜(N f˜j� ) − f(j) ⇒ N.f(N ) − )− j=k
[Using the condition of axiom 1 that
�N
j=1
�N ˜� ˜ j=1 fj = j=1 fj ]
j=1
� f˜(N f˜(N ) ) � � � � ≥ ⇒ ⇒ f˜(N ) ≥ f˜(N ) �N ˜ �N ˜� � i=1 fi /N i=1 fi /N � � � � ⇒ Peak to average ratio ˜ f ≥ Peak to average ratio ˜ f� .
The Gini coefficient[30] is commonly used in economics as a measure of inequality of income distributions. For a frequency distribution vector f = (f1 , f2 , . . . , fN ):
�j N f 2 � j (k) − �k=1 Gini Coefficient (f ) = (4) N N + 1 j=1 N k=1 fk ˜ Note that the Gini coefficient is not a valid measure of particularity. Let ˜ f = (60, 20, 15, 5), � f � �= (55, 40, 5, 0). It is easy to check that ˜ f and ˜ f � satisfy the conditions of axiom 1 but Gini coefficient ˜ f = � � 0.85 < Gini coefficient ˜ f � = 1. The Theil Entropy is a measure of inequality[30] that came from electrical engineering. � �N �N j=1 fj logfj j=1 fj Theil Entropy (f ) = . (5) − log �N N j=1 fj This is not a valid measure of particularity as it violates axiom 1. (For example with ˜ f = (60, 20, 15, 5) and ˜ f � = (55, 40, 5, 0)). An alternate definition for particularity is given below that is based on the heuristic that the correct average condition is not on the frequencies, but on the differences from the peak. As it is similar to the majorization condition[26], we shall call such particularity measures majorization particularity or in brief m-particularity. Definition 4. A m-particularity measure is defined as a mapping M : {[0, ∞)} satisfies the following axioms:
N
→ [0, ∞) that
Axiom 3. If ˜ f �P ˜ f � and
� � � � � � � � �N � ˜ N ˜� ˜ ˜� ˜ ˜� j=1 f(N ) − f(j) = j=1 f(N ) − f(j) , then M f ≥ M f .
� � � � Axiom 4. For any positive constant c, M ˜ f = M c.˜ f .
In the theorem below, we
� show that the Gini coefficient and Theil entropy measures applied to f˜(N ) − f˜(j) : j = 1, 2, . . . , N are m-particularity measures. Theorem 5. The following are m-particularity measures: � � �N ˜(N ) − f˜(k) N f � k=N −j+1 2 j − � Gini m-particularity = �N � ˜ N + 1 j=1 N ˜ f − f (N ) (k) k=1 � � � �N � ˜ ˜ ˜ ˜ j=1 f(N ) − f(j) log f(N ) − f(j) � � Theil m-particularity = − �N ˜ ˜ j=1 f(N ) − f(j) � �N � ˜(N ) − f˜(j) f j=1 log (N )
(6)
(7)
Proof. Axiom 4 is clearly satisfied. The proof for the Gini particularity measure�follows directly � �N f � and j=1 f˜(N ) − f˜(j) = by applying the conditions of axiom 3 of m-particularity [i.e. ˜ f �P ˜ � �N � ˜� ˜� j=1 f(N ) − f(j) ] in equation (6). From [26], the conditions of axiom 1 are equivalent to the condition that for all continuous convex function φ N N � � � � � � φ f˜(N ) − f˜(j) ≥ φ f˜� − f˜� j=1
j=1
(N )
(j)
� � �N � ˜� �N � ˜� , the f − f Since the function φ(x) = x log(x) is convex and j=1 f˜(N ) − f˜(j) = j=1 (N ) (j) Note that the peak to average ratio is not a mresult for the Theil m-particularity follows. particularity measure as may not satisfy the conditions of m-particularity given in axiom 3. Measures of Particularity We have shown that Gini m-particularity as defined in equation (6) and Theil m-particularity as defined in equation (7) are measures of m-particularity. Based on the above, we also define the follow measures of particularity: N.f˜(N ) Peak to Average Ratio = �N ˜ j=1 fj �N �N Particularity index =
k=1
(8) �
j=k
�N
f˜(N ) − f˜(j)
k=1
f˜k
� (9)
These measures allow the words in the MeSH list to be ranked based on their degree of particularity. In order to achieve our objective of categorizing terms as generic or particular, we needed a threshold
for the particularity measures, above which a term would be classified as particular. Clearly, the threshold value should depend on the number of the genes in the cluster, though not linearly. If the cluster size is 10 genes and a term occurs very prominently with 2 of the genes, we would like to classify the term as particular. But if cluster size is 100 genes then a term which occurs prominently with 20 genes cannot be described as particular. The particularity threshold was chosen to be N 1/3 , where N is the size of the given cluster. A final sorting of the generic and particular lists was based on average normalized frequency.
3
Experiments and Results
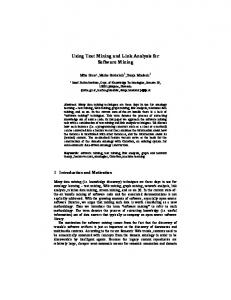
We considered three clusters of yeast genes for experimentation. These clusters of genes are known to be functionally related and have also been found in microarray experiments to have similar expression patterns. The MeSH cluster summaries based on overall relevance score and the generic/particular term summaries based on the particularity index are shown in Table 1 below. The MedMeSH implementation in JAVA is shown in the view for the Peroxin cluster in Fig. 2. Also note that Saccharomyces cerevisiae is the biological name of yeast and yeast is a fungus. Neither of this was specified in our PubMed queries, but Saccharomyces cerevisiae and many fungal related MeSH terms feature prominently in all the summaries shown in Table 1. 1. Glycolysis Cluster: Glycolysis is a process in all higher animals and most microorganisms, in which glucose in the cell is broken down. It is a series of chemical reactions, catalyzed by enzymes, in which glucose eventually is converted to pyruvate. Glycolysis is the primary means by which many anaerobic organisms obtain energy. Enzymes, being proteins, are the products of specific genes. The glycolysis cluster used here is the group of 17 yeast genes encoding the enzymes involved in glycolysis. Microarray experiments in diauxic shift[29] have determined clusters of over-expressed genes as being related to glycolysis. There are 17 genes in the cluster: ACS2, CDC19, ENO2, FBA1, GPM1, HXK2, PDC1, PDC5, PDC6, PFK1, PGK1, TDH1, TDH2, TDH3, TKL1, TPI1 and TYE7. Note that we have listed a single name for each gene, but the PubMed query used all the aliases for each of the genes. • In the summary for Glycolysis, the terms glucose and glycolysis are featured among the top 20 terms. • Pyruvate decarboxylase and phosphopyruvate hydratase are enzymes associated with synthesis/depletion of pyruvate, which is the end product of glycolysis. • Glyceraldehyde3-Phosphate Dehydrogenases (as quoted from the MeSH thesaurus) “is a group of 3 enzymes (NADP+), two of which are key enzymes in glycolysis”. • The E.coli and yeast glycolysis pathways being similar, E.coli also featured prominently. 2. Fatty Acid Cluster: The fatty acid cluster is a group of functionally related genes identified through microarray experiments on the yeast cell cycle[7]. They were found to be involved in lipid metabolism and fatty acid metabolism (hence the name) and were further studied in a text summarization context by Shatkay et al.[21]. There are 10 genes in this cluster: ELO1, OLE1, FAA4, FAA3, SUR2, FAA1, ERG2, PSD1, CYB5 and PGM1. • In the summary for the fatty acid cluster, MeSH terms associated with fatty acids and lipids are featured among the top 20 terms. • The term p53 occurs frequently because the OLE1 gene is also known as MDM2 and the MDM2 gene in humans regulates p53. p53 is an extremely well-studied, important oncogene and thus features in the cluster containing the yeast MDM2 gene. Note that this occurs in the list of particular terms. • Acyl coenyzme-A and Coenzyme A Ligases are coenzyme A derivatives that are involved in the biosynthesis and oxidation of fatty acids; acyltransferase, acetyltransferases are enzymes associated with the genes in the fatty acid cluster.
3. Peroxin Cluster: Peroxisome is a cellular microbody that houses reactions in which toxic peroxides are formed. The peroxisome isolates these peroxides from the rest of the cell. There are 19 genes in yeast that have been identified as being involved in peroxisome biogenesis. Moreover, disruption of these peroxin genes also results in a disease known as peroxisomal disorder. The peroxins can be divided into two distinct groups: those which are carrier proteins and involved exclusively in biological transport through the intracellular membrane, and those involved in peroxisome membrane biogenesis. There are 19 genes in the peroxin cluster known as PEX1,PEX2, etc. • In the summary for the peroxin cluster, MeSH terms that describe the peroxin cluster feature prominently in all summaries. These include microbodies, peroxisome, peroxisomal disorders, carrier proteins, intracellular membranes and biological transport. • Zellweger Syndrome is an autosomal recessive peroxisomal disorder that typically presents in the neonatal period and is usually fatal (according to the MeSH thesaurus). • Pichia are yeast-like fungi (of sacchromycetales family), in which phosphorylation of several PEX genes has been demonstrated. • Involvement of the endoplasmic reticulum in peroxisome membrane biogenesis and the role of receptors in the interaction of peroxin genes is well documented in the literature[31]. The results in Table 1 were based on specifying that the top 20 terms be listed and 60% of terms be generic. Therefore, it is expected that approximately terms will appear in the generic list for each cluster. This is the case with the glycolysis and fatty acid clusters shown in Table 1. However, the Perxoin cluster shows 15 generic terms and only 5 particular terms, indicating that the cluster is indeed quite homogeneous as most of the MeSH terms tend to occur with all or a majority of the genes.
4
Discussion and Future Directions
As observed in our results, certain terms associated with yeasts in general featured prominently. It is easily possible to apply “organism-specific MeSH stop word filters” in addition to our current list of MeSH stop words. Instead, in the spirit of user relevance feedback, we have implemented a filter interface as part of MedMeSH summarizer. This filter interface (Set Filter option in Fig. 2) allows the user to select and remove MeSH terms of his choice from the summary views. The summary views are then subsequently updated with new MeSH terms, recomputing all the scores. The user may also return previously removed MeSH terms to the list. Other features include histogram views of the normalized frequency distributions, the option to set the number of terms and the (expected) ratio of generic to particular terms. While we have used MeSH terms for summarization, there are some disadvantages associated with their use: there is a time lag between addition of citation to PubMed and MeSH term indexing of few weeks; there may be some inconsistencies in assigning MeSH terms due to subjectivity of human experts. We plan to explore how MedMeSH Summarizer may be improved by combining MeSH terms with the title and abstract information. We also plan to explore using the MeSH hierarchy in generating summary views.
Table 1. Results: MedMeSH Summarizer Cluster Summaries Cluster Name Glycolysis Cluster (17 genes)
Fatty Acid Cluster (10 genes)
Peroxin Cluster (19 genes)
Overall Relevance Score Saccharomyces cerevisiae Fungal Proteins Pyruvate Decarboxylase Gene Expression Regulation, Fungal Genes, Fungal Glyceraldehyde-3-Phosphate Dehydrogenases 6-Phosphofructokinase DNA, Fungal Isoenzymes Glucose Phosphopyruvate Hydratase Promoter Regions Plasmids Lyases Phosphoglycerate Kinase Transketolase Restriction Mapping Escherichia coli Glycolysis Hexokinase Saccharomyces cerevisiae Proto-Oncogene Proteins Protein p53 Potassium channels Fungal proteins Coenzyme A Ligases Fatty acids Genes, Fungal DNA, Fungal Escherichia coli Fatty acids, Unsaturated Acyltransferases Receptors, Drug Kinetics Acyl Coenzyme A Carrier Proteins Steroid Isomerases Phenotype Lipids Gene Expression Regulation, Fungal Fungal Proteins Microbodies Receptors, Cytolpasmic and Nuclear Saccharomyces cerevisiae Peroxisomes Pichia Carrier Proteins Intracellular Membranes Peroxisomal disorders Sacchromycetales Zellweger Syndrome Fibroblasts Adenosine triphosphate Biological Transport Models, Biological Genetic Complementation Test Microscopy, Electron Endoplasmic Reticulum Glycoproteins Escherichia coli
Top 20 Terms Generic Topics
Particular Topics
Saccharomyces cerevisiae Fungal Proteins Pyruvate Decarboxylase Genes,Fungal Isoenzymes Gene Expression Regulation, Fungal DNA, Fungal Glucose Glyceraldehyde-3-Phosphate Dehydrogenases Promoter Regions(Genetics) Plasmids Escherichia coli
6-Phosphofructokinase Phosphoglycerate Kinase Lyases Transketolase Fructose-Biphosphate Aldolase Hemolysins Hexokinase Pyruvate Kinase
Saccharomyces cerevisiae Coenzyme A Ligases Fatty acids Fungal Proteins Escherichia coli Genes, Fungal DNA, Fungal Fatty Acids, Unsaturated Acyltransferases Acyl Coenzyme A Fatty acids, Monosaturated Acetyltransferases
Potassium channels Proto-Oncogene Proteins Protein p53 Cytochrome b5 Carboxy-Lyases Receptors, Drug Steroid Isomerases Sphingosine
Fungal Proteins Microbodies Receptors, Cytoplasmic and Nuclear Saccharomyces cerevisiae Peroxisomes Pichia Carrier Proteins Intracellular membranes Peroxisomal Disorders Saccharomycetales Zellweger Syndrome Adenosine triphosphate Fibrobalsts Biological transport Endoplasmic Reticulum
Phosphoproteins Yeasts src Homology Domains Lung Neoplasms Carbon-Carbon Double Bond Isomerases
Figure 2. The MedMeSH Summarizer View for the Peroxin genes
Bibliography [1] M. Schena, D. Shalon, R. Davis and P. O. Brown, Quantitative monitoring of gene expression patterns with a complementary DNA microarray, Science, 270 (1995), pp. 467-470. [2] D. Shalon, S. J. Smith and P. O. Brown, A DNA microarray system for analyzing complex DNA samples using two-color fluorescent probe hybridization, Genome Research, 6 (1996), pp. 639-645. [3] D. J. Duggan, M. Bittner, Y. Chen, P. Meltzer and J. M. Trent, Expression profiling using cDNA microarray, Nature Genetics, 21 (1999), pp. 10-14. [4] P. O. Brown and D. Botstein, Exploring the new world of the genome with DNA microarrays, Nature Genetics, 21 (1999), pp. 33-37. [5] R. J. Lipshutz, S. P. Fodor, T. R. Gingeras and D. J. Lockhart, High density synthetic oligonucleotide arrays, Nature Genetics, 21 (1999), pp. 20-24. [6] D. J. Lockhart, H. Dong, M. C. Byrne and M. T. Follettie et al., Expression monitoring by hybridization to high-density oligonucleotide arrays, Nature Biotechnology, 14 (1996), pp. 1675-1680. [7] P. T. Spellman, G. Sherlock and M. Q. Zhang and V. R. Iyer et al., Comprehensive Identification of Cell Cycleregulated Genes of the Yeast Saccharomyces cerevisiae by Microarray Hybridization, Molecular Biology of the Cell, 9 (1998), pp. 3273-3297. [8] T. R. Golub, D. K. Slonim, P. Tamayo and C. Huard et al., Molecular classifcation of cancer: class discovery and class prediction by gene expression monitoring, Science, 286 (1999), pp. 531-537. [9] M. B. Eisen, P. T. Spellman, P. O. Brown and D. Botstein, Cluster analysis and display of genome-wide expression patterns, Proc Natl Acad Sci USA, 95 (1998), pp. 1486314868. [10] T Kohonen, Self-Organizing Maps, Springer, New York, NY, 1997. [11] P. Tamayo, D. Slonim, J. Mesirov and Q. Zhu, et al., Interpreting patterns of gene expression with self-organizing maps: methods and application to hematopoietic differentiation, Proc Natl Acad Sci USA, 96 (1999), pp. 2907-2912. [12] A. Brazma, I. Jonassen, J. Vilo and E. Ukkonen, Predicting gene regulatory elements in silico on a genomic scale, Genome Research, 8 (1998), pp. 1202-1215. [13] L. Juhl-Jensen L and S. Knudsen, Automatic discovery of regulatory patterns in promoter regions based on whole cell expression data and functional annotation, Bioinformatics, 16 (2000), pp. 326-333.
[14] A. Zien, Analysis of gene expression data with pathway scores, Proceedings of the Intelligent Systems for Molecular Biology, 2000. [15] M. P. Kurhekar, S. Adak, S. Jhunjhunwala and K. Raghupathy, Genome-wide pathway analysis and visualization using gene expression data, Proceedings of the Pacific Symposium of Biocomputing, 2002. To appear. [16] C. D. Paice, Constructing Literature abstracts by computer: Techniques and Prospects, Information Processing and Management, 26:1 (1990), pp. 171-186. [17] C. D. Paice and P. Jones, The identification of important concepts in highly structured technical papers, Proceedings of the ACM-SIGIR, Pittsburgh, PA, 1993. [18] K. Sparck-Jones, Summarization: Where are we now? Where should we go?, Proceedings of the ACL/EACL ’97 Workshop on Intelligent, Scalable text summarization, Madrid, Spain, 1997. [19] I. Ilipoulos, A. J. Enright and C. A. Ouzonis, TEXTQUEST: Document Clustering of Medline Abstracts for concept discovery in molecular biology, Proceedings of the Pacific Symposium of Biocomputing 2001, pp. 384-395. [20] L. Tanabe, U. Scherf, L. H. Smith and J. K. h Lee et al., MedMiner: An Internet Text-Mining Tool for Biomedical Information, with Application to Gene Expression Profiling, Biotechniques, 27 (1999), pp. 1210-1217. [21] H. Shatkay, S. Edwards, J. Wilbur and M. Boguski, Genes, Themes and Microarrays: Using Information Retrieval for Large-Scale Gene Analysis, Proceedings of the Intelligent Systems for Molecular Biology, 2000. [22] T. Hofmann and J. Puzicha, Statistical models for co-occurence data, Technical Report, M.I.T. Artificial Intelligence Laboratory (1998), A.I. Memo No. 1625. [23] T. Fukuhura, H. Takeda and T. Nishida, Multiple text-summarization for collective knowledge formation, Workshop on Social Aspects of Knowledge and Memory(IEEE Systems, Man and Cybernetics Conference), 1999. [24] C. Dwork, R. Kumar, M. Naor and D. Sivakumar, Rank aggregation methods for the Web, The tenth international World Wide Web conference on World Wide Web, 2001, pp. 613-622. [25] M. Truchon, Figure Skating and the Theory of Social Choice, Technical Report, Universite Laval, Departement d’economique, 1998. [26] A. W. Marshall and I. Olkin, Inequalities: Theory of Majorization and its applications, Academic Press, New York, NY, 1979. [27] L. Gravano and H. Garcia-Molina, Merging Ranks from heterogeneous internet sources, Proceedings of VLDB, 1997. [28] L. A. Adamic, Zipf, Power-laws, and Pareto - a ranking http://www.parc.xerox.com/istl/groups/iea/papers/ranking/, October 2000.
tutorial,
[29] J. L. DeRisi, V. R. Iyer and P. O. Brown, Exploring the Metabolic and Genetic Control of Gene Expression on a Genomic Scale, Science 278 (1997), pp. 680-686. [30] A. Sen, On Economic Inequality, Oxford University Press, UK, 1973.
[31] W. H. Kunau and R. Erdmann, Peroxisome biogenesis: Back to the endoplasmic reticulum?, Current Biology, 8 (1998), pp. R299-R302. [32] M. W. Berry, S. T. Dumais and G. W. O’Brien, Using Linear Algebra for Intelligent Information Retrieval, SIAM Review, 37:4 (1995), pp. 573-595.