Gest. Prod., São Carlos, v. 19, n. 4, p. 663-675, 2012
Memory embedded in Markov models specified in Statecharts: simulation versus analytical approaches Tratamento de memória em modelos Markovianos especificados em Statecharts: abordagens por simulação e analítica Nandamudi Lankalapalli Vijaykumar1 Gian Ricardo Berkenbrock2 Solon Venâncio de Carvalho1 Valéria Maria Barros de Andrade3 Gurrala Veereswara Swamy4 Mokka Jagannadha Rao5 Abstract: Statecharts are a graphical representation to model reactive systems that respond to external or internal stimuli by changing the state of a given system. Statecharts can be seen as an extension of state-transition diagrams that allows modeling hierarchy, orthogonality, and interdependence. Due to their features to represent reactive systems, Statecharts have been adapted to represent and deal analytically with performance models (reactive systems whose performance is to be evaluated). An interesting feature present in Statecharts is to record the system’s state, which cannot be represented in Markov models in a straightforward manner due to its “memory-less” property. The contributions of this paper are: show that Statecharts are a feasible alternative to specify a reactive system so that its performance can be evaluated by both analytical and simulation techniques; show that the inclusion of the memory representation in the Statecharts specification can indeed be made by both analytical and simulation techniques. The results of a case study of a manufacturing system show that the objectives are achieved. Keywords: Performance models. Statecharts specification. Memory representation. Analytical solutions. Continuous‑time Markov chains. Simulation.
Resumo: Statecharts representam graficamente sistemas reativos que respondem aos estímulos externos ou internos e mudam estados de um dado sistema. Statecharts estendem diagramas de estado com hierarquia, paralelismo e interdependência. Devido às suas características, eles foram adaptados para representar e tratar analiticamente modelos de desempenho (sistemas reativos cujo desempenho deve ser avaliado). Uma característica presente em Statecharts é registrar (ou memorizar) um estado do sistema que não é possível representar numa forma direta em modelos Markovianos devido à sua propriedade de “sem memória”. São duas as contribuições deste artigo: mostrar que Statecharts são viáveis para especificar sistemas reativos e avaliar o seu desempenho tanto por técnicas analíticas quanto por simulação; mostrar que a inclusão de representação de memória em Statecharts pode, de fato, ser tratada por abordagens analíticas e de simulação. Um estudo de caso de um sistema de manufatura é considerado para mostrar que os objetivos foram alcançados. Palavras-chave: Modelos de desempenho. Statecharts. Representação de memória. Soluções analíticas. Cadeias de Markov a tempo contínuo. Simulação.
1
Laboratory of Computing and Applied Mathematics, National Institute for Space Research, CP 515, CEP 12245-970, São José dos Campos, SP, Brazil, e-mail:
[email protected]
2
Department of Computer Science, Santa Catarina State University – UDESC, CEP 89219-710, Joinville, SC, Brazil, e-mail:
[email protected]
3
Mentor Tecnologia, Av. Adhemar de Barros, 633, CEP 12245-010, São José dos Campos, SP, Brazil, e-mail:
[email protected]
4
Department of Computer Science, Githam University, Visakhapatnam, AP, India, e-mail:
[email protected]
5
Delta Studies Institute, Andhra University, Visakhapatnam, AP, India, e-mail:
[email protected]
Recebido em 30/11/2011 — Aceito em 17/9/2012 Suporte financeiro: PROCAD/CAPES (Projeto NF 776/2010).
664 Vijaykumar et al.
1 Introduction In systems design, usually, analysts or engineers must be capable of predicting the system performance, so that it is possible to avoid possible bottlenecks, as well as understanding the system behavior, both in the best and the worst case scenarios. An option to deal with this issue is to depend on the knowledge and expertise of the system administrator. An alternative is to use performance models so that one can infer the behavior of the system. Performance models are those models which are reactive systems from which their behavior can be determined. Such models can be applied for capacity planning, manufacturing systems performance analysis, alternative systems, capacity expansion, spare parts inventory management (GOMES; WANKE, 2008) and maintenance systems (DE MARCHI; CARVALHO; MORAIS, 2001). These application areas play a key role in production management since they enable engineers to conduct studies on different options by changing the performance models. Several performance evaluation methods are available in the literature, and they are generally associated to stochastic processes that are mathematically well defined and can be handled computationally. Such methods use approaches such as measuring or modeling. Measurements, benchmarking, and prototyping are measuring approaches. Modeling uses a specification method to represent a given system behavior, and then a technique – either by simulation or by analytical approach – is associated to the specification; one issue is the representation of performance models. Usually systems whose performance has to be evaluated fall into the category of reactive systems. Reactive systems are those that respond to external or internal stimuli also known as events. Events are a perturbation in the behavior, and they change the present state (for instance, idle to processing). One way to represent reactive systems is a Finite State Machine (FSM) whose representation is achieved through a state-transition diagram. FSM consists of states and transition between states. The change of one state to another occurs based on a label on the transition which corresponds to an event. Therefore, if a system whose performance is to be measured can be represented by an FSM, then it is possible to associate this representation with a technique (analytical approach or simulation) in order to obtain its performance evaluation. In case of a technique by means of analytical approach, Markov chains are usually employed. FSM resembles very much a Markov chain since a Markov chain is also represented as a set of states and transitions driven by events (continuous-time Markov chain) or probabilities (discrete-time Markov chain).
Gest. Prod., São Carlos, v. 19, n. 4, p. 663-675, 2012
Modern complex systems require explicit representation of depth and parallelism. A clear visualization of systems with several parallel components becomes difficult by means of state‑transition diagram thus requiring a consideration of using higher-level techniques (queuing networks (KLEINROCK, 1976), Generalized Stochastic Petri Nets (CHIOLA; MARSAN; CONTE, 1993) and Statecharts (HAREL, 1987). Our proposal uses the Statecharts approach to represent and deal with performance models (VIJAYKUMAR; CARVALHO; ABDURAHIMAN, 2002). Performance models have been used to observe the behavior of a reactive system to understand these systems without the need of physically implementing them Accordingly, some metrics can be very interesting for determining performance, for instance, response time, throughput, utilization, etc. Now, the problem is not only to represent the model, but also to solve it so that performance metrics of interest can be obtained. With respect to this, the PerformCharts tool was used to analytically determine these metrics. However, in performance models, it is common to face a situation where after a component is turned off, a return to “the last active state” of that component is necessary. As an example, let’s consider a model in which a robot is responsible to do some service. In the event of a breakdown, the robot has to be repaired, and it should return to the state where it was before the breakdown to finish the interrupted task. This is easily represented in Statecharts, as shown in the following sections. The problem is to solve the model using Markov chain. However, the memory-less property of Markov chains – future depends only on the present and not on the past – has to be handled. Markov chains are simple and can deal with uncertainty enabling analyzing complex systems in the areas of production, industrial engineering mathematics, computer science, operations research, and others (SHESKIN, 2010; HERMANNS et al., 2000). In the area of production control, the task of dealing with varying service times to properly estimate manufacturing times is not an easy task. Therefore, Markov chains in queuing theory added to analysis of real queue systems with layout constraints have generated a hybrid model to access such systems (ABEDI et al., 2010). Thus, this study aims at discussing how memory can be automatically eliminated from Statecharts models when converting the specification (from Statecharts models) in a Markov chain (VIJAYKUMAR et al., 2002). Vijaykumar, Carvalho and Abdurahiman (2002) proposed the use of Statecharts to represent Markov chains without dealing with the memory issue, which is a very interesting feature of Statecharts. Only one algorithm was discussed in Vijaykumar et al. (2002). However, a real implementation was not properly done
Memory embedded in Markov models specified in Statecharts: ...
using adequate testing in several reactive systems . In addition, the same specification is used in Statecharts to generate the performance evaluation by adopting the simulation approach. The PerformCharts tool deals only with analytical solution. It is necessary to incorporate the solution via Simulation as well. The advantages of this approach are to study the feasibility of incorporating this into the tool and to validate the PerformCharts tool. In order to deal with the simulation solution, the system simulation model was developed, and the simulation executive is based on the three-phase approach specified by Pidd (1998). This modeling approach maps two types of activity: unconditional and conditional activity. Unconditional activity also known as B activity is processed at the due simulation time, and conditional activity or C activity is processed only when the condition is accepted. There is also another activity, A activity or A phase, which is concerned with time advancement or time scan. The next section briefly introduces Statecharts, in particular, how the memory feature is represented. In order to adapt Statecharts to be used in performance evaluation, a tool named PerformCharts has been developed. Section 3 shows the tool by describing how the Statecharts representation is handled to obtain performance measures. Section 4 deals with the memory feature represented in Statecharts and how this has been implemented in the PerformCharts tool. A case study as well as its solution to obtain performance metrics through PerformCharts is presented in Section 5. As previously mentioned, the PerformCharts tool deals with performance evaluation using only an analytical approach, and it is expected to include the solution by means of Simulation. Therefore, a simulation solution is developed in order to compare the results from an analytical approach without implementation of PerformCharts. The simulation approach has also been based on the Statecharts representation. This is presented in Section 6. Finally, some conclusions about the use of a high-level specification technique and its association with both Markov chain and simulation approach are presented.
2 Statecharts Statecharts are graphical-oriented and are capable of specifying reactive systems. They have been originally developed to represent and simulate real time systems. Moreover, Statecharts are formal (HAREL, 1987) and (HAREL; POLITI, 1998), and their syntax and semantics enable considering complex logic to represent the behavior of reactive systems. They extend state-transition diagrams by incorporating notions of hierarchy (depth), orthogonality (represent‑tation of parallel activities), and interdependence (broadcast-communication).
665
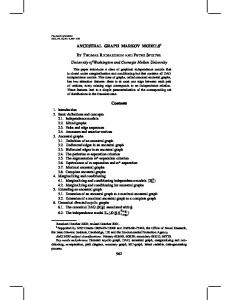
The states are clustered to represent depth. This feature enables combining a set of states with common transitions into a macro-state also known as super-state. Super-state refinement can be achieved by means of XOR decomposition and AND decomposition. The former decomposition may be used whenever an encapsulation is required. When a super-state in a high level of abstraction is active, one (and only one) of its sub-states is indeed active. The AND decomposition represents concurrency, i.e., when a super-state is active, all of its sub-states are active. A state is BASIC when there are no further refinements from it. In Statecharts, the global state of a given model is referred to as a configuration that is the active basic states of each orthogonal component. A complete syntax and semantics of Statecharts are described in Harel (1987), Harel et al. (1987) and Harel and Politi (1998). By definition, when modeling a given system, there must always be an initial state, a default state, in Statecharts. Thus, the initial configuration consists of active basic states of each orthogonal component. However, the default state can be bypassed by using history, i.e. when a system becomes active the most recently visited state becomes active. This is indicated by the symbol H. It is also possible to use the history all the way down to the lowest level as defined in the Statecharts formalism (HAREL, 1987). In this case, the symbol H* is used. In order to influence only certain levels of abstraction, the symbol H should be applied to the appropriate level. The history feature is shown in Figure 1. Let’s consider equipment E that has as a sub-state a macro-state A, which is an XOR state. Its sub-states are W (idle), and the macro-states T1, and T2 that represent two types of jobs T1 and T2 have further refinements into basic states T11 and T12 and T21 and T22, respectively. E behaves as follows: when idle (state W), it can be requested to process either T1 or T2. Event a1 triggers the job type T1, whereas event a2 triggers type T2. End of service is represented by events s1 and s2 for jobs T1 and T2, respectively. Both types of jobs have to undergo two sub-processes, T11 and T12 (in case of T1) and T21 and T22 (in case of T2). When the equipment is busy, it may fail, and this takes to state F. (Failure) via event f. Note that the guard condition not in(W) is attached to guarantee that the equipment may fail only when it is not idle. When the failure is corrected, the last state visited becomes active, represented by H. In Figure 1a, when the super-state A becomes active, the most recently visited state (T1 or T2) will become active bypassing the default state. When T1 is the most recently visited state, the sub-state T11 will become active since it is the default state within T1. With regard to T2, sub-state T21 (default state within T2) is the one
Gest. Prod., São Carlos, v. 19, n. 4, p. 663-675, 2012
666 Vijaykumar et al.
that will become active. In Figure 1b, H* is used to indicate that all levels within the hierarchy will be affected. For example, if T2 is the most recently visited state, either sub-state T21 or T22 will become active. The literature shows several applications of Statecharts. They have become quite popular due to their visual appeal making them feasible to describe complex logic in reactive systems. Recently, Li, Tong and Nian (2010) have formalized Statecharts semantics including history states employing temporal description logic to be used in validation. Haschemi (2009) proposed coverage criteria for black box testing for model-based testing for Statecharts. History is taken into consideration in these coverage criteria. Wagstaff, Peters and Scharenbroich (2008) proposed a system to convert text-based specification into UML Statecharts in order to generate code in C or C++. They consider entry by history specification as well. Vijaykumar et al. (2006) proposed a solution to specify history states in Statecharts for Performance Evaluation based on Markov chains. However, they have never implemented or validated this approach.
3 PerformCharts: construction of a continuous-time Markov chain from a Statetcharts model A continuous-Time Markov Chain consisting of transition rates among states is solved through numerical methods (SILVA; MUNTZ, 1992; PHILIPPE; SAAD; STEWART, 1992) to determine the steady-state probabilities. Thus, the problem is solved if the model represented by Statecharts is
converted into a Markov chain that corresponds to the behavior of the specified model (VIJAYKUMAR; CARVALHO; ABDURAHIMAN, 2002). Therefore, the PerformCharts tool is responsible to automatically generate a Markov chain from a Statecharts specification. Once a model is represented by Statecharts, the enabled events must be stimulated so that new configurations (set of active states of all parallel components) are obtained. Internal events (true(condition), false(condition) – abbreviated respectively as tr and fs – and actions) are automatically sensed and stimulated. External events must be explicitly stimulated to describe the dynamics of the modeled system behavior. In order to enable the association of Statecharts model with a Markov chain, the only type of external events that can be considered are stochastic events. The time between their activation and their occurrence follows a stochastic distribution, which, in particular, has to be exponential. An example is used to illustrate the process of converting Statecharts specification into a Markov chain. Let’s consider a system with three parallel components that correspond to two machinery equipment and a supervisor to repair any failure in the equipment, as shown in Figure 2. Components E1 and E2 denote the equipment, whereas the component Supervisor repairs the equipment when it fails and a priority is provided to repair E1 whenever there is the occurrence of double equipment failure. E1 and E2 are XOR macro-states and have similar behavior to that of the basic states W1, P1, and B1 and W2, P2, and B2, respectively. W1 and
a
Figure 1. a) History in a single level; b) History in all the hierarchy levels.
b
Memory embedded in Markov models specified in Statecharts: ...
W2 represent that E1 and E2 are idle, and processing a job means that these components, equipment E1 and equipment E2, are in P1 (and P2). Both E1 and E2 are subject to failure, and in this case, the states P1 and P2 move to states B1 and B2. Supervisor is an XOR macro-state, and its idle state is represented by WS. C1 and C2 represent, respectively, repairing E1 and E2. The list of stochastic events (exponentially distributed) includes a1, r1, f1, s1 a2, r2, f2, and s2. Internal events are tr[in(B1)] and tr[in(B2) ^ ¬in(B1)]. Actions c1 and c2 that are fired once the events s1 and s2 are taken are also considered as internal events (without delay time, i.e., immediate transition). A brief explanation of the events is given in Table 1. Therefore, a reaction is performed by first checking the internal events that may be enabled according to the initial configuration and then stimulating these enabled events. In the example in Figure 2, there are no active internal events for the initial configuration
667
(W1, W2, WS). Hence, the external events have to be listed. For the initial configuration, the enabled stochastic events are a1 and a2. Therefore, these events will be stimulated or triggered so that transitions are fired to yield new configurations. When the system is in the initial configuration and a1 is triggered, the next configuration is P1, W2, and WS. Suppose that during the process of stimulating the events, the resulting configuration is (B1, B2, WS). In this case, the active events are the so called immediate events tr[in(B1)] and tr[(in(B2) ^ ¬in(B1)]. These are the events that have to be checked and enabled before the stochastic events, i.e., even though there are enabled stochastic events, the immediate events (true(condition) and false(condition)) are those that have to be stimulated. The corresponding state-transition diagram is shown in Figure 3. As one can notice, this diagram contains only stochastic events that follow exponential
Figure 2. Statecharts representation of an equipment with a repairer. Table 1. Brief explanation of events in Figure 2.
Event a1 r1 f1 c1 a2 r2 f2 c2 tr[in(B1)]
Type Stochastic Stochastic Stochastic Internal Stochastic Stochastic Stochastic Internal Internal
tr[in(B2) ^ not in(B1)]
Internal
s1 s2
External External
Meaning Arrival of a job for E1 End of service by E1 Failure of E1 E1 repaired Arrival of a job for E2 End of service by E2 Failure of E2 E2 repaired B1 (in E1) is active B2 (in E2) is active AND B1(in E1) is NOT active End of repair of E1 End of repair of E2
668 Vijaykumar et al.
distribution. The states and arcs with events following exponential distribution compose a Markov chain with which numerical methods can be applied to determine steady-state probabilities, the basis for calculating performance metrics. According to the example previously shown, it should be clear that the translation from a Statecharts representation into a Markov chain is not a “blind” AND product. Otherwise, the Statecharts in Figure 2 would result into a 27-state diagram instead of 10-state diagram (Figure 3). However, one must consider the well-known problem of state-space explosion that still exists and depends very much on the number of components and number of sub-states within each component. The advantage is that the Statecharts specification of the model is represented in a “cleaner” fashion instead of a web of arcs traversing among several hundreds of states. Questions may arise with respect to the process of reaction. Especially, what happens when more than one stochastic event in separate components become active. These events are put into a sequence and stimulated one after another. So far, all examples tested generated the same Markov chain regardless of the order in which the events are stimulated. This can be seen in Figure 3. By taking any configuration, at which more than one exponentially distributed stochastic event exists, the resulting configurations are the same regardless of the order in which the events are stimulated. However, in order to guarantee this, a formal proof has to be considered and developed which is not within the scope of the present study. There might be cases in which the logical behavior of a complex system depends on the order of the events; then a time parameter (associated to an event)
Figure 3. Markov chain of Figure 2.
Gest. Prod., São Carlos, v. 19, n. 4, p. 663-675, 2012
has to be defined or some type of alternative ways of synchronization must be made. The subset implemented in PerformCharts is shown in Table 2.
4 PerformCharts: handling memory in Markov models represented in Statecharts One powerful feature provided in Statecharts is the Entry by History. Due to the memoryless property in the Markov chains, Entry by History seems, at a first glance, not to be compatible with Markov models since it has to depend on the past. However, in fact, memory is frequently introduced in Markov models just by adding the necessary past information into the state space as an additional component. Due to the visual appeal of Statecharts and its Entry by History feature, the representation of performance models can be very much improved (VIJAYKUMAR et al., 2002). The main idea consists of adding the history information in each possible “present” state configuration by creating a new orthogonal component to the root state. In order to illustrate this idea, let’s consider the example in Figure 4 in which the history feature is depicted. Figure 4 illustrates an equipment that accepts requests for three types of services T1, T2, or T3. Event a1 takes the equipment to process service T1, event a2 to service type T2, and event a3 to service type T3. The equipment may fail, but it is assumed that the failure occurs during the processing, and the event f takes the equipment to a failure state F. Once it is repaired, it returns to the last active service (T1 or T2, or T3). Figure 4 shows the representation of an equipment that when returning from F state to P
669
Memory embedded in Markov models specified in Statecharts: ...
Table 2. Subset of Statecharts supported by PerformCharts tool (SANTIAGO JÚNIOR, 2011).
Syntax feature States Shallow and deep History Hierarchy function Type function Default function Expressions: If k is a number then k ∈ V Expressions: If v ∈ Vp then v ∈ V Expressions: If v ∈ V then current (v) ∈ V Expressions: If v1,v2 ∈V and op is an algebraic operation then op(v1,v2) ∈V Conditions: T, F ∈ C, T, F stand for true, false, respectively Conditions: If c ∈ Cp then c ∈ C Conditions: If s ∈ S then in(s) ∈ C Conditions: If e ∈ E then not_yet(e) ∈ C Conditions: If u, v ∈ V, R ∈{=, >,