source of performance problems for multi-threaded software .... operating system, Compute Node Linux (CNL), presents a .... Load Latency Performance Monitoring Facility extensions .... The best solution is to avoid NUMA problems from the.
Memphis: Finding and Fixing NUMA-related Performance Problems on Multi-core Platforms Collin McCurdy and Jeffrey Vetter Future Technologies Group Oak Ridge National Laboratory Oak Ridge TN, USA {cmccurdy,vetter}@ornl.gov Abstract—Until recently, most high-end scientific applications have been immune to performance problems caused by NonUniform Memory Access (NUMA). However, current trends in micro-processor design are pushing NUMA to smaller and smaller scales. This paper examines the current state of NUMA and makes several contributions. First, we summarize the performance problems that NUMA can present for multithreaded applications and describe methods of addressing them. Second, we demonstrate that NUMA can indeed be a significant problem for scientific applications, showing that it can mean the difference between an application scaling perfectly and failing to scale at all. Third, we describe, in increasing order of usefulness, three methods of using hardware performance counters to aid in finding NUMA-related problems. Finally, we introduce Memphis, a data-centric toolset that uses Instruction Based Sampling to help pinpoint problematic memory accesses, and demonstrate how we used it to improve the performance of several production-level codes – HYCOM, XGC1 and CAM – by 13%, 23% and 24% respectively.
I.
INTRODUCTION
Non-Uniform Memory Access (NUMA) has been the source of performance problems for multi-threaded software running on scalable distributed shared memory platforms for years. Programmers on large-scale NUMA systems, such as the SGI Altix [1], have learned that unless they are careful, their multi-threaded applications are susceptible to two categories of performance problems that commonly arise when some memory is close and the rest is farther away: •
Interconnect congestion due to memory hot-spots.
•
Latency, and potential bandwidth saturation, due to remote memory accesses resulting from computationpartition/data-distribution mismatches.
Until recently, high-end scientific applications – which tend to use multi-threading, if at all, only within a Symmetric Multiprocessing (SMP) node, passing messages between nodes – have been immune to NUMA problems; by definition, SMPs offer uniform memory access latency. The submitted manuscript has been authored by a contractor of the U.S. Government under Contract No. DE-AC05-00OR22725. Accordingly, the U.S. Government retains a non-exclusive, royalty-free license to publish or reproduce the published form of this contribution, or allow others to do so, for U.S. Government purposes.
However, two trends in microprocessor design are bringing NUMA to SMPs. First is the movement toward putting the memory controller on the same die as the CPU, beginning with AMD’s Opteron processor [2], and continuing with IBM’s Power5 [3] and, most recently, Intel’s Nehalem [4]. On-chip memory controllers can substantially increase memory performance by reducing the number of chip boundary crossings required by memory references that miss in cache from two (once when crossing the memory bus to get to the memory controller, and then again to get to DRAM) to one. Removing the memory bus, however, makes the design of a true SMP platform – historically built on top of the memory bus, with multiple processors on one side and memory on the other – much more challenging, if not impossible. Multiprocessors built out of CPUs with on-chip memory controllers typically implement a shared physical address space via a point-to-point network between processing elements, and a modified cache-coherence protocol that enables automatic access of data in a remote memory. The result is classic NUMA: cores experience lower latency when accessing memory attached to the memory controller on their chip than when accessing memory attached to another chip. While AMD and Intel refer to their networks explicitly (HyperTransport (HT), and QuickPath Interconnect (QPI) respectively), IBM continues to refer to its network as the “SMP interconnect,” and went to some lengths to hide NUMA effects from users of the Power5. Power6, however, does expose NUMA aspects to users [5]. A second design trend, the ever-increasing number of cores per chip, exacerbates the effect of NUMA performance problems by increasing contention for a limited resource, the on-chip memory controller. An inevitable consequence of this second trend is that, while current implementations are still only NUMA between sockets, soon there will be implementations that are NUMA within a socket. AMD, Intel and IBM have all revealed future designs with multiple memory controllers, physically located in different parts of the chip(s) that comprise a socket, implying asymmetric access latencies for cores within the socket. Fortunately for programmers, the same trends that are forcing them to be aware of NUMA pitfalls are serving to make it easier to identify NUMA problems: when the network interface is on the same chip as the CPU, programmers have increased access to hardware performance counters that can
Normalized Excecution Time
1 0.8 0.6 NAS-MPI
0.4 0.2
OMNI-OMP
0 1 socket 2 sockets (4 cores) (8 cores)
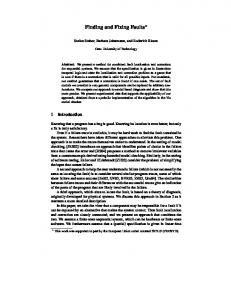
Figure 1: Data for CG demonstrating the problem with NUMA. Performance normalized to the single-socket NAS-MPI result.
help identify remote memory accesses at the heart of NUMArelated performance problems. Also in favor of programmers, many years of experience with NUMA problems have yielded a mature set of tools for dealing with them, now included in mainstream programming environments and operating systems. Given the growing importance of NUMA, this paper makes several contributions. First, we demonstrate that NUMA can indeed be a significant – even insidious – problem for scientific applications, showing that it can mean the difference between an application scaling perfectly across multiple sockets and failing to scale at all. Second, we identify, in increasing order of usefulness, three methods of using newly available hardware performance counters to aid in finding NUMA-related problems. Third, we describe methods of addressing problems caused by NUMA in different programming environments. Finally, we introduce Memphis, a data-centric toolset that uses Instruction Based Sampling to help pinpoint problematic memory accesses. In our evaluation of the tool, we describe how we used it to locate NUMA problems in several production-level codes – HYCOM, XGC1 and CAM – that when fixed, yielded performance improvements of 13%, 23% and 24% respectively. II.
IS NUMA A REAL PROBLEM?
Our first awareness of NUMA as a problem within an SMP node came when we were presented with the data in Figure 1. The data is taken from runs of two versions of the CG benchmark from the NAS Parallel Benchmark (NPB) Suite [6] – one MPI [7], the other OpenMP [8] – on a single node of Jaguar, a Cray XT5 system located at Oak Ridge National Laboratory. At the time, a Jaguar node consisted of two quadcore AMD Opteron processors connected via two HyperTransport links on a dual-socket board. The XT5 operating system, Compute Node Linux (CNL), presents a single system image across the two sockets, allowing a maximum of eight threads per node when each thread is pinned to a unique core. As the name suggests, CNL is a strippeddown Linux implementation, the benefits of which are evident both in performance of individual runs and in the consistency of timings between runs.
As the figure demonstrates, while the OpenMP version significantly out-performs the MPI version on four cores, it fails to scale to eight cores; the MPI version, on the other hand, scales nearly perfectly. Our initial hypothesis to explain the data was that the difference must be attributable to the difference in how data is communicated in MPI versus OpenMP. Given that the latency of Opteron’s inter-core network is significantly lower within a socket than between sockets, our thought was that the performance degradation in the OpenMP case must be the result of increased latency for frequent cache coherence traffic with the introduction of threads running on the second socket. MPI on the other hand would suffer less from increased latency by taking advantage of bandwidth and less frequent communication events. However, while ruling out other possibilities, we found that the root of the problem was actually a NUMA-unaware initialization routine; the result of the initialization was that space for all arrays in the benchmark was allocated in the memory of a single socket. Every memory reference from cores in the other socket had to cross the HT link twice, increasing the memory latency for those cores, and also increasing memory contention for all cores. Modifying a few lines of code to make the initialization routine NUMA-aware (see Section VI.A) translates into significantly increased performance when spanning sockets. The result is nearly the same performance advantage over MPI at eight threads as at four threads, literally making the difference between the benchmark scaling and not scaling. Figure 2 demonstrates that this is not an isolated effect. In the figure, the label NAS-OMP refers to the latest OpenMP implementation of the suite available from NASA’s Advanced Supercomputing Division (NAS) [7]. OMNI-OMP refers to an earlier OpenMP implementation, still available from the OMNI compiler group [8]. While the OMNI suite is significantly older, it has retained a user-base in the research community, probably due to the fact that it is C language-based while the NAS implementations are Fortran-based. The results in Figure 2(a), from runs on a single socket of a node (6 cores of the new Jaguar), demonstrate that the OMNI implementations of CG and MG benchmarks, while slightly slower than their NAS counterparts, are very respectable parallelizations, and that FT at about 30% slower is still reasonable. On the other hand, Figure 2(b) demonstrates that all three OMNI implementations fail to scale in runs that span two sockets. Finally, Figure 2(c) shows that simple modifications to the source code to make the OMNI benchmarks NUMA-aware (again, see Section VI.A for details), lead to dramatic performance improvements in all three cases. III.
FINDING NUMA PROBLEMS
In the introduction we noted a fortunate side-effect of the trends that are requiring more programmers to be aware of NUMA problems: now users have better access to performance counters that can help identify NUMA problems. Particularly useful in this context are counters that measure the number of memory references that access remote data. Such counters are naturally located in the network interface. When the network interface is off-chip, even if the counters exist, the distance
Normalized Execution Time
1.4
1 Socket
2 Sockets
2 Sockets
1.2 1 0.8 NAS-OMP
0.6
OMNI-OMP
0.4 0.2 0 cg
ft
(a)
mg
cg
ft
(b)
mg
cg
ft
mg
(c)
Figure 2: Comparing NUMA performance of two implementations of benchmarks from the NAS Parallel Benchmark suite. All results are normalized to the single-socket NAS-OMP. While the OMNI implementations compare favorably to the NAS implementation when running within a single socket (a), they do not scale when doubling the cores by including a second socket (b). All three scale significantly better after minor changes to make their initialization routines NUMA-aware (c).
between the processor and the counters significantly hampers correlation between cause and effect. When the interface is onchip, these counters can be accessed the same way as any other counters, simplifying correlation between cause and effect. On Opteron, ‘crossbar event’ counters measure events in the Northbridge. Logic in the Northbridge is responsible for determining whether a memory reference needs to be satisfied remotely and if so by whom. Events that can be measured include: •
•
CPU to DRAM Requests to Target Node – according to AMD documentation [9], this event measures “all DRAM reads and writes generated by cores on the local node to the targeted node in the coherent fabric.” CPU Read Command Requests to Target Node 0-3 – similarly, this event measures the number of read requests by cores on the local node satisfied by a remote node, whether from DRAM or another core’s cache.
Note that a ‘node’ in this context is the equivalent of what we have been referring to as a socket. On the latest Intel platforms, ‘uncore event’ counters measure equivalent events. Given these counters, how do we use them to identify NUMA problems? In the following sections we describe three different methodologies, all based on the same principle: patterns visible in the counter results can be used to determine whether a NUMA problem exists, and if so, the category of the problem. The hallmark of memory hot-spotting, the first category of common NUMA problems identified in the introduction, is low remote counts in one node, and high counts in the remaining nodes. The second category of problems, computationpartition/data-distribution mismatch, is marked by an “unusually” high proportion of remote versus local requests, perhaps on multiple nodes. Since different applications share
data differently, knowing how many remote requests is too many will require some understanding of the application. A. Using Raw Performance Counter Data The simplest approach is to look for patterns in raw performance counter data for a region of code. Figure 3 shows example raw data from the OMNI CG benchmark described in Section II. The data was extracted by bracketing the timestep loop of the benchmark with calls to read the performance counters, subtract the first value from the second value for each counter, and print the result. In this case the events counted are CPU Read Command Requests to Target Node 0-3, i.e., the number of read requests that were satisfied by a different node. As a brief aside, we note that we are not convinced that the AMD documentation for this counter, or several other crossbar counters, is correct. In the run described by Figure 3, we have ensured that Thread 8 (pinned to Core 8) touches every element of the major arrays in the benchmark before any other thread. Since, on Jaguar, Core 8 is located in Node 1, first-touch ensures the data it touches is allocated in Node 1's memory. Therefore, if the counter is really measuring requests to other nodes from the querying core's node, then we would expect high counts for cores in Node 0 and low counts for cores in Node 1. However, Thread 8 and the other threads on Node 1 all have higher counts than threads on Node 0; this strongly suggests that the counter is actually measuring incoming read requests rather than outgoing requests. Furthermore, since only two of four HT links are connected in a Jaguar board, the destination (or origin) of the traffic measured on the other links is unclear Regardless of what the counters actually measure, they do seem to point out a problem, and in this case the pattern is easy to spot: clearly Cores 0-5 (in Node 0) generate substantially different remote traffic than Cores 6-11 (in Node 1). However, the pattern would be more difficult to spot if there were multiple hot-spots located in different nodes, since it would be indistinguishable from the more general problem of too many remote requests. Also, the data provides no indication of the
core0, core1, core2, core3, core4, core5, core6, core7, core8, core9, core10, core11,
cycles, 145342736, 145335243, 145326564, 145304346, 145320951, 145313244, 145307482, 145301001, 145325333, 145297919, 145303690, 145314635,
Rd_Req0, 526, 534, 534, 531, 534, 531, 47735, 47738, 47741, 47740, 47741, 47738,
Rd_Req1, 1005, 1027, 1024, 1021, 1024, 1023, 95158, 95163, 95166, 95167, 95170, 95162,
Rd_Req2, 125935, 126531, 126318, 126072, 126308, 126204, 2864070, 2863532, 2864247, 2863711, 2864203, 2863756,
Rd_Req3 127099 127594 127325 127146 127304 127284 2857152 2856648 2857315 2856854 2857285 2856889
Figure 3: Raw performance counter data for the CPU Read Command Requests To Target Node 0-3 event, captured during a run of CG on a dual socket (six cores per socket) node of Jaguar at ORNL.
source of the problem, beyond that it occurs somewhere between the bracketing performance counter reads. B. Event-Based Sampling Used by several profiling frameworks, including HPCToolkit [10] and AMD’s CodeAnalyst [11], event-based sampling depends on a hardware mechanism that generates interrupts when a performance counter overflows. By saving the program counter of the instructions that repeatedly cause the counter to overflow, one can correlate the event with the source of the event. On AMD processors, we can use this approach to find NUMA problems by sampling a crossbar event that indicates references to remote nodes, and storing both the program counter and the id of cores that cause event overflows. A postpass would look for patterns in the resulting data. For example, high counts for cores from one node, coupled with low counts from cores in another node, at a particular instruction, would indicate a NUMA hot-spot. High counts for all cores across a cluster of instructions would indicate poor data distribution for that region of code.. However, a problem with this approach, as with eventbased sampling in general, is a lack of precision attributable to both hardware and software. Beginning with hardware considerations, out-of-order execution, deep pipelines, and latency between counter overflow and interrupt, all make difficult the precise association of an instruction with an event. Hardware solutions that address this problem are possible, for example Intel’s Precise Event Based Sampling [12] hardware extensions, but are not universally available. Even given the precise instruction that caused a NUMA event, several software considerations complicate the correlation of that instruction with the program variable that is the source of bad NUMA behavior. First, depending on the quality of debugging information output by the compiler, optimizations that reorder instructions can make correlation of instructions with source code difficult; in our experience, one is more likely to find the loop-nest associated with a particular instruction than the line of code. Second, even given a line of source code, if the line contains multiple program variable references, it may be difficult to determine which variable is the source of the problematic reference.
C. Instruction-Based Sampling Instruction-based sampling hardware was introduced with the ProfileMe extensions in the Digital Alpha 21264 microprocessor [13] [14]. Like event-based sampling, instruction-based sampling is interrupt-driven; however, rather than immediately calling a handler on interrupt, hardware instead follows the next instruction through the pipeline, noting what happens to, and because of, that particular instruction, and then calls a handler to pass on the collected information. Recently similar extensions have been added to processors from both AMD – via the Instruction-Based Sampling (IBS) extensions [15] – and, to a more limited extent, Intel – via the Load Latency Performance Monitoring Facility extensions [16]. Both implementations provide the following information for sampled instructions that load data and miss in cache (AMD’s additionally provides the same information for store instructions): •
The precise program counter of the instruction.
•
The virtual address of the data referenced by the instruction.
•
Whether the instruction was serviced by DRAM or another cache, and whether the agent was local or remote.
As with event-based sampling, this information can be used to find NUMA problems in the patterns of the resulting data. While there may still be imprecision in the mapping of instructions to source code (due to imprecise debugging information), the data address can help disambiguate between multiple references. However, there are still precision difficulties when mapping data addresses to variables in the program. Debugging information provided by the compiler can help map static data addresses, known at compile time, but dynamic addresses – local variables created on the stack, or global variables created on the heap – are more challenging. IV.
FIXING NUMA PROBLEMS
As noted in the introduction, programmers today are able to take advantage of many years of experience with NUMA platforms. For example, current operating systems tend to be
NUMA-aware: Linux, Solaris and Microsoft Windows all provide mechanisms to control both thread-to-core and threadto-memory affinity [17]. In the following discussion we describe the specific mechanisms supplied by Linux but analogues are available in other environments. Linux provides several mechanisms to pin threads to cores. From inside a program, Linux provides the sched_setaffinity() system call, which allows the calling thread to specify the core it should run on. To pin threads to cores from outside the program, Linux supplies the numactl utility, which allows users to specify from the command line the cores on which an application should run. Additionally, programming environments may provide their own set tools: for example, Portland Group compilers provide both compile-time and runtime mechanisms for pinning threads to cores. The default memory policy on Linux is first-touch. Under this policy, a page of data is allocated in the memory of the first core to touch a word of the page. (Note that this may be different from the thread that dynamically allocates the data.) Mechanisms similar to those for describing core affinity exist for modifying the memory policy. From inside a program, the libnuma API allows a thread to change the policy for its allocations, and numactl allows control from outside. Alternative policies include: interleaving (alternate allocation of pages in round-robin fashion) and preferred (attempt to allocate on a specified node). Returning to the two categories of NUMA problems noted in the introduction – interconnect congestion due to memory hot-spots; and latency, and potential bandwidth saturation, due to remote memory accesses resulting from computationpartition/data-distribution mismatches – how do we use the tools described above to address them? The primary cause of memory hot-spots is inappropriate initialization of data. A common mistake, under the default first-touch policy, is to initialize data at the beginning of the program before entering a parallel section. The first thread to touch all the data is then the master thread, often Thread 0, and as a result all data is allocated in Node 0’s memory. The solution is to explicitly use the first-touch policy by initializing data in the computation-partition in which it is accessed throughout the rest of the application. One likely cause of computation-partition/data-distribution mismatch is thread migration. Unless threads are explicitly pinned to cores, they are subject to movement by the operating system scheduler. If this is a problem, the solution is to explicitly pin threads to cores. Mismatches may also occur when data that is usually accessed within loops with one computation-partition is touched within a loop with another partition. Such cases may require balancing the cost of the computation with the cost of communication to determine the optimal solution. The best solution is to avoid NUMA problems from the outset: 1) Pin threads to cores. 2) Use the first-touch policy. 3) With the appropriate computational partition, touch at least one element in each page of every array to ensure data is allocated in the correct memory. 4) As far as possible, use the same computational partition throughout the rest of the code.
V.
MEMPHIS: A NUMA TOOLSET
This section introduces Memphis, a toolset that uses AMD IBS performance counter extensions, described in Section III.C, to provide the data-centric information required to pinpoint NUMA problems at their source. While other samplingbased tools – for example, HPCToolkit and CodeAnalyst – are instruction-centric, in that they associate collected information with the sampled instruction, the signature feature of Memphis is its use of IBS-supplied virtual data addresses to associate collected information with program variables. The key insight behind the data-centric approach is that the source of a NUMA problem is quite possibly not where it is evidenced; for example, the cause of a memory hot-spot is not the use of a variable, but rather its initialization. When looking for NUMA problems, a programmer really wants to know first what variable is causing trouble, and second the possibly multiple places where the variable is causing trouble. To provide this information, the data-centric approach aggregates the contributions of multiple instructions that access the location – or locations in the case of arrays – associated with a single variable. The toolset consists of three parts: a kernel module, which provides the interface to the IBS counters; a library, which provides an API through which user-level software interacts with the kernel module; and a post-processing executable that interprets the raw data collected and output by the library. The IBS aspects of the toolset are built on top of an existing inhouse tool that provided access to CPU performance counters. The original tool consisted of a minimal Linux kernel module and a library with an API that allowed users to bracket interesting sections of code with calls to save counter state and print the bracketed region’s contributions to each counter. The following describes how we integrated IBS into that interface. A. MEMPHISMOD Kernel Module Originally intended to provide the minimal required kernel interface to AMD’s Opteron (non-IBS) hardware performance counters, this module consisted of a few ioctl system calls associated with a Linux device file (/dev/memphismod). To this interface we have added several additional ioctls that facilitate turning on and off IBS hardware and accessing collected sample data. We borrowed much of the code to control the hardware from AMD's open-source extensions to the Oprofile [18] kernel module supplied with CodeAnalyst. Upon insertion, the module’s initialization-hook allocates space for IBS sample data (the size of the sample buffer is configurable, determined by the value of an environment variable) and sets up the IBS interrupt controller, initializing the device and setting the interrupt handler. On interrupt, the handler checks the current sample to determine whether it represents a visit to the Northbridge and whether the data came from memory, either local or remote. If so, it saves the sample, provided there is room for the sample in the stored-samples array. Finally, when the module is removed, the module’s removal-hook disables the IBS interrupt controller. B. libMemphis Library Again, the library was originally intended as a minimal interface to AMD’s hardware performance counters, consisting
[IP] [IP] [IP] [IP] [IP] [IP] [IP] [IP] [IP]
0x404555 0x404548 0x404589 0x404538 0x404589 0x404548 0x404538 0x404589 0x404daf
[1] [1] [1] [1] [1] [1] [1] [1] [1]
0x00000000 0x00000000 0x00000000 0x00000000 0x00000000 0x00000000 0x00000000 0x00000000 0x00000000
0x03390002 0x00750060 0x04650004 0x047e0004 0x03580004 0x003f0037 0x057a0004 0x050c0004 0x001f0003
[2] [2] [2] [2] [2] [2] [2] [2] [2]
0x00000000 0x00000000 0x00000000 0x00000000 0x00000000 0x00000000 0x00000000 0x00000000 0x00000000
0x00000013 0x00000013 0x00000013 0x00000013 0x00000013 0x00000013 0x00000013 0x00000013 0x00000003
[3] [3] [3] [3] [3] [3] [3] [3] [3]
0x0000031b 0x00000cd8 0x00000006 0x00000475 0x00000310 0x00000b92 0x00000571 0x00000503 0x00000000
0x00060081 0x00060081 0x00060081 0x00070081 0x0007008d 0x00060081 0x00070081 0x00070081 0x00060002
[VA] [VA] [VA] [VA] [VA] [VA] [VA] [VA] [VA]
0x1a9d048 0x37cb150 0x1a9fec8 0x1b6c6c4 0x1aef000 0x38700f0 0x1b64e84 0x1b3e040 0x4183840
Figure 4: Example raw IBS data output by memphis_print().
Node0: total 3 (1) colidx 3 ./cg.c:556 3
Node1: total 232 (1) colidx 139 ./cg.c:556 135 ./cg.c:709 4 (2) a 93 ./cg.c:556 90 ./cg.c:709 3
Figure 5: Example of Memphis data-centric output (somewhat simplified) for samples collected during a run of the CG benchmark before fixing NUMA problems. Note the aggregation of remote references to colidx[] and a[] across multiple instructions.
of four calls to set-up counters, read counters, print collected data, and cleanup. We have kept the same interface, adding the following semantics for IBS counters. The memphis_mark() call, which originally simply read the performance counter registers (from user-level) and saved the data, now additionally calls an ioctl to turn on IBS sampling and reset the sample count. The memphis_print() call originally read the performance counters, subtracted from these counts the counts saved from the last memphis_mark(), and printed the results to per-core files. When IBS is enabled, it additionally calls ioctls to stop IBS sampling and gather collected sample data, and then prints out the raw data to percore sample files (Figure 4). C. Memphis Post-processing Executable The Memphis executable interprets IBS samples after the run has completed by filtering the data and collecting the percore results into per-node results. It uses debugging information from the compiler (with aid from libdwarf) to map instruction addresses provided by IBS to source file and line number pairs, and to map virtual data addresses provided by IBS to variable names. It determines whether the data for the request associated with this sample came from a local or remote agent based on the value of a bit in the IBS sample data. Figure 5 demonstrates the data-centric output of Memphis. For each node, it prints in descending order the variables that caused remote references, along with the number of samples associated with the variable. For each variable it also prints out all the : pairs associated with the variable along with the number of occurrences, again in descending order.
D. Usage Users instrument portions of code they suspect might have NUMA problems by bracketing the regions with calls to memphis_mark() and memphis_print(). A typical starting point is to find the time-step loop of a scientific code and add memphis_mark() at the loop entry point and memphis_print() just before the loop-back point. After compiling and linking the code with libMemphis, and before running the resulting executable, users create the /dev/memphismod device file and insert the MEMPHISMOD kernel module. Both actions require super-user privilege level on most Linux systems. VI.
EVALUATION
This section demonstrates the effectiveness of the tool at finding the source of NUMA performance problems. We first use the NAS Parallel Benchmarks to demonstrate that Memphis locates those references, and only those references, known to cause performance degradation due to NUMA. We then describe our experiences using the toolset to find common NUMA problems, as well as several unusual ones, in three production-level scientific codes, HYCOM, XGC and CAM. A. NAS Parallel Benchmarks Figure 6 presents remote DRAM access counts reported by Memphis for CG, before and after a transformation to fix NUMA problems. In the left half of Figure 6, Node 1 makes significantly more remote DRAM references to the colidx and a arrays than Node 0, indicating a likely performance problem due to hot-spotting. Inspection of the code reveals that the initialization of both arrays is performed by only the master thread. The right half of Figure 6 shows the results of fixing the initialization by ensuring that arrays are first-touch’ed in the same computation-partitioning used throughout the rest of the program: the total number of remote references has been substantially reduced, as has the imbalance between Node 0 and Node 1. The performance impact is the 37% improvement demonstrated by Figure 2(c) in Section II. Figure 7 presents similar results for FT and MG. In MG, the primary data structure, a multi-dimensional grid, is dynamically allocated using malloc at the beginning of the program; thus problematic references are indicated by in the figure. Again, both ‘before’ results show Node 1 generating significantly more remote references, indicating potential hot-spotting due to NUMA-unaware initialization. The ‘after’ results show that fixing the initialization substantially improves the balance in the number of remote references. Figure 2(c) shows the performance impact, a
Remote DRAM Accesses
300 250 200 150
total
100
colidx
50
a
0
p Node0
Node1
Node0
Node1
Before/After
1400 1200 1000 800 600 400 200 0
total u0 u1 ex N0
N1
N0
N1
Before/After
Remote DRAM Accesses
Remote DRAM Accesses
Figure 6: Remote DRAM counts (total, and per-array) for CG, as reported by Memphis, before and after fixing several NUMA-unaware initializations that left most data pages located in Node0’s memory. 300 250 200 150 total
100
50 0 N0
N1
N0
N1
Before/After
Figure 7: Remote DRAM counts for FT (left) and MG (right), before and after fixing NUMA problems.
substantial 48% for MG. The impact is smaller for FT, 13%, likely because the remote counts remain high in both nodes. B. HYCOM HYCOM [19] is a production ocean modeling application consisting of more than 60,000 lines of Fortran code, spread across more than 50 source files. For these experiments we used the GLBA0.72 data set [20]. The application uses hundreds of data arrays distributed in over 30 common blocks, in addition to some hundred arrays parameterized within several modules; as noted earlier, debugging information for arrays within common blocks and modules is limited to the enclosing block or module. Further, we compiled with full optimization (using the -fastsse flag in the Portland Group pgf90 compiler), limiting the accuracy of source-line information. Moreover, HYCOM is already NUMA-aware; all the major arrays are explicitly initialized in the same computation partition in which they are used throughout the rest of the code. Despite these obstacles, Memphis pointed out several sites with fixable NUMA problems. The tool output, summarized in Figure 8(a), indicates several common blocks with remote reference imbalances. The two most expensive in terms of
remote references, hycom1r and hycom2r, exhibit a reversal of the pattern we have come to associate with hot-spotting: Node 0 generates many more remote references to arrays in these blocks than Node 1. The next three, in order of cost, hycom3r, momtumr4 and frcing, show the more usual pattern where Node 1 sees a significantly higher proportion of remote accesses. Hycom1r and hycom2r consist of the most frequently accessed arrays in the code. In both cases Memphis points to loop nests in xctilr(), the function responsible for communication of the ‘halo’ – a six element ring of remote data – that the code maintains around local arrays. The code is outside the scope of any OpenMP directive, so it is executed by only the master thread. Remote references are therefore the result of the master thread, pinned in Node 0, reading and writing data that is otherwise read and written only by threads in Node 1. We fix the problem by explicitly parallelizing xctilr(), ensuring that participating threads access data in a manner consistent with computation partitions used in the rest of the application. Figure 8(a) demonstrates that this strategy succeeds in substantially reducing the number of Node 0’s remote references to arrays in both common blocks.
1.2
500 400 total
300
hycom[12]r
200
hycom3r 100
momtumr4/frcing
Normalized Execution Time
Remote DRAM Accesses
600
1 0.8 0.6 0.4 0.2 0
0 Node0 Node1
Node0 Node1
Before/After (a)
(b)
Figure 8: (a) Remote DRAM counts for HYCOM before and after fixing NUMA problems. (b) Performance impact of fixes.
As noted earlier, the remote accesses due to hycom3r, momtumr and frcing exhibit the more typical pattern in which Node 1 sees a significantly higher proportion of remote accesses, indicating a likely initialization problem. Inspection reveals that these arrays escaped the standard initialization policy used in the rest of the application. In many cases the arrays were initialized by the master thread upon reading data from a file. We fixed these problems by explicitly initializing the arrays in their normal distribution before their first use. Again, Figure 8(a) demonstrates that these initializations substantially reduce Node 1’s remote references to arrays in all three common blocks. Figure 8(b) demonstrates the performance impact of the fixes described above, separately, and as a group. Several ‘fixes’ only actually improve performance when threads are pinned to cores using the MP_BIND environment variable recognized by the Portland Group compiler’s OpenMP runtime. However, because of an odd interaction between the OpenMP runtime and Jaguar’s CNL operating system, using the flag degrades performance for the base case, HYCOM with no NUMA fixes. Therefore the figure normalizes performance results to the performance of that version of HYCOM with the flag turned off. While the initialization fixes to both frcing and momtumr4 result in only slightly improved performance, the fix to hycom3r improves performance substantially over the base case when threads are pinned using MP_BIND. However, the improvement is limited to only a few percent over the base case with the flag turned off. Clearly the important fix is the parallelization of xctilr(), which contributes most of the 13% performance improvement obtained by the group as a whole. C. XGC1 XGC1 [21] is a production Fortran90 particle-in-cell code that models several aspects of plasmas in a tokamak thermonuclear fusion reactor. XGC1 scales well on large parallel platforms like Jaguar and is thus typically run with large data sets. However, because installation of the MEMPHISMOD kernel module requires more privileges than we
have on Jaguar, we were forced to perform our analysis runs on a small-scale platform using a modified input set known to have different performance characteristics than the full input. Most results we present use the small input, but we close the section with data from a full-scale run. While Memphis found several sites with common NUMA problems, these were overwhelmed by a rather more unusual problem it pointed out in the original XGC1 code. Figure 9 shows the time to compute five iterations of the XGC1 timestep loop, taken from single-socket and dual-socket multithreaded runs on a single node of Jaguar. Perhaps surprisingly, we obtained the performance difference between base and fix0 by simply expanding a few assignment statements that used Fortran90 array syntax into the equivalent do-loops. We divide the assignment statements that required modification into two categories based on how Memphis reported their problems. Memphis directed us to the first set by pointing out a large number of remote DRAM accesses to a lock variable. Inspection of compiler-generated assembly code for these statements revealed that the compiler had dynamically allocated a temporary array for the copy. The allocation (and deallocation) calls were protected internally by locks, significantly increasing the cost of the operations as the number of threads increased, exacerbated by NUMA effects. Memphis directed us to the second group of assignment statements that required expansion by reporting a large number of cache-to-cache transfers of local (stack) addresses. In these cases, the compiler did not dynamically allocate a temporary array but instead used temporary local variables. The result was a significant amount of true sharing (likely of a lock) between threads. The problem with both sets of array statements appears to stem from the manner in which a loop containing the statements had been parallelized. Because the parallelization was explicitly managed by the programmer, as opposed to through the use of an OpenMP parallel do directive, the compiler was unable to determine conclusively that the portion
improvements could ultimately tip the balance toward the dualsocket configuration.
25.00
Seconds
20.00 15.00
base fix0
10.00
fix1 5.00 0.00 6
12
Figure 9: XGC1 single-socket and dual-socket performance using an input set modified to allow single node runs. The number of particles per thread is constant (weak scaling); ideally, the time to solution should be constant.
of the destination array written by each thread was disjoint from that written by other threads, and therefore resorted to the use of temporary arrays to ensure atomicity.
D. CAM The Community Atmosphere Model (CAM) [22] is the atmosphere component of the Community Climate Model (CCM) production global climate modeling code. Like HYCOM, the CAM code base is large: version 3.1 of CAM consists of some 200,000 lines of Fortran90 code, contained in nearly 500 files. As with XGC1, the effects of several common NUMA problems that Memphis pointed out in the original CAM code are overwhelmed by those of a more unusual performance anomaly the tool helped us find. Figure 10 presents results from runs of CAM on a single node of Jaguar. The data is taken from timing files produced during runs of the CAM executable. Full step is the total time in the time-step loop (10 steps); dynamics is the portion of time, for all time-steps, spent in the application’s dynamics package; physics is the portion spent in the physics package; and coupler is the portion spent in the coupler, which translates data between the two packages.
The additional 12% performance difference between fix0 and fix1 is the result of a more garden-variety NUMA improvement: replicating several fields of a heavily used search table substantially reduces remote memory traffic compared to when the table is located in only one memory or evenly distributed between both memories.
As Figure 10(a) indicates, the most significant performance problem was in the dynamics package, addressed by fix0. Fix0 simply replaces a few large arrays, locally allocated in a single function, with dynamically allocated, per-thread equivalents. Memphis did not directly lead us to this problem – in part because it is significantly more pronounced on Jaguar than on our analysis system – but it did help us locate the arrays that were causing trouble when we noticed the discrepancy in dynamics performance between the two systems
The fix0 modifications have been introduced into the XGC1 development tree and have directly resulted in a performance improvement of 23% for multi-threaded-across-dual-socket runs on up to 196,000 cores of Jaguar (Patrick Worley, personal communication). This improvement makes dualsocket performance competitive with the current bestperforming configuration, message-passing between multithreaded-single-sockets. Adoption of fix1 and further NUMA
Local data is by definition private to a thread, and can thus reasonably be assumed not to be subject to NUMA problems. However, as evidence that the problem is indeed NUMArelated, Figure 10(b) compares single-socket dynamics performance with dual-socket performance. While fix0 does improve dynamics performance somewhat (13%) for 6 threads, the improvement is substantially greater when 12 threads span both sockets (38%). 8
16
7
14
6
Seconds
12
base
10
fix0
8
fix5
6
fixall
4
Seconds
18
5 4
base
3
fix0
2 1
2
0
0 full step dynamics physics
(a)
coupler
6
12
(b)
Figure 10: (a) Contributions of NUMA fixes to performance improvements in different phases of CAM. (b) Single-socket vs. dual-socket performance of dynamics phase. The input data size is held constant (strong scaling); ideally, the time to solution decreases in proportion with the number of threads.
Performance counters reveal that, on Jaguar, base spends nearly 45% of its cycles in the kernel; fix0 exhibits significantly fewer kernel cycles, indicating that the local arrays in base cause substantial kernel activity. Memphis provides further clues as to why. First, the addresses of the local arrays that cause the problem in base are not stack addresses; rather, they are located in a region of the address space associated with memory-mapped data. Second, the principal difference between the data samples collected from a run of base and those from a run of fix0, is a large reduction in samples from several kernel calls involved in virtual memory allocation (specifically, clear_page_c() and get_page_from_freelist()). Based on these observations, we speculate that the PGI compiler memory-maps data for the local arrays upon function entry, rather than allocating them on the stack, and frees them upon function exit. As a consequence, the pages used by the local arrays require a fresh first-touch each time the function is called. Since the function is called many times, the result is a great deal of contended kernel activity. Finally, fix5 addresses a more common NUMA hot-spotting problem, parallelizing two initialization loops that had been performed by only the master thread. The fix has a substantial impact on performance of the coupler, and improves the overall performance of a time-step by 5%. The remaining fixes slightly impact performance of the dynamics and physics packages. When all fixes are applied, the performance improvement is 24% over 100 time-steps.
[2]
[3]
[4] [5] [6]
[7] [8]
[9] [10]
[11]
[12] [13]
VII. CONCLUSION Given that NUMA is a significant problem that will only grow in importance, this paper has made several contributions. First, we demonstrated that NUMA can indeed cause significant performance degradation in scientific applications, showing that it can mean the difference between an application scaling perfectly across multiple sockets and failing to scale at all. Second, we identified three methods of using newly available hardware performance counters to aid in finding NUMA-related problems. Third, we described methods of addressing problems caused by NUMA in different programming environments. Finally, we introduced Memphis, a data-centric toolset that uses Instruction Based Sampling to help pinpoint problematic memory accesses, and described how we used it to locate NUMA problems in HYCOM, XGC1 and CAM that when fixed, yielded performance improvements of 13%, 23% and 24% respectively. As NUMA becomes more pervasive, we are certain Memphis, and tools like it, will become essential to achieving application performance. ACKNOWLEDGMENT We would like to thank our colleagues Patrick Worley and Gabriel Marin for many helpful discussions and insights. REFERENCES [1]
S. Saini, et al., "Scientific application-based performance comparison of SGI Altix 4700, IBM POWER5+, and SGI ICE 8200 supercomputers,"
[14] [15]
[16]
[17] [18] [19]
[20]
[21]
[22]
presented at the Proceedings of the 2008 ACM/IEEE conference on Supercomputing, Austin, Texas, 2008. C. N. Keltcher, K. J. McGrath, A. Ahmed, and P. Conway, "The AMD Opteron Processor for Multiprocessor Servers," IEEE Micro, vol. 23, pp. 66-76, 2003. B. Sinharoy, R. N. Kalla, J. M. Tendler, R. J. Eickemeyer, and J. B. Joyner, "POWER5 System microarchitecture," IBM J. Res. Dev., vol. 49, pp. 505-521, 2005. J. Casazza, "First the Tick, Now the Tock: Intel Microarchitecture (Nehalem)," Intel Corporation, 2009. H. Q. Le, et al., "IBM POWER6 microarchitecture," IBM J. Res. Dev., vol. 51, pp. 639-662, 2007. D. H. Bailey, et al., "The NAS parallel benchmarks - summary and preliminary results," presented at the Proceedings of the 1991 ACM/IEEE conference on Supercomputing, Albuquerque, NM, 1991. NASA. (2009, Dec.). NAS PARALLEL BENCHMARKS. Available: http://www.nas.nasa.gov/Resources/Software/npb.html Omni-Compiler-Project. (2009, Dec.). OpenMP version of the NAS Parallel Benchmarks. Available: http://www.hpcs.cs.tsukuba.ac.jp/omniopenmp/download/download-benchmarks.html "BIOS and Kernel Developer’s Guide (BKDG) For AMD Family 10h Processors," Advanced Micro Devices, Inc, .2009. L. Adhianto, et al., "HPCToolkit: Tools for performance analysis of optimized parallel programs," Concurrency and Computation: Practice and Experience, 2010. P. J. Drongowski, "An introduction to analysis and optimization with AMD CodeAnalyst Performance Analyzer," Advanced Micro Devices, Inc., 2008. B. Sprunt, "Pentium 4 Performance-Monitoring Features," IEEE Micro, vol. 22, pp. 72-82, 2002. J. Dean, J. E. Hicks, C. A. Waldspurger, W. E. Weihl, and G. Chrysos, "ProfileMe: hardware support for instruction-level profiling on out-oforder processors," presented at the Proceedings of the 30th annual ACM/IEEE international symposium on Microarchitecture, Research Triangle Park, North Carolina, 1997. J. M. Anderson, et al., "Continuous profiling: where have all the cycles gone?," ACM Trans. Comput. Syst., vol. 15, pp. 357-390, 1997. P. J. Drongowski, "Instruction-Based Sampling: A New Performance Analysis Technique for AMD Family 10h Processors," Advanced Micro Devices, Inc., 2007. "Intel 64 and IA-32 Architectures Software Developer’s Manual, Volume 3B: System Programming Guide, Part 2," Intel Corporation, 2009. "Software Optimization Guide for AMD Family 10h Processors," Advanced Micro Devices, Inc., 2009. J. Levon. (2009, Dec.). OProfile manual. Available: http://oprofile.sourceforge.net/doc/index.html R. Bleck, "An oceanic general circulation model framed in hybrid isopycnic-Cartesian coordinates," Ocean Modeling, vol. 4, pp. 55-88, 2002. A. Wallcraft, et al., "Global Ocean Prediction Using HYCOM," presented at the HPCMP-UGC '07: Proceedings of the 2007 DoD High Performance Computing Modernization Program Users Group Conference, 2007. M. F. Adams, et al., "Scaling to 150K cores: recent algorithm and performance engineering developments enabling XGC1 to run at scale," Journal of Physics: Conference Series, vol. 180, 2009. W. D. Collins, et al., "The Formulation and Atmospheric Simulation of the Community Atmosphere Model Version 3 (CAM3)," Journal of Climate, vol. 19, 2006


![Application for Special Beer Permit - Memphis - City of Memphis [PDF]](https://m.moam.info/img/260x300/application-for-special-beer-permit-memphis-city-o_647d65e0098a9eee648b45d7.jpg)

