Quality Based Design and Design for Reliability of Micro Electro Mechanical Systems (MEMS) Using Probabilistic Methods Stefan Reh*, Paul Lethbridge** and Dale Ostergaard*** ANSYS, Inc. Southpointe, 275 Technology Dr., Canonsburg, PA 15317, USA *
[email protected], **
[email protected], ***
[email protected] ABSTRACT
2
THE ANALYSIS MODEL
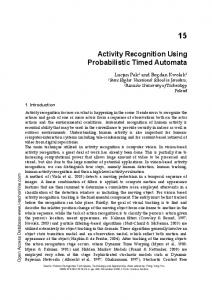
The paper demonstrates the use of probabilistic methods to assess the electromechanical behavior of micro electromechanical systems (MEMS) under the presence of micromachining manufacturing and process uncertainties. Probabilistic Methods are used to assess uncertainties involved in the manufacturing of MEMS devices. Probabilistic methods guide the design of these devices to achieve a robust and reliable design in a most efficient way. The methods illustrated here are implemented in the latest version of the ANSYS Finite-Element program. Keywords: Micro Electromechanical Systems (MEMS), Finite-Element Analysis, Manufacturing Tolerances, Probabilistic Analysis Figure 1: Micro electromechanical linear resonator
1
INTRODUCTION
The manufacturing of structural components is generally associated with manufacturing imperfections. In general, the geometry of a component cannot be reproduced only within certain finite tolerances. To strive for ultimate precision is neither physically possible nor financially acceptable. Also the material properties of a component are inherently subjected to scatter as can be easily observed in typical measurements of material properties. The same holds true for the boundary conditions, such as environmental conditions and loads. Technical products are generally designed such that one or more response parameters fulfil certain criteria. Such response parameters can be the capacitance, the electrostatic forces and so on. If the influencing variables are uncertain a direct consequence is that the response parameters are uncertain as well. Then, probabilistic methods can be used to answer the following questions: 1. How large is the scatter of the parameters describing the behavior of the component? 2. What is the probability that by chance a performance criteria of the device is no longer met leading either to a certain scrap rate or the failure of the component to function as expected? 3. What are the parameters on the input side that need to be addressed in order to achieve a robust and reliable design and minimize the failure probability and the scrap rate? The answer to this question automatically leads to measures that can be implemented as part of the quality control in the manufacturing process.
2.1
Geometry
The model is based on a surface micromachined Polysilicon lateral resonator consisting of two comb drives and a folded spring mass assembly, as shown in Figure 1. See [1,2] for details on the design and application of such a device. static comb tooth 1
moving comb stroke S
25V
tooth 2 ground plane
Figure 2: Illustration of the tooth model Each electrostatic comb drive has 10 static and 9 moving teeth on each side. The moving teeth are connected directly to the spring mass assembly. The model used for the electrostatic analysis considers just one tooth of the moving comb and the two neighboring static comb teeth, plus the underlying ground plane electrode as illustrated in Figure 2. The tooth model is shown with the moving comb at the maximum stroke position. Due to their negligible effect on the electrostatic field the anchor and step dimples are not included in the model.
2.2
Finite-Element Model
For the probabilistic analysis of the tooth model the effects of the manufacturing tolerances on the capacitance and on the electrostatic force has been investigated. In order to calculate these output parameters, a full electrostatic finite element analysis (FEA) using the ANSYS FiniteElement program is performed. Also the electrostatic force on the moving comb tooth is calculated. The FEA model is constructed by extruding a large "air" volume around a tooth model and then subtracting the tooth model from the air volume using Boolean operation. The resultant volume of air is the electrostatic "domain" which is meshed.
finite-differencing scheme has been applied that requires two executions of the finite element model. Hence, the electrostatic force F is given by equation 2.
C = 2⋅ F=
W V2
W ( S + ∆S ) − W ( S ) ∆S
(1)
(2)
Figure 4: Equipotential contours of voltage
3 Figure 3: FE mesh – only “air domain” shown As illustrated in figure 2 the potential difference of 25V is applied across the ground plane and the static comb. The far field behavior of the electrostatic field is modeled by “infinite” elements at the exterior of the “air domain”. A pre-study with varying “air domain” size was conducted to ensure that the “air domain” is sufficiently large to capture the stored energy required for a capacitance calculation. The side walls of the "air domain” are defined by the centerlines of the two static comb teeth and they have symmetric (Neumann) boundary conditions applied. The sections of spring & mass at ground potential are not included. Their contribution to the capacitance calculation is negligible since they are shielded from the active comb by the spine of the moving combs and the ground plane. The resultant meshed model typically has about 12,000 elements and 18,000 nodes, as shown in figure 3. These numbers vary slightly with the PDS geometric tolerances applied. The domain interior is meshed with 10 node tetrahedron elements. Equipotential contours of the voltage are shown in figure 4. The resulting capacitance C is extracted during the post-processing of the FEA results using equation 1. Here, W is the electrostatic energy and V the potential difference between the static and moving combs. W can be extracted from the FE results and V is given as 25V. The electrostatic force is equal to the derivative of the electrostatic energy with respect to the stroke S. Since the energy is a very smooth and almost linear function of the stroke a forward
THE PROBABILISTIC MODEL
The objective of the study was to show how FEA and probabilistic design can be used to simulate the effects of manufacturing tolerances on the behavior of the device. Uncertainties are either random variables (constant in time and space), random fields (constant in time, but random function of spatial coordinates), random processes (constant in space, but random functions of time) or combinations of these. This paper focuses on random variables only. Random variables usually are described in terms of statistical distribution functions. There is very little data available concerning micromachining manufacturing tolerances. MEMS designers usually infer tolerances based upon resultant functionality compared to designed functionality, i.e. shifts in designed resonant frequency. The objective of this work is to show the application of FEA & PDS, and not to present new data on manufacturing tolerances. The fabrication process assumptions are as follows: • The largest geometric tolerances occur in the plane of the wafer (x-y plane). Geometric tolerances have contributions from both mask to wafer alignment in the x-y plane, and mask to wafer separation. The mask to wafer (tool z-axis) separation accuracy produces a scaling effect (slightly out of focus). If the mask is closer to the wafer then the device gets slightly larger (x-y plane) and vice versa. • The smallest geometric tolerances occur normal to the plane of the wafer, since the deposition rate of material can be more precisely controlled. Due to lack of data a normal distribution was assumed here for all input variables. All tolerances are defined as a
delta or deviation on the nominal geometry, i.e. the mean value of all random input variables is 0.0. All dimensions in the plane of the wafer (x-y) have a standard deviation of 0.125µm. These parameters are named with an ending DL, DW, DX and DY (see table 1). All dimensions normal to the plane of the wafer have a standard deviation of 0.01µm. They have names ending with DZ and DT (see table 1). This makes a total of 14 random input variables. Description Moving comb tooth delta length Moving comb tooth delta width Moving comb spine delta width Moving comb tooth delta y-position Static comb tooth 1 delta length Static comb tooth 1 delta width Static comb tooth 1 delta y-position Static comb tooth 2 delta length Static comb tooth 2 delta width Static comb tooth 2 delta y-position Static comb spine delta width Ground plane delta length Polysilicon delta thickness Polysilicon above nitride delta heigh
St.dev. 0.125 0.125 0.125 0.125 0.125 0.125 0.125 0.125 0.125 0.125 0.125 0.125 0.01 0.01
0.2 0.15 0.1 0.05 0 1.07e-3
PROBABILISTIC RESULTS
The intention of the probabilistic analysis is to demonstrate the use of probabilistic methods to guide the design process of MEMS device to achieve a more reliable and robust design. For the probabilistic analysis 270 Latin Hypercube samples have been run at a single stroke of 6µm. The resulting statistics of the output parameters, the capacitance and the electrostatic force, are given in table 2. As an answer to question number 1 listed in the introduction, the histograms of the output parameters shown in figure 5 and 6 illustrate the scatter induced in the output parameters due to the scatter of the input variables. The relative frequency shown in the histograms is equal to the number samples within a certain interval divided by the total number of samples (270 in this case).
1.10e-3 1.13e-3 Capacitance C
1.15e-3
Figure 5: Histogram of the capacitance
Rel. Frequency
0.2 0.15 0.1 0.05 0 0.014
0.015 0.016 Force F
0.017
Figure 6: Histogram of the electrostatic force 100% Probability
4
Force 1.5792e-2 6.6248e-4 1.4062e-2 1.7902e-2
Technical products are typically designed to fulfil certain design criteria based on the output parameters. E.g. a design criterion is that the electrostatic force shall be above or below a certain limit. To answer question number 2 from the introduction (What is the probability that a design criterion is no longer met?) a probabilistic design tool can provide so-called cumulative distribution curves.
Table 1: Uncertain input variables in the tooth model There are various probabilistic methods available in literature. This paper is focused on the Monte Carlo Simulation method. Due to its advantageous properties the so-called Latin Hypercube Sampling techniques has been used. Details about this method are given in [3]. Among others this technique has been implemented in the ANSYS probabilistic design system (ANSYS/PDS). The ANSYS/PDS is part of the latest Release 5.6 of the ANSYS Finite-Element program as a Beta feature. It allows for the definition of uncertainties based on various statistical distribution functions such as the normal, log-normal, uniform, Beta distribution and so on. It also allows to model random effects as random fields, which is not covered here.
Capacitance 1.1145e-3 1.6581e-5 1.0654e-3 1.1790e-3
Table 2: Statistics of the output parameters
Rel. Frequency
Name MCTHDL MCTHDW MCSPDW MCTHDY SCTH1DL SCTH1DW SCTH1DY SCTH2DL SCTH2DW SCTH2DY SCSPDW GPDX POLY_DT Z_GAPDZ
Statistics Mean value Standard deviation Sample minimum Sample maximum
80% 60%
P
40% 20% 0% 0.014
F-limit 0.015
0.016 Force F
0.017
0.018
Figure 7: Probability curve of the electrostatic force The cumulative distribution curve for the electrostatic force is shown in figure 7. The thick line in the middle is the probability P that the force remains lower than a certain limit value F-limit. The complement 1.0-P is the probability
0.3 0.25 0.2 0.15 0.1 0.05 0
If in the example here, the input parameter MCTHDW should be modified then still the question remains how this should be done. To answer this question so-called scatter plots are useful. Figure 8 illustrates a scatter plot of the electrostatic force as a function of the change of the moving comb tooth width MCTHDW. The trendline describes the amount of scatter in the force due to the scatter of MCTHDW. The deviations from the trendline are due the scatter in the other input variables. The trendline can be used to estimate to which extent the scatter of the force could be reduced if the scatter of MCTHDW is reduced. 0.018 0.017
Force F
that the force F exceeds this limit. A good tooth design is where the force F remains within a small range. Hence, the reliability of the device is given by the probability that the force F falls within that range. The thinner upper and lower curves in figure 7 are the confidence bounds using a 95% confidence level. The confidence bounds quantify the accuracy of the probability results. After the reliability of the device has been quantified it may happen that the resulting value is not sufficient. Then question number 3 from the introduction must be answered, that is: Which input variables should be addressed to achieve a reliable design and improve the quality? The answer to that question can be derived from probabilistic sensitivity diagrams and scatter plots. For Monte Carlo simulation results sensitivities can be derived by calculating the Pearson or the Rank-order correlation coefficients between the input variables and the output parameter (see [4] for details). It is useful to first sort the input parameters into two groups, namely those having a significant influence on the output parameter and those being insignificant. As explained in [5] this can be done using a statistical significance test on the correlation coefficients.
0.016 0.015 0.014 -0.4 -0.2 0 0.2 0.4 Moving comb tooth delta width MCTHDW
Figure 8: Electrostatic force F as a function of MCTHDW MCTHDW MCSPDW MCTHDL
Figure 8: Sensitivities of the electrostatic force F Figure 8 shows the sensitivities of only the significant input variables for the electrostatic force. The sensitivities are given as absolute values (bar chart) and relative to each other (pie chart). There are two important conclusions that can be derived from sensitivity diagrams. First, if the design is not sufficient, e.g. not reliable enough, it is the most important input variables that must be modified or controlled by quality assurance measures during manufacturing. It doesn’t make sense to focus on input variables having only a minor importance or no significance at all. Here, the force is sensitive only to 3 input variables. This is a reduction of the complexity of the problem from 14 input variables down to only 3. This reduction of the problem complexity ensures that necessary design changes are identified in the most efficient way. Secondly, if the design is satisfactory there is usually the need to reduce the manufacturing costs without sacrificing reliability. In this case the manufacturing tolerances of the insignificant or the less important input parameters can be relaxed, since they have no impact. For the geometry parts described by those parameters expensive quality assurance measures can be abandoned.
5
CONCLUSIONS
As illustrated in the present paper, probabilistic methods can be used to quantify the reliability of MEMS devices and to achieve a more robust design and improved quality. Probabilistic sensitivities can be used to reduce the complexity of the problem and derive measures for improving the product quality. This provides guidance for necessary design changes in a most efficient way. In addition, probabilistic methods are capable of identify where reductions of the manufacturing costs are possible. This work will be extended to include the spring and mass assembly, where the effect of both geometric tolerance and material property variations are factored in.
REFERENCES [1] W.C. Tang, T.C. Nguyen, R.T. Howe, “Electrostatic-comb drive of lateral polysilicon resonantors”, Sens. Actuators A-Physical, Vol 21., pp. 328331, 1990 [2] L. Lin, R.T. Howe, “Microelectromechanical Filters for Signal Processing”, J. Microelectromechanical Systems, Sept 1998, pp 286-293 [3] A. Florian, "An efficient sampling scheme: Latin Hypercube Sampling”, Probabilistic Engineering Mechanics, 7, 123-130, 1992 [4] A. H-S. Ang and W. H. Tang, “Probabilistic Concepts in Engineering Planning and Design”, Vol. 1, John Wiley & Sons, 1975 [5] W. H. Press et al., “Numerical Recipes in C”, Cambridge University Press, 1993