MemScale: Active Low-Power Modes for Main Memory Qingyuan Deng
David Meisner
Luiz Ramos
Dept. of Computer Science Rutgers University
[email protected]
Advanced Computer Architecture Lab University of Michigan
[email protected]
Dept. of Computer Science Rutgers University
[email protected]
Thomas F. Wenisch
Ricardo Bianchini
Advanced Computer Architecture Lab University of Michigan
[email protected]
Dept. of Computer Science Rutgers University
[email protected]
Abstract Main memory is responsible for a large and increasing fraction of the energy consumed by servers. Prior work has focused on exploiting DRAM low-power states to conserve energy. However, these states require entire DRAM ranks to be idled, which is difficult to achieve even in lightly loaded servers. In this paper, we propose to conserve memory energy while improving its energyproportionality by creating active low-power modes for it. Specifically, we propose MemScale, a scheme wherein we apply dynamic voltage and frequency scaling (DVFS) to the memory controller and dynamic frequency scaling (DFS) to the memory channels and DRAM devices. MemScale is guided by an operating system policy that determines the DVFS/DFS mode of the memory subsystem based on the current need for memory bandwidth, the potential energy savings, and the performance degradation that applications are willing to withstand. Our results demonstrate that MemScale reduces energy consumption significantly compared to modern memory energy management approaches. We conclude that the potential benefits of the MemScale mechanisms and policy more than compensate for their small hardware cost. Categories and Subject Descriptors plementation]: Miscellaneous
C.5 [Computer System Im-
General Terms Design, experimentation, performance Keywords Memory subsystem, energy conservation, dynamic voltage and frequency scaling
1.
∗
Introduction
Over the last several years, it has become clear that the massive energy consumption of datacenters represents a serious burden on their operators and on the environment [12]. Concern over energy ∗ This
research has been partially supported by NSF under grants #CCF0916539, #CSR-0834403, #CCF-0811320, and Google.
Permission to make digital or hard copies of all or part of this work for personal or classroom use is granted without fee provided that copies are not made or distributed for profit or commercial advantage and that copies bear this notice and the full citation on the first page. To copy otherwise, to republish, to post on servers or to redistribute to lists, requires prior specific permission and/or a fee. ASPLOS’11, March 5–11, 2011, Newport Beach, California, USA. c 2011 ACM 978-1-4503-0266-1/11/03. . . $10.00 Copyright
waste has led to numerous academic (e.g., [35, 37, 39]) and industrial efforts to improve the efficiency of datacenter infrastructure. As a result, in state-of-the-art facilities, over 80% of power is now consumed by servers themselves [15]. Historically, within the server, the processor has dominated energy consumption. However, as processors have become more energyefficient and more effective at managing their own power consumption, their contribution has been decreasing. In contrast, main memory energy consumption has been growing [5, 25, 28], as multicore servers are requiring increasing main memory bandwidth and capacity. Making matters worse, memory energy management is challenging in the context of servers with modern (DDR*1 ) DRAM technologies. Today, main memory accounts for up to 40% of server energy [5]—comparable to or slightly higher than the processors’ contribution. In reality, the fraction attributable to memory accesses may be even higher, since these estimates do not consider the memory controller’s energy consumption. The early works on memory energy conservation focused on creating memory idleness through scheduling, batching, and layout transformations, so that idle low-power states could be exploited [10, 13, 20, 24, 27, 36]. Those studies generally assumed the rich, chip-level power management permitted in older technologies, such as RDRAM [8]. More recent works have considered reducing the number of DRAM chips that are accessed at a time (rank subsetting) [1, 44] and even changing the microarchitecture of the DRAM chips themselves to improve energy efficiency [43]. A common theme of these works is to reduce the number of chips or bits actually touched as a result of a memory access, thereby reducing the dynamic memory energy consumption. We argue that none of these approaches is ideal. Creating enough idleness is difficult in modern DDR* memories, since power management is available only at coarse granularity (entire ranks spanning multiple chips). Thus, deep idle low-power states can rarely be used without excessively degrading performance. For this reason, today, even the most aggressive memory controllers use only shallow, fast-exit power-down states to conserve energy while idle. Rank subsetting requires changes to the architecture of the memory DIMMs (Dual In-Line Memory Modules), which are expensive and increase latency. Changing DRAM chip microarchitecture may have negative implications on capacity and yield.
1 DDR*
refers to the family of Double Data Rate memory devices.
In contrast, we propose MemScale, a set of low-power modes, hardware mechanisms, and software policies to conserve energy while respecting the applications’ performance requirements. Specifically, MemScale creates and leverages active low-power modes for the main memory subsystem (formed by the memory devices and the memory controller). Our approach is based on the key observation that server workloads, though often highly sensitive to memory access latency, only rarely demand peak memory bandwidth. To exploit this observation, we propose to apply dynamic voltage and frequency scaling (DVFS) to the memory controller and dynamic frequency scaling (DFS) to the memory channels and DRAM devices. By dynamically varying voltages and frequencies, these mechanisms trade available memory bandwidth to conserve energy when memory activity is low. Although lowering voltage and frequency causes increases in channel transfer time, controller latency, and queueing time at the controller, other components of the memory access latency are essentially not affected. As a result, these overheads have only a minor impact on average latency. Also importantly, MemScale requires only limited hardware changes— none involving the DIMMs or DRAM chips—since most of the required mechanisms are already present in current memory systems. In fact, many servers already allow one of a small number of memory channel frequencies to be statically selected at boot time.
Scale epochs and profiling phases. This analysis demonstrates that the fraction of memory power and the power proportionality have the largest impact on our results. MemScale’s energy savings grow with a decrease in power proportionality or an increase in the memory subsystem’s contribution to overall power, while still maintaining performance within the allowed degradation bound.
To leverage the new memory DVFS/DFS modes, we further propose a management policy for the operating system to select a mode using online profiling and memory power/performance models that we have devised. The models incorporate the current need for memory bandwidth, the potential energy savings, and the performance degradation that applications would be willing to withstand. We assume that the degradation limit is defined by users on a per-application basis.
We provide a brief overview of modern memory subsystems and the impact of dynamic scaling on their performance and power consumption.
MemScale’s low-power modes and performance-aware energy management policy have several advantages. Because the modes are active, there is no need to create or rely on memory idleness. Not relying on idleness improves memory energy-proportionality [6]. In fact, even when the memory is idle, scaling can lower power consumption further. Because MemScale does not require changes to DIMMs or DRAM chips and largely exploits existing hardware mechanisms, it can be implemented in practice at low cost. Because MemScale’s energy-management policy is driven by the operating system (at the end of each time quantum), the memory controller can remain simple and efficient. Finally, MemScale can be combined easily with rank subsetting, since each addresses complementary aspects of energy management (memory controller energy and background energy vs. dynamic energy, respectively). We evaluate MemScale using detailed simulations of a large set of workloads. Our base results demonstrate that we can reduce memory energy consumption between 17% and 71%, for a maximum acceptable performance degradation of 10%. In terms of systemwide energy savings, our approach produces energy savings ranging from 6% to 31%. For comparison, a system that uses aggressive transitions to fast-exit powerdown for energy management conserves only between 0.3% and 7.4% system energy. In contrast, Decoupled DIMMs [45], the closest prior work, conserves between -0.8% and 11% system energy. MemScale can save almost a factor of 3x more system energy on average than Decoupled DIMMs, without exceeding the allowed performance degradation. We also perform an extensive sensitivity analysis to assess the impact of key aspects of our memory system design and management policy: the number of memory channels, the contribution of the memory subsystem to overall power consumption, the power proportionality of the memory controller and DIMMs, the maximum acceptable performance degradation, and the length of Mem-
Based on our experience and results, we conclude that the potential benefits of MemScale are significant and more than compensate for its small hardware and software costs. Summary of contributions. We propose dynamic memory frequency scaling, or “MemScale”, a new approach to enable memory active low-power modes. We further examine varying memory controller voltage and frequency in response to memory demand, an opportunity that has been overlooked by previous energy management studies. This paper describes the few additional hardware mechanisms that are required by dynamic scaling, as well as an operating system policy that leverages the mechanisms. Finally, we present extensive results demonstrating that we can conserve significant energy while limiting performance degradation based on a user-selected performance target.
2.
2.1
Background
Memory System Technology
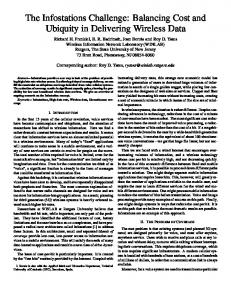
First, we discuss memory organization, timing, and power consumption. Although there have been numerous memory architectures, DRAM technologies and variations, we restrict ourselves to today’s pervasive JEDEC-style DDR* SDRAM (Synchronous DRAM) memory subsystems [23]. A more detailed and complete treatment of memory subsystems can be found in [22]. DRAM organization. Figure 1 illustrates the multiple levels of organization of the memory subsystem. To service memory accesses, the memory controller (MC) sends commands to the DIMMs on behalf of the CPU’s last-level cache across a memory bus. As shown, recent processors have integrated the MC into the same package as the CPU. To enable greater parallelism, the width of the memory bus is split into multiple channels. These channels act independently and can access disjoint regions of the physical address space in parallel. Multiple DIMMs may be connected to the same channel. Each DIMM comprises a printed circuit board with register devices (for buffering address and control signals), a Phase Lock Loop device (for maintaining frequency and phase synchronization), and multiple DRAM chips (for data storage). The DRAM chips are the ultimate destination of the MC commands. The subset of DRAM chips that participate in each access is called a rank. The number of chips in a rank depends on how many bits each chip produces/consumes at a time. For example, the size of the rank is 8 DRAM chips (or 9 chips for DIMMs with ECC) when each chip is x8 (pronounced “by 8”), since memory channels are 64 bits wide (or 72 bits wide with ECC). Each DIMM can have up to 16 chips (or 18 chips with ECC), organized into 1-4 ranks. Each DRAM chip contains multiple banks (typically 8 banks nowadays), each of which contains multiple two-dimensional memory arrays. The basic unit of storage in an array is a simple capacitor representing a bit—the DRAM cell. Thus, in a x8 DRAM chip, each bank has 8 arrays, each of which produces/consumes one bit at a time. However, each time an array is accessed, an entire multi-KB row is transferred to a row buffer. This operation is called an “ac-
DIMMs 16%
Arrays
Multiprogram Average Banks
Worst Program in Mix
PLL
14% Rank 1 12% CPI Increase (%)
Energy Savings (%)
CPU
50% 45% Bus MC 40% Rank 0 128 35% Channel 2 30% 25% 20% 64 15% 10% fMC,VMC fBus 5% 0%
DRAM Chip Memory System Energy
PLL
fDIMM
10% 8%
Bank Mux Registers & I/O DLL
Row Decoder
Channel 1 Full System Energy 64
6%
Sense Amps
4%
Column Mux
2% 0%
DRAM Cell
Figure 1: Organization of a modern memory subsystem. The parameters that our control mechanisms impact are highlighted. The parameters VM C and fM C control the memory controller (MC) voltage and frequency respectively. fBus and fDIM M are the memory bus frequency and DIMM frequency, respectively; the DIMMs’ PLL allows interfacing of these components at different frequencies (i.e., fBus = fDIM M ).
DRAM timing. For the MC to access memory, it needs to issue a number of commands to the DRAM chips. These commands must be properly ordered and obey a number of timing restrictions. For example, a row activation first requires a pre-charge of the data in the row buffer, if the row is currently open. If the row is closed, the activation can proceed without any delay. An example timing restriction is the amount of time between two consecutive column accesses to an open row. In DRAM lingo, a pre-charge, an activation, and a column access are said to take TRP , TRCD , and TCL times, respectively. The latest DDR3 devices perform each of these operations in around 10 memory cycles at 800MHz. At this frequency, transferring a 64byte cache line over the channel takes 4 cycles (TBU RST ), since data is transferred on both edges of the clock in DDR technology. MC and DRAM power. Because an increasing fraction of a server’s power budget is dedicated to the memory subsystem [5, 25, 28], it is important to understand where power is consumed in this subsystem. We categorize the power breakdown into three major categories: DRAM, register/PLL, and MC power. The DRAM power can be further divided into background, activation/precharge, read/write, and termination powers. The background power is independent of activity and is due to the peripheral circuitry, transistor leakage, and refresh operations. The activation/pre-charge power is due to these operations on the memory arrays. The read/write power is due to these column accesses to row buffers. The termination power is due to terminating signals of other ranks on the same channel. The three latter classes of DRAM power are often referred to as “dynamic DRAM power”, but they also include a level of background power. Figure 2 quantifies the average power breakdown for three categories of workloads: memory-intensive (MEM), compute-intensive
100% Power Breakdown ower Breakdown
Energy (Normalized to Base)
DRAM Rest of system tivation” or a “row opening”. Then, PLL/Reg. any column MC of the row can be 1 read/written over0.9the channel in one burst. Because the activation is destructive, the 0.8corresponding row eventually needs to be “precharged”, that is,0.7written back to the array. Under a closed-page 0.6 the MC pre-charges a row after every column management scheme, 0.5 is another pending access for the same row. access, unless there 0.4 Prior studies suggest 0.3 that closed-page management typically works better than open-page management for multi-core systems [40]. 0.2 The DIMM-level0.1Phase-Lock Loop (PLL) and chip-level DelayLock Loop (DLL)0devices are responsible for synchronizing signal frequency and phase across components.
80% 60% 40% 20% 0% AVG_MEM Background Act/Pre
AVG_MID W/R TERM
AVG_ILP PLL/REG MC
Figure 2: Conventional memory subsystem power breakdown. There is substantial opportunity for MemScale: it can reduce Background, PLL/REG, and MC power. (ILP), and balanced (MID). The results are normalized to the average power of the MEM workloads. (We explain the details of our workloads and simulation methodology in Section 4.) We make four main observations from this figure: (1) background power is a significant contributor to power consumption, especially for the ILP and MID workloads (upcoming feature size reductions will make the background power an even larger fraction of the total); (2) activation/pre-charge and read/write powers are significant only for MEM workloads; (3) despite the fact that register/PLL power is often disregarded by researchers, this category of power consumption also contributes significantly to the total; and (4) despite the fact that the MC has not been included in previous studies of memory subsystem energy, it contributes a significant amount to overall consumption. 2.2
Impact of Voltage and Frequency Scaling
Figure 2 suggests that any mechanism that can lower the background, register/PLL, and MC powers without increasing other power consumptions or degrading performance excessively could be used to conserve significant energy. As it turns out, modern servers already embody one such mechanism. Specifically, in these servers, the voltage and frequency of MCs and the frequency of memory buses, DIMMs, and DRAM chips are configurable (in tandem, since incompatible frequencies would require additional syn-
chronization devices). Unfortunately, these parameters must currently be set statically at boot time, typically through the BIOS.
The DIMM clocks lock to the bus frequency (or a multiple thereof), while the MC frequency is fixed at double the bus frequency.
To exploit this mechanism for energy conservation, one has to understand the effect of lowering frequency on both power and performance. Lowering frequency affects performance by making data bursts longer and the MC slower, both by linear amounts. (The wall-clock performance of other operations is unaffected, despite the fact that their numbers of cycles increase linearly with decreases in frequency.) Because of these delays, queues at the MC may become longer, increasing memory access times further. Nevertheless, note that these latency increases in certain stages of the memory access process do not translate into linear increases in overall memory access time. In fact, our detailed simulations show only minor increases in average memory access time.
Performance counter monitoring. Our management policies require input from a set of performance counters implemented in the on-chip MC. Specifically, we require counters that track the amount of work pending at each memory bank and channel (i.e., queue depths). Counters similar to those we require already exist in most modern architectures, and are often already accessible through the CPU’s performance-monitoring interface. Under our scheme, the operating system reads the counters, like any other performance register, during each control epoch. We use the following counters:
Lowering frequency affects power consumption in many ways. First, it lowers background and register/PLL powers linearly. Second, it lowers MC power approximately by a cubic factor. The reason for this large benefit is two-fold: (1) lowering the MC frequency is accompanied by lowering its voltage; and (2) MC DVFS provides similar dynamic power advantages to CPU DVFS (P ower ∝ V oltage2 × f requency). In fact, note that, even though the MC is in the CPU chip nowadays, it is often in a voltage domain that is separate from those of the cores. Third, lowering frequency increases read/write and termination energy almost linearly (power is not affected but accesses take longer). Finally, if lowering frequency causes a degradation in application performance, the energy consumed by the server’s non-memory-subsystem components will increase accordingly.
3.
MemScale
In this section, we describe the MemScale design and the OS-level control algorithm to use it. First, we describe our proposed mechanisms to allow dynamic control of the memory subsystem leveraging underlying hardware capabilities. Next, we provide an overview of the control policy used to maximize the energy-efficiency of the system, while adhering to a performance goal. We then detail performance and energy models used by our control policy. Finally, we address the MemScale implementation costs. 3.1
Hardware and Software Mechanisms
Our system utilizes two key mechanisms: (1) our dynamic frequency scaling method, MemScale; and (2) performance counterbased monitoring to drive our control algorithm. MemScale. The key enhancement we add to modern memory systems is the ability to adjust MC, bus, and DIMM frequencies during operation. Furthermore, we propose to adjust the supply voltage of the MC (independently of core/cache voltage) in proportion to frequency. Though commercially-available DIMMs support multiple frequencies already, today, switching frequency typically requires system reboot. The JEDEC standard provides mechanisms for changing frequency [23]; the operating frequency of a DIMM may be reset while in the precharge powerdown or self-refresh state. Accordingly, we propose a mechanism wherein the system briefly suspends memory operation and can reconfigure itself to run at a new power-performance setting. For DIMMs, we leverage precharge powerdown for frequency re-calibration because the latency overhead is significantly less than self-refresh. The majority of recalibration latency is due to DLL synchronization time, tDLLK [32], which consumes approximately 500 memory cycles. Although our system adjusts the frequency of the MC, bus and DIMM together, from now on we shall simply refer to adjusting the bus frequency.
• Instruction counts – For each core, we need a counter for the
Total Instructions Committed (TIC), and Total LLC (Last-Level Cache) Misses (TLM). These counters increment each time any instruction is retired and any instruction causes an LLC miss, respectively. Our control algorithm uses these counters to determine the fraction of CPI attributable to memory operations. • Transactions-outstanding accumulators – To estimate the
impact of queueing delays, our performance model requires counters that track the number of requests outstanding at banks and channels. The Bank Transactions Outstanding (BTO) and Channel Transactions Outstanding (CTO) accumulators are incremented by the number of already-outstanding requests to the same bank when a new request arrives for a bank/channel. We also require a Bank Transaction Counter (BTC) and Channel Transactions Counter (CTC) that increment by one for each arriving request. The ratio of BTO/BTC (or CTO/CTC) gives the average number of requests an arriving request sees ahead of it queued for the same bank/channel. Note that only a single set of counters is needed regardless of the number of banks/channels, as only the average (rather than per-bank or per-channel) counts are used in our performance model. • Row buffer performance – To estimate the average DRAM
device access latency, our model requires a Row Buffer Hit Counter (RBHC), which tracks accesses that hit on an open row; an Open Row Buffer Miss Counter (OBMC), which counts the number of accesses that miss an open row and require the row to be closed; a Closed Row Buffer Miss Counter (CBMC), which counts accesses that occur when the corresponding bank is closed (since we use a closed-page access policy, this case is the most common for our multiprogrammed workloads; a row buffer hit occurs only when the next access to a row is already scheduled while the previous access is performed); and an Exit PowerDown Counter (EPDC), which counts the number of exits from powerdown state. As noted above, only a single set of these counters is needed, since average counts are enough to compute accurate DRAM access latencies. • Power modeling – To instantiate our memory power model
[33], we need a Precharge Time Counter (PTC) to count the percentage of time that all banks of a rank are precharged; a Precharge Time With CKE Low (PTCKEL) to count the percentage of time that all banks are precharged (PTC) when the clock enable signal is low; an Active Time With CKE Low (ATCKEL) to count the percentage of time that some bank is active (1 - PTC) when the clock enable signal is low; and a Page Open/Close Counter (POCC) to count the number of page open/close command pairs. The other information required by the power model can be derived from the other counters. Again, only a single set of these counters is needed to model power accurately [33]. Of these counters, only BTO, CTO, PTC, PTCKEL, and ATCKEL are not currently available (or not easily derived from other coun-
Slack
Core 1
Negative Slack
Slack
Core 2
Slack
Negative Slack
Ttr Ttr
Actual Target Max Frequency Profiling
Slack Ttr
Ttr
Memory Speed
Epoch 1
Epoch 2
Epoch 3
Epoch 4
Epoch 5
Time
Figure 3: Memscale operation: In this example, we illustrate the operation of MemScale for two cores. The best-case execution time is calculated at each epoch (“Max Frequency”). The target time is a fixed percent slower than this best case. Slack is the time difference between the target and current execution; it is accumulated across epochs. ters) in the latest Intel processors [21]. In fact, although some of these counters track events in off-chip structures, the counters themselves are already implemented in the MC hardware. Finally, note that counters EPDC, PTCKEL, and ATCKEL are only needed when we combine MemScale with a policy that transitions devices to powerdown. We consider such a combined policy in Section 4. 3.2
Energy Management Policy
Given these mechanisms, we now describe the energy management policy that controls frequency changes. Performance slack. Our control algorithm is based upon the notion of program slack: the difference between a baseline execution and a target latency penalty that a system operator is willing to incur on a program to save energy (similar to [9, 27]). Without energy management, a given program would execute at a certain base rate. By reducing the memory subsystem performance, the overall rate of progress is reduced. To constrain the impact of this performance loss, we allow no more than a fixed maximum performance degradation. Our control algorithm uses this allowance to save energy. The target is defined such that each executing program incurs no more than a pre-selected maximum slowdown relative to its execution without energy management (i.e., at maximum frequency). Given this target, the slack is then the difference in time of the program’s execution (TActual ) from the target (TTarget ). Slack = TTarget − TActual = TMaxFreq · (1 + γ) − TActual
(1)
The quantity γ defines the target maximal execution time increase. Operation. Our control algorithm is based upon fixed sizedepochs. We typically associate an epoch with an OS-level time quantum. During each epoch, we profile the system and select a memory subsystem frequency that (1) minimizes overall system energy, while (2) maintaining performance within the target given the accumulated slack from prior epochs. Each epoch proceeds in four stages: 1. Profile applications online – At the beginning of each epoch, the system is profiled by collecting statistics using the performance counters described above. By default, we profile for 300 µs, which we have found to be sufficient to predict the memory subsystem resource requirements for the remainder of the epoch. Our default epoch length is 5 ms. 2. Control algorithm invocation – After the profiling phase (i.e., collecting performance counters), the operating system uses
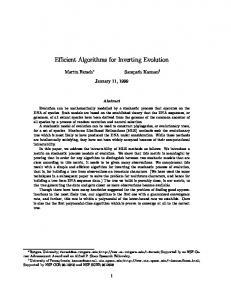
the profiling information to calculate a new memory frequency based on the models described in the next subsection. 3. Bus frequency re-locking – We transition the memory subsystem to its new operating frequency. To accomplish this adjustment, memory accesses are temporarily halted and PLLs and DLLs are resynchronized. Since the resynchronization overhead (< 1 µs) is so small compared to our epoch size (> 1 ms), the penalty is negligible. 4. Slack update – The epoch executes to completion at the new memory speed. At the end of the epoch, we again query the performance counters and estimate what performance would have been achieved had the memory subsystem operated at maximum frequency, and compare this to the achieved performance. The difference between these is used to update the accumulated slack and carried forward to calculate the target performance in the next epoch. Note that our policy queries the performance counters both at the end of each epoch and at the end of each profiling phase. Although we could rely solely on end-of-epoch accounting, we opt to profile for two main reasons. First, an epoch is relatively long compared to the length of some applications’ execution phases; a short profiling phase often provides a more current picture of the applications’ behaviors. Second, because it may not be possible to monitor all the needed counters at the same time, the profiling phase can be used to measure just the power-related counters (while only the performance-related counters would be measured the rest of the time). In this paper, we assume that all counters are monitored at the same time. Frequency selection. We select a memory frequency to achieve two objectives. First, we wish to select a frequency that maximizes full-system energy savings. The energy-minimal frequency is not necessarily the lowest frequency—as the system continues to consume energy when the memory subsystem is slowed, lowering frequency can result in a net energy loss if the program slowdown is too high. Our models explicitly account for the system-vs.-memory energy balance. Second, we seek to observe the bound on allowable CPI degradation for each running program. Because multiple programs execute within a single system, the selected frequency must satisfy the needs of the program with the greatest memory performance requirements. MemScale example. We illustrate the operation of MemScale in Figure 3. Each epoch begins with a profiling phase, shown in gray. Using the profiling output, the system estimates the performance at the highest memory frequency (“Max Frequency”), and then sets
3.3
Bank 1
Core 1
Blocked by Request at Bus - Channel 1
Bank 2
Bus Channel 1
Core 2 Bank 3
...
a target performance (“Target”) via Equation 1 above. Based on the target, a memory speed is selected and the system transitions to the new speed. In Epoch 1, the example shows that the actual execution (“Actual”) is faster than the target. Hence, the additional slack is carried forward into Epoch 2, slightly widening the gap between Max Frequency and Target, allowing the memory speed to be lowered. However, at the end of Epoch 2, performance falls short of the target, and the negative slack must be made up in Epoch 3 (or later epochs, if necessary) by raising memory frequency. By adjusting slack from epoch to epoch, MemScale tries to ensure that the desired performance target (given by γ) is met over time.
Core N Bank 4
Performance and Energy Models
Now, we describe the performance and energy models that the control algorithm uses to make smart decisions about frequency. Performance model. Our control algorithm relies on a performance model to predict the relationship between CPU cycles per instruction (CPI) of an application and the memory frequency. The purpose of our model is to determine the runtime and power/energy implications of changing memory performance. Given this model, the OS can set the frequency to both maximize energy-efficiency and stay within the predefined limit for CPI loss. We model an in-order processor with one outstanding LLC miss per core. We do so for three reasons: (1) these processors translate any increases in memory access time due to frequency scaling directly to execution time; (2) we expect server cores to become simpler as the number of cores per CPU increases; and (3) the modeling of these processors is simpler than their more sophisticated counterparts, making it easier to demonstrate our ideas. We approximate the effect of greater memory traffic (e.g., resulting from prefetching or out-of-order execution) by varying the number of memory channels and cores in Section 4.2.4. For our processors, the runtime of a program can be defined as: ttotal =tCPU + tMem =ICPU · E[T P ICPU ] + IMem · E[T P IMem ]
(2)
Here, ICPU represents the number of instructions and Imem is the number of instructions that cause an LLC miss to main memory. T P ICPU represents the average time that instructions spend on the CPU, whereas T P IMem represents the average time that a LLCmissing instruction spends in main memory. Since runtime is not known a priori, our system models the rate of progress of an application in terms of CPI. The average CPI of a program is defined as: E[CPI] = (E[T P ICPU ] + α · E[T P IMem ]) · FCPU
(3)
Where α is the fraction of instructions that miss the LLC and FCPU is the operating frequency of the processor. The value of α can easily be calculated as the ratio of TLM and TIC. While the expected time per CPU operation is insensitive to changes in memory speed (for simplicity, we assume it is fixed), the CPI of LLC-missing instructions varies with memory subsystem frequency. To model the time per cache miss, we decompose the expected time as: E[T P IMem ] = E[TBank ] + E[TBus ] E[TBank ] = E[SBank ] + E[WBank ] E[TBus ] = E[SBus ] + E[WBus ]
(4)
Here, E[SBank ] is the average time, excluding queueing delays, to access a particular bank (including precharge, row access and column read, etc). E[Sbus ] is the average data transfer (burst) time
Figure 4: Memory subsystem queuing model: Banks and channels are represented as servers. The cores issue requests to bank servers, which proceed to the channel server upon completion. Because of DRAM operation, requests are held at the bank server until a request frees from the channel server (the channel server has a queue depth of 0). In our example, the request that finishes at bank 1 cannot proceed to the bus until the request already there leaves. This example shows only a single channel. across the bus. Finally, the average waiting time to service previous request (i.e., queueing delays due to contention for the bank and bus) are represented by E[WBank ] and E[WBus ]. SBank can be further broken down as: E[SBank ] = E[TMC ] + E[TDevice ]
(5)
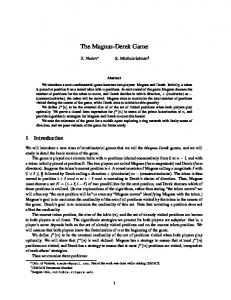
TMC varies as a function of MC frequency. In our MC design, each request requires five MC clock cycles to process (in the absence of queueing delays). TDevice is a function of DRAM device parameters and applications’ row buffer hit/miss rates and does not vary significantly with frequency, as we do not alter the operation or timing of the DRAM chips’ internal DRAM arrays. During the profiling phase, we estimate E[TDevice ] for the epoch using row buffer performance counters via: Row hit time = Thit = TCL · RHBC Closed-bank miss time = Tcb = [TRCD + TCL ] · CBMC Open-bank miss time = Tob = [TRP + TRCD + TCL ] · OBMC (6) Powerdown exit time = Tpd = TXP · EPDC Thit + Tcb + Tob + Tpd E[TDevice ] = RHBC + CBMC + OBMC TCL , TRP , TRCD , and TXP are characteristics of a particular memory device and are obtained from datasheets. To simplify the above equations, we have subsumed some aspects of DRAM access timing that have smaller impacts. Whereas modeling SBank and SBus is straight-forward given manufacturer data sheets, modeling the wait times due to contention E[WBank ] and E[WBus ] is more challenging. Ideally, we would like to model the memory system as a queuing network to determine these quantities. Figure 4 shows the queuing model corresponding to our system. Queueing delays arise due to contention for a bank and the memory bus. (Delayed requests wait at the MC; there are typically no queues in the DRAM devices themselves). The inorder CPUs act as users in a closed queuing network (each issuing a single memory access at a time). Memory requests are serviced by the various banks, each represented by a queue. The bus is modeled as a server with no queue depth; when a request completes service at a bank, it must wait at the bank (blocking further re-
quests) until it is accepted by the bus. This blocking behavior models the activate-access-precharge command sequence used to access a DRAM bank—the bank remains blocked until the sequence is complete. Unfortunately, this queueing network is particularly difficult to analyze. Specifically, because the system exhibits transfer blocking behavior [2, 4] (disallowing progress at the bank due to contention at the bus), product form solutions of networks of this size are infeasible. Most approaches to this problem rely on approximations that have errors as high as 25% [2, 4]. Instead of using a typical queuing model, we now describe how a simple counter-based model can yield accurate predictions. We find that the accuracy afforded by the counters justify their implementation cost. Our approach is to define counters that track the number of preceding requests that each arriving request finds waiting ahead of it for a bank/bus. We then take the expectation of this count over all arrivals to obtain an expression for the expected wait time for each request. We implement the necessary counters directly in hardware as described in Section 3.1. We first illustrate our derivation for bus time. P For a single request k, the bus time can be expressed as E[SBus ]· kl=1 BusServiceLeft(l, k). The function BusServiceLeft(l, k) is defined as the fraction (between 0 and 1) of service time remaining for request l at the arrival time of request k (it is 0 for requests that are complete and 1 for requests that are queued but not yet in service). The summation adds together the remaining service for all jobs arriving before k, thereby yielding the total number of requests in queue at the time request k arrives, including request k. To obtain average bus time, we average over all requests: Pn Pk k=1 l=1 BusServiceLeft(l, k) E[Tbus ] = · E[SBus ] (7) n = ξBus · E[SBus ] The variable ξ represents the average work in the queue, including residual work from prior requests, when a new request arrives. In our hardware design, ξBus is approximated by the performance counters CTO/CTC, which track the average number of requests waiting for a bus channel. Our estimate of ξBus is an approximation because we use the values of CTO and CTC measured at one frequency (the frequency in use during profiling) and assume the value holds at all other frequencies. In reality, the degree of bank and channel queueing can vary across frequencies. However, we have found that, in practice, this approximation works well, because deep bank/bus queues are rare for our workloads and small estimation errors are corrected through the slack mechanism. Nevertheless, our approach can easily be modified to tackle deep queues, by profiling at one more frequency and interpolating the queue size results for the others. Using a similar construction, we can derive an expression for the expected bank time: Pn Pi i=1 j=1 BankServiceLeft(j, i) E[Tbank ] = · [E[SBank ] + E[TBus ]] n = ξBank · [E[SBank ] + E[TBus ]] (8) where ξBank is approximated by BTO/BTC. Note that E[TBus ] appears as a term within E[TBank ], as a request arriving at a bank remains blocked till all preceding requests are able to drain over the bus. It is precisely this construction that captures the transfer blocking behavior and allows us to sidestep the difficulties of queuing analysis.
Noting that, under this construction, E[T P IMem ] = E[Tbank ] (bus time has been folded into the expression for the bank time), we condense our analysis to the equation: E[T P IMem ] = ξbank · (SBank + ξbus · Sbus )
(9)
Full-system energy model. Simply meeting the CPI loss target for a given workload does not necessarily maximize energy-efficiency. In other words, though additional performance degradation may be allowed, it may save more energy to run faster. To determine the best operating point, we construct a model to predict full-system energy usage. For memory frequency fmem , we define the system energy ratio (SER) as: SER(fmem ) =
TfMem · PfMem TBase · PBase
(10)
TfMem is the performance estimate for an epoch at frequency fMem . PfMem = PMem (fMem ) + PNonMem , where PMem (f ) is calculated according to the model for memory power in [33], and PN onM em accounts for all non-memory system components and is assumed to be fixed. TBase and PBase are corresponding values at a nominal frequency. At the end of the profiling phase of each epoch, we calculate SER for all memory frequencies that can meet the performance constraint given by Slack, and select the frequency that minimizes SER. As we consider only ten frequencies, it is reasonable to exhaustively search the possibilities and choose the best. In fact, given that this search is only performed once per epoch (5 ms by default), its overhead is negligible. 3.4
Hardware and Software Costs
We now consider the implementation cost of MemScale. The core features in our system are already available in commodity hardware. Although real servers do not exploit this capability, existing DIMMs already support multiple frequencies and can switch among them by transitioning to powerdown or self-refresh states [23]. Moreover, integrated CMOS MCs can leverage existing voltage and frequency scaling technology. One necessary change is for the MC to have separate voltage and frequency control from other processor components. In the most recent Intel architecture, this would require separating last-level cache and MC voltage control [21]. Though processors with multiple frequency domains are common, there have historically been few voltage domains; however, recent research has shown this is likely to change soon [17]. Whereas modifying the operating voltage of DIMMs and DRAM circuitry may be possible, devices with this capability have not yet been marketed commercially. There are substantial challenges in operating a DRAM array at multiple voltages, as many circuits in the DRAM access path require precisely tuned timing and transistor sizing that is specific to the operating voltage. Since we observe significant energy savings from frequency scaling alone, we restrict our first study to a single voltage level in DIMMs. Nevertheless, we will consider more aggressive approaches in our future work. Our design also may require enhancements to hardware performance counters in some processors. Most processors already expose a set of counters to observe processing, caching and memoryrelated performance behaviors (e.g., row buffer hits/misses, row pre-charges). In fact, the latest Intel architecture already exposes a number of MC counters for queues [26]. However, the existing counters may not conform precisely to the specifications required for our models. As discussed above, the time overhead of our OS-level policy is negligible, since it is only incurred at the multi-millisecond granularity.
Table 2: Main system settings.
Table 1: Workload descriptions. Name ILP1 ILP2 ILP3 ILP4 MID1 MID2 MID3 MID4 MEM1 MEM2 MEM3 MEM4
4.
RPKI 0.37 0.16 0.27 0.24 1.72 2.61 2.41 2.11 17.03 8.62 15.6 8.96
WPKI 0.06 0.01 0.01 0.06 0.01 0.09 0.16 0.07 3.03 0.25 3.71 0.33
Applications (x4 each) vortex gcc sixtrack perlbmk crafty gzip sixtrack mesa perlbmk vortex mesa perlbmk ammp gap wupwise astar parser twolf apsi bzip2 ammp wupwise vpr astar swim applu art fma3d mgrid galgel swim applu galgel art lucas mgrid
mesa eon crafty crafty vpr facerec gap parser lucas equake equake fma3d
Evaluation
4.1 Methodology Simulator and workloads. Since the few hardware mechanisms we propose are not yet available, our evaluation is based on simulations. To reduce simulation times, our simulations are done in two steps. In the first step, we use M5 [7] to collect memory access (LLC misses and writebacks) traces from a variety of workloads running on a 16-core server. Table 1 lists the main characteristics of our 12 workloads. The workloads are formed by combining applications from the SPEC 2000 and SPEC 2006 suites. As in [45], we classify the workloads into three categories: memory-intensive workloads (MEM), computation-intensive workloads (ILP), and balanced workloads (MID). We use the same workload mixes as the prior study [45] with two exceptions: two workloads they classify as balanced behave like memory-intensive workloads in our environment. For this reason, we replaced those two workloads with our MID3 and MID4 workloads. The rightmost column of Table 1 lists the composition of each workload. We analyze the best 100M-instruction simulation point for each application (selected using Simpoints 3.0 [38]). The workload terminates when the slowest application has executed 100M instructions. We report the LLC misses per kilo instruction (RPKI) and LLC writebacks per kilo instruction (WPKI) observed during trace generation in Table 1. In the second step, we replay the traces using our own detailed memory system simulator. This simulator models all aspects of the OS, memory controller, and memory devices that are relevant to our study, including behavior profiling, memory channel and bank contention, memory device power and timing, and row buffer management. The memory controller exploits bank interleaving and uses closed-page row buffer management, where a bank is kept open after an access only if another access for the same bank is already pending. Closed-page management is known to lead to lower energy consumption and better performance for multi-core CPUs [40]. Memory read requests (cache misses) are served on an FCFS basis. Reads are given priority over writebacks until the writeback queue is half-full. More sophisticated memory scheduling is not necessary for these single-issue multiprogrammed workloads, as opportunities to increase bank hit rate via scheduling are rare, and such improvements are orthogonal to our study. Regarding energy management, the simulator implements our mechanisms and policy in great detail. For comparison, we also simulate scenarios in which the memory controller immediately transitions a rank to fast-exit powerdown or slow-exit powerdown upon closing all banks of the rank. We also simulate a scenario in which a fixed frequency for the entire memory subsystem (memory controller, channels, DIMMs, and DRAM devices) is selected stati-
Feature CPU cores L1 I/D cache (per core) L2 cache (shared) Cache block size Memory configuration tRCD, tRP, tCL tFAW tRTP tRAS Time tRRD Exit fast pd (tXP) Exit slow pd (tXPDLL) Refresh period Row buffer read, write Activation-precharge Active standby Active powerdown Current Precharge standby Precharge powerdown Refresh VDD
Value 16 in-order, single thread, 4GHz 6 IntALU, 2 IntMul, 4FpALU, 2FpMulDiv 64KB, 2-way, 1 CPU cycle hit 16MB, 4-way, 10 CPU cycle hit, 1 miss/core 64 bytes 4 DDR3 channels, 8 2GB DIMMs with ECC 15ns, 15ns, 15ns 20 cycles 5 cycles 28 cycles 4 cycles 6ns 24ns 64ms 250 mA, 250 mA 120 mA 67 mA 45 mA 70 mA 45 mA 240 mA 1.575 V
cally. As a final baseline for comparison, our simulator implements the Decoupled DIMMs approach to conserving memory system energy [45]. Parameter settings. Table 2 lists our main parameter settings. Recall that one of the reasons we study in-order cores is to expose any performance degradations resulting from frequency scaling directly to running time. We compensate for their lower bus utilization by simulating a large number of cores. Our baseline memory subsystem has 4 DDR3 channels, each of which is populated with two registered, dual-ranked DIMMs with 18 DRAM chips each. Each DIMM also has a PLL device. Each DRAM chip has 8 banks. We study the impact of the most important aspect of the memory subsystem configuration (the number of memory channels) in Section 4.2.4. This study also allows us to approximate the effect of the greater memory traffic. The timing and power parameters of the DRAM chips, register, PLL, and memory controller are also shown in Table 2 [33]. These data are for devices running at 800 MHz. We also consider frequencies of 733, 667, 600, 533, 467, 400, 333, 267, and 200 MHz. The timing parameters at frequencies other than 800 MHz were computed in the obvious way, according to the aspects of performance that are affected by scaling (Section 2). The current parameters at other frequencies were scaled according to Micron’s power calculator [33]. The transitions between frequencies are assumed to take 512 memory cycles plus 28 ns. This assumes that frequency can only be changed after going into fast-exit pre-charge powerdown state and locking the DLLs, as specified in [23]. The power consumptions of some components also vary with the utilization. Specifically, the powers of registers and memory controller scale with their respective utilization linearly from idle to peak power; the PLL power does not scale with utilization. The register power ranges from 0.25W to 0.5W as a function of utilization, whereas the memory controller power ranges from 7.5W to 15W [16, 21]. This maximum memory controller power was taken from [3]. We study the impact of the power proportionality of the register and the memory controller in Section 4.2.4. We assume that the voltage of the memory controller varies over the same range as the cores (0.65V1.2V), as its frequency changes. Some year-2010 Xeons have an even wider range (e.g., core voltages in the 7500 series range from 0.675V to 1.35V). In current Xeons, the uncore voltage range is narrower than that of the cores. However, the uncore domain cur-
Memory System Energy Memory System Energy
CPI Increase (%) CPI Increase (%)
6% 6% 4% 4% 2% 2% 0% 0%
400400
CPI CPI
We do not model power consumption in the non-memory system 200200 components in detail. Rather, we assume that the average power consumption of the DIMMs accounts for 40% of the total system 0 0 power, and compute a fixed average power estimate (the remaining 20all other components. 60%)20for This (b) (b) ratio has been identified as the apsiapsi current contribution of DIMMs to entire server power consumption 15 15 [5, 6, 42]. We study the impact of this ratio in Section 4.2.4. bzip2 bzip2 10 10
Channel Utilization ation Channel Utilization ation
ammp For the static-frequency baseline, we select the frequency (467 ammp MHz)5that without 5 achieves the highest energy savings on average,gap gap violating the performance target for any workload. Similarly, our 0 0 implementation of Decoupled DIMMs assumes that the memory channels run at 800 MHz, whereas the DRAM devices operate at 100% 100% (c)(c) the static frequency (400 MHz) that achieves the highest energy 80%80% ch0ch0 savings on average, without violating the performance target for 60% any workload. In addition, we optimistically neglect anych1 power 60% ch1 overhead 40%40% for the synchronization buffer required by Decoupled ch2ch2 DIMMs. 20% ch3ch3
0 0 50 50 100 In this subsection, we present the quantitative 100 evaluation of our performance-aware energyTime (ms) management Time (ms) policy.
Energy and Performance
Timeline Timeline We start by studying the impact of our policy on the energy and performance of our workloads, assuming a maximum allowable performance degradation of 10%. Figure 5 shows the memory and system energy savings we achieve for each workload, compared to a baseline system that keeps the memory subsystem at its highest voltage and frequency. The memory energy savings range from 17% to 71%, whereas the system energy savings range from 6% to 31%. As one would expect, the ILP workloads achieve the highest gains (system energy savings of at least 30%). These workloads can keep the voltage and frequency of the memory system at their lowest possible value all the time. The savings achieved by the MID workloads are lower but still significant (system energy savings of at least 15%). The MEM workloads achieve the smallest energy savings (system energy savings of at least 6%), since their greater memory channel traffic reduces the opportunities for significant voltage and frequency scaling. Figure 6 shows that these energy savings can be achieved without violating the maximum allowable performance degradation for
Figure 6: CPI overhead. Both average and worst-case CPI overFigure 2 -2the Performance heads fall well within degradationLoss bound. Figure - target Performance Loss 800 any 800 application in the workloads. The figure shows the average and ( )(a) (a) ( ) the applications in each of maximum percent CPI losses across 600600 our workloads, again compared to the vanilla baseline. The results 400400 that our policy indeed limits the maximum CPI indemonstrate crease to the acceptable range; no application is ever slowed down 200than 200 9.2%. The results also demonstrate that, when we avmore erage 0the performance degradations of all the applications in each 0 workload, this average is never higher than 7.2%. Again, as one 14 14 would expect, the degradations(b) are smallest for the ILP workloads, 12 12by the MID workloads, (b) followed and then the MEM workloads. art art Bus Freq (MHz) Bus Freq (MHz)
Bus Freq (MHz) Bus Freq (MHz)
rently SRAM, which is typically more difficult to voltage800includes 800 (a)the scale than logic. The power of (a) memory controller scales with both600 voltage 600 and frequency. The PLL and register powers scale linearly with channel frequency.
4.2.1
Worst Program in Mix Worst Program in Mix CPI Degradation Bound CPI Degradation Bound
8% 8%
Figure 5: Energy savings. Memory and full-system energies are
20%
Multiprogram Average Multiprogram Average
10%10%
Figure 1 -1Energy Savings. significantly particularly for the ILP workloads. Figure -reduced, Energy Savings.
4.2 0%Results 0%
12%12%
10 10
8 8 think that the policy could produce even higher lucas One might energy lucas 6 6if it could keep voltage and frequency low longer and apsavings, mgrad mgrad 4 4 the maximum allowable degradation more closely. proximate This 2 fma3d 2 would increase the memory energy savings. However, remember fma3d 0 0 that increasing running time also involves consuming more system 0 0 our policy degrades 50 50 performance100 energy. Thus, only 100up to the point that this translates into overall system energy savings. Time (ms) Time (ms) CPI CPI
Full System Energy Full System Energy
Energy Savings (%) Energy Savings (%)
80%80% 70%70% 60%60% 50%50% 40%40% 30%30% 20%20% 10%10% 0% 0%
These energy and performance results are very positive. The ILP workloads can achieve up to 31% system energy savings for only a maximum performance degradation of 3.2%. The MID results also exhibit substantial benefits. Even the challenging MEM workloads achieve up to 9% system energy savings within the allowable performance degradation. Overall, we observe that MemScale produces average system energy savings of 18.3% for an average performance degradation of only 4.2%. 4.2.2
Dynamic Behavior
To understand the results above more deeply, let us consider an example workload and the dynamic behavior of our policy. Figure 7 plots (a) the memory subsystem frequency selected by our policy for workload MID3, (b) the CPI of each application in the workload (averaged over the 4 instances of the application), and (c) the resulting scaled channel utilization, as a function of execution time. The figure shows a few interesting frequency transitions. After the start of the workload, our policy quickly reduces the frequency to the minimum value and keeps it there until it detects the massive phase change of application apsi. As Figure 7(b) illustrates, the phase change occurred during the 46 ms quantum. Because our policy is OS-driven, the system only detected the phase change and increased the frequency at the next quantum boundary (around 51 ms). Despite this short reaction delay, our policy still keeps the performance degradation for apsi (8.2%) well under the allowable limit. As Figure 7(c) depicts, the two frequencies selected by our policy for the two phases of the workload keep the scaled channel utilization around 25%.
Energy Savings (%) Savings (%) Bus Freq (MHz)
800
Figure 2 - Performance Loss
(a)
600 400 200 0 15
(b)
apsi
10 CPI
bzip2 ammp
5
gap 0 12% 100% 10% 80% 8% 60% 6% 40%
Multiprogram Average
(c)
Worst Program in Mix
ch1
ch3
0% 2% 0
50 Time (ms)
100
Figure 7: Timeline of MID3 workload. MemScale adjusts
Timeline memory system frequency rapidly in response to the phase change in apsi.
Bus Freq (MHz)
Figure 2 - Performance Loss
800
( ) (a)
600 400 200 0
bzip2 ammp gap
CPI
apsi
14 12 10 8 6 4 2 0
(b)
art lucas mgrid fma3d
0
50 Time (ms)
100
ch0 ch1 ch2 ch3
art lucas mgrad fma3d
50 Time (ms)
100
Figure 9: Energy savings. MemScale provides greater fullsystem and memory system energy savings than alternatives.
ch2
20% 4%
0%
Memory System Energy
(b)
0
CPI Degradation Bound ch0
Full System Energy ( ) (a)
Figure 8: Timeline of MEM4 workload. MemScale approximates a “virtual frequency” by oscillating between two neighboring frequencies.
Figure 8 shows another interesting dynamic behavior, this time for workload MEM4 on an 8-core system. Note that our policy alternates between two frequencies throughout most of the execution. (Recall that frequency transitions are fast and we only initiate transitions on quantum boundaries.) The reason for this behavior is that the space of usable frequencies is not continuous; the ideal frequency is really between the two usable frequencies. In essence, our policy defines a “virtual frequency” by alternating between the two frequencies.
Multiprogram Average Worst Program in Mix 4.2.314%Comparison with Other Policies
In this 12% subsection, we compare our MemScale policy (“MemScale”) to six alternatives. The first alternative (“Fast-PD”) rep10%today’s aggressive memory controllers, which immediately resents 8% a rank to fast-exit precharge powerdown state whentransition ever the 6% last open bank of the rank is closed. The second alternative (“Slow-PD”) is even more aggressive in that it transitions the 4%slow-exit precharge powerdown state. The third alternative rank to (“Decoupled”) is the decoupled DIMM approach to energy conser2% vation, which combines low-frequency memory devices with high0% frequency channels. The fourth alternative (“Static”) represents the scenario in which the frequency for the memory controller, channels, DIMMs, and DRAM devices is selected statically before the workloads are started. The fifth and sixth alternatives are actually variations of our policy. The fifth (“MemScale (MemEnergy)”) considers only the memory energy (rather than the overall system energy) in making decisions. The sixth (“MemScale + Fast-PD”) is our full policy combined with fast-exit powerdown. CPI Increase (%))
Channel Utilization ation CPI Increase (%)
ergy
800 50% 600 45% 40% 400 35% 200 30% 25% 0 20% 14 15% 12 10% 10 5% 8 0% 6 4 2 0
CPI
Bus Freq (MHz)
Figure 1 - Energy Savings.
Figure 9 shows the average energy savings achieved by all alternatives, across the MID workloads. For these same workloads, Figure 10 breaks down the average system power of each alternative between its DRAM, PLL/register, memory controller, and rest-ofthe-system (everything but the memory subsystem) components. Figure 11 shows the average and maximum performance degradations for all the alternatives, again across the same workloads. All results are computed with respect to the baseline, which keeps the memory subsystem at its highest frequency at all times. These results demonstrate that Fast-PD achieves small energy savings at small performance degradations. The energy savings come from reductions in the power consumption of the DRAM chips. For the MEM and ILP workloads, Fast-PD achieved system energy savings between 0.3% (MEM2) and 7.4% (ILP3). Being more aggressive with Slow-PD actually hurts performance so much that the workloads consume more system energy than the baseline system. In fact, the performance of one of the applications actually degrades by 15%. Both of these results match expectations. In contrast, Decoupled does better than Fast-PD or Slow-PD. It achieves higher energy savings at moderate performance degradations for the MID workloads. The energy savings come from reductions in the power consumed by the DRAM devices. Decoupled also does well for the ILP workloads, achieving a maximum energy savings of 11%. However, it actually increases the energy
PLL/Reg.
MC
Rest of system
1 0.9 0.8 0.7 0.6 0.5 04 0.4 0.3 0.2 0.1 0
Figure 10: System energy breakdown. MemScale reduces DRAM, PLL/Reg, and MC energy more than alternatives. consumption for one of the MEM workloads (MEM3) by 0.8%. This result is due to a significant performance degradation for this workload. Static conserves more memory and system energy than Decoupled (for roughly the same performance degradations), despite the fact that the frequency of the DRAM devices is lower under Decoupled than Static (400 vs 467 MHz). This arises because Static decreases the energy consumption of the memory controller and the PLL/register devices. Decoupled does not address these sources of energy consumption. DRAM device energy is indeed lower under Decoupled, as one would expect. Static also does well for the ILP and MEM workloads, achieving average system energy savings of 19.1% and 7.8%, respectively, always within the allowed performance 18% degradation. MemScale 16% easily outperforms Decoupled. We achieve almost 3x1% bound higher energy savings, while keeping degradation within the al-5% bound 14% The reason for this result is that MemScale can dylowed range. 10% bound namically 12%adjust frequencies and achieve energy gains in the mem-15% bound ory controller and PLL/register as well.
14%
Multiprogram Average
Worst Program in Mix
12% CPI Increase (%))
Energy rmalized to Base) (Normalized to Base)
DRAM
10% 8% 6%
m
4% 2% 0%
Figure 11: CPI overhead. MemScale’s CPI increases are under 10%. MemScale (MemEnergy) slightly exceeds the bound. Interestingly, note that adding Fast-PD to MemScale does not meaningfully improve its results; the average system energy savings stay roughly the same (lower DRAM chip power but higher rest-of-the-system power), whereas the performance degradations worsen slightly.
4.2.4
Sensitivity Analysis
In this section, we investigate the effect of our main simulation and policy parameters: the maximum allowable performance degradation, the configuration of the channels and DIMMs, the fraction of the memory power with respect to the whole server power, the power proportionality of the memory controller and DIMMs’ registers, the length of the OS quantum, and the length the profiling 1%ofbound period. We again perform these studies using the MID workloads.
0.0754 SystemThis Enparameter Maximum performance degradation. is important in that higher allowable Worst-case degradations could 0.0105 enable greater energy savings. To understand the impact of this parameter, Figure 12 illustrates the energy savings (bars on the left) and maximum 10% achieved degradations (bars on the right), for maximum allowable MemScale is also superior to Static in both memory and system en8% degradations of 1%, 5%, 10%, and 15%. Recall that our default ergy savings, but leads to slightly (2%) higher performance degramaximum allowable degradation is 10%. All other parameters redations. 6% Specifically, MemScale’s average system energy savings is main at their defaults. It is interesting to observe that 1% and 5% 30.2% for 4% the ILP workloads and 16.9% for the MID workloads, degradations indeed produce lower energy savings. However, alwhereas Static achieves only 19.1% and 14.5% savings, respec2% savings for the MEM workloads are comparable.) Our lowing 15% degradation does not improve our savings: beyond a tively. (Their certain point, lengthening the execution to conserve more memory greater energy savings come from MemScale’s ability to dynami0% energy actually increases overall energy. At that point, our policy cally adjust frequency to the exact conditions of each workload. System Energy Reduction Worst‐case CPI Increase stops lowering frequency. Under the unrealistic assumption that the user would (1) manually select the best frequency for each workload, and (2) somehow inAmount of memory traffic. As far as MemScale is concerned, the struct the server to reboot to the new frequency before running the number of channels is the most important aspect of the memory workload, Static and MemScale would differ little for the worksubsystem configuration. The number of channels directly affects loads that do not exhibit dynamic phase changes. For those that do, how heavily utilized each channel is and, thus, our opportunities MemScale would still surpass Static through dynamically adjusting to lower frequency without excessively degrading performance. In the frequency, as seen in the MID3 workload, for example. fact, decreasing the number of channels approximates the effect of As we suggested before, when our policy is set to consider memgreater memory traffic that could result from prefetching or outory energy and not system energy (MemScale (MemEnergy)), the of-order execution. Figure 13 depicts the energy savings (left) and system conserves more memory energy but at the cost of system maximum achieved performance degradation (right) for 2, 3, and energy and performance. Moreover, note that MemScale (MemEn4 channels. Recall that our default results assumed 4 channels. ergy) exceeds the performance target by just 0.8% for two appliThe figure shows that increases in the number of channels indeed cations, each in a different workload. The reason is that MemScale increase the benefits of MemScale by non-trivial amounts, without sometimes mispredicts the queue lengths of the highest memory affecting our ability to limit performance losses. Interestingly, the frequency. These mispredictions affect MemScale’s computation of figure also shows that doubling the channel traffic (from 4 to 2 the performance slack. channels) still leads to system energy savings of roughly 14%.
25%
20% 25%
1% bound 0% Idle Power 5% bound 50% Idle Power 10% bound 100% Idle Power 15% bound
15% 20% 15% 10%
20% vary-othsyspower.pdf
3 channels 2 channels
15% 10%
10% 5%
5%
5%
0% System Energy Reduction System Energy Reduction
Worst‐case CPI Increase Worst‐case CPI Increase
Figure 12: Impact of CPI bound. Increasing the bound beyond 10% does not yield further energy savings. 25%
30% Mem 40% Mem 50% Mem
25% Full System Energy vary-mcregprop.pdf 50% 20% 45% 40% 15% 35% 30% 10% 25% 20% 5% 15% 10% 5% 0% 0% System Energy Reduction
Worst‐case CPI Increase
0% Idle Power Memory System Energy 50% Idle Power
vary-othsys
100% Idle Power
Energy Savings (%) Savings (%)
20%
1% bound Figure 13: Impact of numberSystem of channels. provides 0.0754 EnMemScale greater savings when there are more, less-utilized channels. Worst-case 0.0105 System Energy Reduction
15% 10% 5% 0% System Energy Reduction
Worst‐case CPI Increase
Figure 14: Impact of fraction of memory power. Increasing the fraction increases energy savings. Another approach for studying the effect of greater memory traffic is to increase the number of cores, while keeping the LLC size the same. Thus, we performed experiments with 32 cores and 4 memory channels. For the MID workloads, the larger number of cores causes 2x-4x increases in traffic. These increases translate into system energy savings ranging from 7.6% to 10.4%, without any violations of the performance bound. Fraction of memory system power with respect to server power. Because MemScale seeks to reduce whole-system energy consumption by reducing the memory subsystem energy, the contribution of the memory subsystem to the overall power consumption of the server becomes a crucial parameter. Intuitively, the larger this fraction, the larger our percentage energy savings. Furthermore, recall that the non-memory-subsystem power consumption affects our energy management policy. Intuitively, the lower the non-memory-subsystem contribution, the lower the frequencies that our policy can select. Figure 14 quantifies the impact of 30%, 40%, and 50% fractions of memory power on the system energy savings. Recall that our baseline assumes a fraction of 40%. The figure shows that the fraction of memory power has a significant effect on the system energy savings. Increasing the fraction from 30% to 50% (or, equivalently, reducing the rest-of-thesystem contribution from 70% to 50%) more than doubles the savings (11% vs 24%). The maximum CPI degradation increases by a few percent as well, but stays within the allowed range.
Worst‐case CPI Increase
Figure 15: Impact of power proportionality of MC and registers. Decreasing proportionality increases energy savings. 25%
Power proportionality of the memory controller 30% Mem and DIMMs’ 40% Mem registers. Since the memory controller and DIMM register de-vary-mcreg 20% are vendor- and model-dependent, we studied a50% Mem signs wide range of power proportionality possibilities for these components. Specif15% we variedMultiprogram Average ically, their idle power consumption from 0% (perfect Worst Program in Mix 14% proportionality) to 100% (no proportionality) of their peak power consumption. Recall that our default assumption is 50% idle power 10%12% for these components. For this analysis (and our other results), we 10% assume that their power consumption changes linearly with utiliza5% 8% tion between idle and peak loads. Figure 15 depicts the results. CPI Increase (%))
0% 0%
4 channels
6%
The 0%figure shows that the power proportionality of these compo4% a significant impact on the system energy savings. Innents has System Energy Reduction Worst‐case CPI Increase terestingly, 2% decreasing proportionality actually increases our savings significantly to 23%. As the memory subsystem’s idle power 0% increases (decreasing proportionality), the scope of MemScale to reduce register and memory controller power grows. Importantly, MemScale achieves these benefits without violating the allowed performance degradation. Length of the OS quantum (epoch) and profiling period. We studied the effect of (1) the epoch length by considering quanta of 1, 5, and 10ms; and (2) the length of the profiling period by considering periods of 0.1, 0.3, and 0.5ms. The first study sought to assess our ability to stay within the performance requirement, even when our decisions could not be changed for long periods of time. Similarly, the goal of the second study was to assess the need for long profiling periods before making decisions. Overall,
these studies revealed that MemScale is essentially insensitive to reasonable values of these parameters.
5.
Related Work
To the best of our knowledge, this paper is the first to propose active low-power modes for main memory. It is also the first to create such modes for the memory controller. Finally, it is the first to propose operating system policies to leverage these modes to conserve energy without excessive performance degradation. We discuss various classes of related works next. Processor DVFS. Our work is most closely related to processor DVFS. While there is a large body of work on this topic, these techniques have only been applied to the CPU, e.g. [17, 19, 34]. Lowering DRAM frequency. The memory-related approach that is most closely related to ours is to run the DRAM devices at a lower frequency than the memory channel, using Decoupled DIMMs [45]. Like MemScale, this technique reduces DRAM power. However, our work differs from Decoupled DIMMs in three main ways. First, a Decoupled DIMM requires a power-hungry synchronization buffer to bridge the gap between the DRAM and channel speeds. Second, we allow dynamic adjustment of frequencies by the operating system to match the needs of workloads online; the frequencies of the memory channels and DRAM devices were set statically in Decoupled DIMMs. Third, MemScale not only reduces DRAM power, but also memory bus, non-DRAM DIMM, and MC powers as well. Rank subsetting and DRAM reorganization. Recently, there have been several proposals to improve the efficiency of the memory system by reducing the number of chips or bits accessed at a time [1, 43, 44]. Udipi et al. proposes to do so by re-architecting the DRAM devices [43]. Unfortunately, although highly beneficial, such re-architecting is likely to incur significant costs and may affect yield as well. In contrast, other proposals reduce the number of chips in a rank by modifying DIMMs but not the DRAM chips [1, 44]. For example, Multicore DIMMs [1] allow the creation of Virtual Memory Devices (VMDs) comprising a small number of DRAM chips. This approach divides a physical channel into as many logical buses as there are VMDs. In addition, it requires a demux register in each rank, which routes signals to the correct VMD. MemScale is orthogonal to and can easily be combined with these approaches; we target background, register/PLL, and MC power consumptions, whereas they target dynamic power. In addition, our work leverages existing commodity DIMM and DRAM parts and proposes extending existing hardware mechanisms to dynamically scaling MCs, channels, DIMMs, and DRAM devices. DRAM idle low-power states. DRAM technologies often expose a small number of idle low-power states that greatly reduce DRAM power, but preclude access until the DRAM returns to the active state. Because servers do not typically exhibit enough memory idleness, researchers have proposed many approaches to create idleness and conserve energy using these states [10, 11, 13, 20, 24, 27, 36]. Unfortunately, these techniques are very difficult to exploit when the granularity of power management is a rank of DRAM chips, as in DDR* technology. Leveraging ensembles for energy savings. A few proposals have used ensemble-level techniques [28, 31, 41] to amortize the impact of memory energy. At this point, it is not clear if these techniques apply to all workloads. Nevertheless, our approach is orthogonal to ensembles and could be applied to them as well.
Managing peak power and temperature. Recent research has proposed techniques to limit the peak power consumption and/or manage temperature [11, 14, 18, 29, 30]. Among them, memory throttling has been receiving significant attention. Throttling limits power consumption by limiting the number of requests to memory in each time period. MemScale differs from throttling in two main regards. First, our goal is to conserve energy, not to limit peak power or prevent thermal overload. Second, we reduce the speed of the memory subsystem, instead of delaying memory accesses.
6.
Conclusion
In this paper, we proposed the MemScale approach to managing memory energy under performance constraints. MemScale creates and leverages active low-power modes that result from dynamically scaling the frequency of memory channels and DRAM devices, and dynamically scaling the voltage and frequency of the memory controller. We also proposed a small set of mechanisms and an operating system policy to determine the best power mode at each point in time. Our evaluation demonstrated that MemScale conserves significant memory and system energy, while staying within pre-set performance limits. Our results also showed that MemScale is superior to four competing energy management techniques. We conclude that MemScale’s potential benefits far outweigh its small hardware costs. Our future work will consider selecting different frequencies for different channels, OS-level scheduling to increase the potential benefits of MemScale, coordinating CPU and memory DVFS, combining MemScale with rank-subsetting techniques, and voltage scaling parts of DIMMs as well.
Acknowledgements We would like to thank Eugene Gorbatov and our shepherd Onur Mutlu for comments on many aspects of this work.
References [1] J. H. Ahn, N. P. Jouppi, C. Kozyrakis, J. Leverich, and R. S. Schreiber. Future scaling of processor-memory interfaces. SC ’09 - Super Computing, 2009. [2] I. Akyildiz. On the exact and approximate throughput analysis of closed queuing networks with blocking. IEEE Transactions on Software Engineering, 14(1):62–70, 1988. [3] AMD. ACP – The Truth About Power Consumption Starts Here, 2009. http://www.amd.com/us/Documents/43761C ACP WP EE.pdf. [4] S. Balsamo, V. D. N. Persone, and R. Onvural. Analysis of Queuing Networks with Blocking. 2001. [5] L. A. Barroso and U. H¨olzle. The Datacenter as a Computer: An Introduction to the Design of Warehouse-Scale Machines. Synthesis Lectures on Computer Architecture, Jan. 2009. [6] L. A. Barroso and U. H¨olzle. The Case for Energy-Proportional Computing. IEEE Computer, 40(12):33–37, December 2007. [7] N. Binkert, R. Dreslinski, L. Hsu, K. Lim, a.G. Saidi, and S. Reinhardt. The M5 Simulator: Modeling Networked Systems. IEEE Micro, 26(4):52–60, July 2006. [8] R. Crisp. Direct Rambus Technology: The New Main Memory Standard. IEEE Micro, 1997. [9] R. Das, O. Mutlu, T. Moscibroda, and C. R. Das. A´ergia : Exploiting Packet Latency Slack in On-Chip Networks. ISCA ’10: International Symposium on Computer Architecture, 2010. [10] V. Delaluz, M. Kandemir, N. Vijaykrishnan, A. Sivasubramaniam, and M. J. Irwin. Hardware and Software Techniques for Controlling DRAM Power Modes. IEEE Transactions on Computers, 50(11), 2001.
[11] B. Diniz, D. Guedes, W. M. Jr, and R. Bianchini. Limiting the Power Consumption of Main Memory. ISCA ’07: International Symposium on Computer Architecture, 2007. [12] EPA. Report to Congress on Server and Data Center Energy Efficiency Public Law 109-431, 2007. [13] X. Fan, C. Ellis, and A. Lebeck. Memory Controller Policies for DRAM Power Management. In Proceedings of the International Symposium on Low-Power Electronics and Design, August 2001. [14] W. Felter, K. Rajamani, T. Keller, and C. Rusu. A PerformanceConserving Approach for Reducing Peak Power Consumption in Server Systems. ICS ’05: International Conference on Supercomputing, 2005. [15] Google. Going Green at Google, 2010. [16] E. Gorbatov, 2010. Personal communication. [17] M. S. Gupta, G.-Y. Wei, and D. Brooks. System level analysis of fast, per-core DVFS using on-chip switching regulators. HPCA ’08: High Performance Computer Architecture, 2008. [18] H. Hanson and K. Rajamani. What Computer Architects Need to Know About Memory Throttling. WEED ’10: Workshop on EnergyEfficient Design, 2010. [19] S. Herbert and D. Marculescu. Analysis of Dynamic Voltage/Frequency Scaling in Chip-Multiprocessors. ISLPED ’07: International Symposium on Low Power Electronics and Design, 2007. [20] H. Huang, P. Pillai, and K. G. Shin. Design and Implementation of Power-Aware Virtual Memory. In Proceedings of the USENIX Annual Technical Conference, June 2003. [21] Intel. Intel Xeon Processor 5600 Series, 2010. [22] B. Jacob, S. W. Ng, and D. T. Wang. Memory Systems: Cache, DRAM, Disk. Morgan Kaufmann Publishers, 2007. [23] JEDEC. DDR3 SDRAM Standard, 2009. [24] A. R. Lebeck, X. Fan, H. Zeng, and C. Ellis. Power Aware Page Allocation. ASPLOS ’00: Architectural Support for Programming Languages and Operating Systems, 2000. [25] C. Lefurgy, K. Rajamani, F. Rawson, W. Felter, M. Kistler, and T. W. Keller. Energy Management for Commercial Servers. IEEE Computer, 36(12), December 2003. [26] D. Levinthal. Performance Analysis Guide for Intel Core i7 Processor and Intel Xeon 5500 processors, 2009. [27] X. Li, Z. Li, F. M. David, P. Zhou, Y. Zhou, S. V. Adve, and S. Kumar. Performance-directed energy management for main memory and disks. In Proceedings of the 11th International Conference on Architectural Support for Programming Languages and Operating Systems, October 2004. [28] K. Lim, J. Chang, T. Mudge, P. Ranganathan, S. K. Reinhardt, and T. F. Wenisch. Disaggregated Memory for Expansion and Sharing in Blade Servers. ISCA ’09: International Symposium on Computer Architecture, 2009. [29] J. Lin, H. Zheng, Z. Zhu, H. David, and Z. Zhang. Thermal Modeling and Management of DRAM Memory Systems. ISCA ’07: International Symposium on Computer Architecture, 2007. [30] J. Lin, H. Zheng, Z. Zhu, E. Gorbatov, H. David, and Z. Zhang. Software Thermal Management of DRAM Memory for Multicore Systems. SIGMETRICS, pages 337–348, 2008. [31] D. Meisner, B. T. Gold, and T. F. Wenisch. PowerNap: Eliminating Server Idle Power. ASPLOS ’09: Architectural Support for Programming Languages and Operating Systems, Feb. 2009. [32] Micron. 1Gb: x4, x8, x16 DDR3 SDRAM, 2006. [33] Micron. Calculating Memory System Power for DDR3, July 2007. [34] A. Miyoshi, C. Lefurgy, E. V. Hensbergen, R. Rajamony, and R. Rajkumar. Critical Power Slope : Understanding the Runtime Effects of Frequency Scaling. ICS ’02: International Conference on Supercomputing, 2002. [35] J. Moore, J. S. Chase, and P. Ranganathan. Weatherman: Automated, Online and Predictive Thermal Mapping and Management for Data
Centers. ICAC ’06: International Conference on Autonomic Computing, 2006. [36] V. Pandey, W. Jiang, Y. Zhou, and R. Bianchini. DMA-Aware Memory Energy Management. HPCA ’06: High-Performance Computer Architecture, 2006. [37] S. Pelley, D. Meisner, P. Zandevakili, T. F. Wenisch, and J. Underwood. Power Routing : Dynamic Power Provisioning in the Data Center. ASPLOS ’10: Architectural Support for Programming Languages and Operating Systems, 2010. [38] E. Perelman, G. Hamerly, M. V. Biesbrouck, T. Sherwood, and B. Calder. Using SimPoint for Accurate and Efficient Simulation Erez Perelman. SIGMETRICS, 2003. [39] L. Ramos and R. Bianchini. C-Oracle: Predictive thermal management for data centers. HPCA ’08: High Performance Computer Architecture, Feb. 2008. [40] K. Sudan, N. Chatterjee, D. Nellans, M. Awasthi, Rajeev Balasubramonian, and A. Davis. Micro-Pages : Increasing DRAM Efficiency with Locality-Aware Data Placement. ASPLOS ’10: Architectural Support for Programming Languages and Operating Systems, 2010. [41] N. Tolia, Z. Wang, M. Marwah, C. Bash, P. Ranganathan, and X. Zhu. Delivering Energy Proportionality with Non Energy-Proportional Systems Optimizing the Ensemble. HotPower, 2008. [42] D. Tsirogiannis, S. Harizopoulos, and M. A. Shah. Analyzing the energy efficiency of a database server. SIGMOD, 2010. [43] A. N. Udipi, N. Muralimanohar, N. Chatterjee, Rajeev Balasubramonian, A. Davis, and N. P. Jouppi. Rethinking DRAM Design and Organization for Energy-Constrained Multi-Cores. ISCA ’10: International Symposium on Computer Architecture, 2010. [44] H. Zheng, J. Lin, Z. Zhang, E. Gorbatov, H. David, and Z. Zhu. Minirank: Adaptive DRAM architecture for improving memory power efficiency. MICRO ’08: Symposium on Microarchitecture, Nov. 2008. [45] H. Zheng, J. Lin, Z. Zhang, and Z. Zhu. Decoupled DIMM : Building High-Bandwidth Memory System Using Low-Speed DRAM Devices. ISCA ’09: International Symposium on Computer Architecture, 2009.