PROCEEDINGS of the Second International Driving Symposium on Human Factors in Driver Assessment, Training and Vehicle Design
MENTAL WORKLOAD AS A FUNCTION OF TRAFFIC DENSITY: COMPARISON OF PHYSIOLOGICAL, BEHAVIORAL, AND SUBJECTIVE INDICES Carryl L. Baldwin and Joseph T. Coyne Department of Psychology Old Dominion University Norfolk, VA USA E-mail:
[email protected] Summary: High traffic density can be expected to increase the attentional processing requirements of driving. Establishing methods of assessing the differential demands placed on drivers by environmental variables has been the focus of a recent series of investigations. Results of an initial examination of the impact of traffic density on mental workload are reported here. The current investigation utilizes an array of methodological assessment techniques and compares the sensitivity of each to changes in attentional processing requirements as a function of driving task demand. Analogous versions of a visual and auditory sensory detection task were developed and used in a dual task paradigm involving simulated driving. P300 amplitude, though in the predicted direction, failed to distinguish between increased task demands resulting from increases in traffic density. Response time and accuracy to the detection task in both visual and auditory modalities demonstrated significant processing decrements as a function of increased traffic density. Subjective workload ratings obtained from the NASA TLX did not distinguish between driving task difficulty, but indicated that performing the visual detection task in combination with driving was perceived as more difficult than performing the concurrent auditory task. Implications of these results for modeling differential aspects of mental workload and for establishing workload assessment techniques for surface transportation environments are discussed. INTRODUCTION Driving an automobile involves extreme fluctuations in mental workload. Attentional processing demands are placed on the driver both from outside the vehicle (i.e., traffic density and visibility) and within the vehicle (i.e., mobile phones and invehicle displays). With the wide variety of demands placed on the driver, it is perhaps not surprising that driver inattention has been cited as a major contributing cause of crashes on U.S. roadways. Knipling et al. (1993) estimated that driver inattention contributed to roughly 60% of automobile crashes. The recent proliferation of new in-vehicle devices, which range from collision avoidance systems and navigational devices to high tech infotainment devices, further expand the array of potential sources of competition for the drivers’ limited attentional resource capacity. Establishing methods of assessing fluctuations in mental workload that are sensitive to the various aspects of attentional processing requirements in relation to both external environmental conditions, such as traffic density, as well as invehicle conditions, such as competing visual and auditory displays, are urgently needed. The current investigation represents one in a series aimed at establishing such an assessment methodology. The present study is an initial comparison of the sensitivity and intrusiveness of analogous auditory and visual sensory detection tasks.
19
PROCEEDINGS of the Second International Driving Symposium on Human Factors in Driver Assessment, Training and Vehicle Design
Mental Workload Assessment The methods of assessing mental workload are perhaps as multifaceted as the various terms used to define it. It is not within the scope of the current paper to present yet another definition, but rather simply to point out that mental workload is comprised of different aspects. These aspects include neurophysiological processes, as well as perceptual and cognitive processes. Physiological, behavioral and subjective indices can be expected to assess different aspects of mental workload stemming from potentially different sources (i.e., situational and internal demands). For example, ERP components such as the P300 may be sensitive to the perceptual aspects of stimulus evaluation in a particular task (i.e., intensity, contrast) but relatively insensitive to response characteristics (Coles, Smid, Scheffers, & Otten, 1995), while response time (RT) can be expected to sensitive to both aspects. Stimulus intensity and target probability have previously been demonstrated to increase P300 amplitude in both auditory and visual oddball sensory detection paradigms (Polich, Ellerson, & Cohen, 1996). Conversely, Kramer et al. (1987), found that performance data (RT, accuracy) generated by an auditory detection task were not sensitive to changes in simulated flight task difficulty; however, peak amplitude for the P300 component was sensitive to manipulations in flight task difficulty. If sensitive to external task demands, ERP components have the potential advantage of not requiring an overt response by the participant (Mangun & Hillyard, 1995). However, both ERP components and performance measures may fail to assess the operators’ internal perception of workload. Subjective assessment techniques provide a window into internal sources of workload. Task relevant internal aspects are captured in a definition provided by Hancock and Caird (Hancock & Caird, 1993) in which workload is conceptualized as having three dimensions. The three dimensions include: 1) time for action; 2) perceived distance from the desired goal; and 3) the level of effort required to achieve the desired goal. According to this model then, mental workload increases as the distance to the goal and time constraints increase. The current investigation examines the sensitivity of physiological, behavioral, and subjective measures to differential task demands. A dual task paradigm involving a visual and auditory detection task was performed in conjunction with simulated driving. The detection task required participants to discriminate between two stimuli of different probability. Mental workload was assessed using physiological, behavioral, and subjective indices. The physiological measure included analysis of ERP components, namely P300 amplitude to target stimuli in the detection task and behavioral measures included RT and accuracy to targets. Subjective assessment of workload was obtained from responses on the NASA Task Load Index (NASA TLX). It was predicted that P300 amplitude would be greater for target versus distracter stimuli in the sensory detection task, but that this amplitude differential would decrease as the mental workload of the driving task increased due to increased traffic density. It was further predicted detection accuracy would decrease and RT would increase and that participants would rate the task as more difficult on the NASA TLX as traffic density increased.
20
PROCEEDINGS of the Second International Driving Symposium on Human Factors in Driver Assessment, Training and Vehicle Design
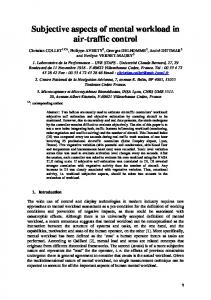
METHODS Participants Seven participants from the university subject pool volunteered for this investigation. Participants ranged in age from 18-40. All were licensed drivers and reported normal hearing and visual abilities. Simulator and Stimulus Generation Apparatus The General Electric Capital I-Sim@ was used to present the simulated driving task. As illustrated in Figure 1, the simulator is equipped with a full set of operational controls, including steering wheel, brake and accelerator pedals, as well as lights, turn signal indicators, etc. The side screens allow presentation of a 180 horizontal field of view. Side rearview mirrors allow the driver to monitor traffic from all directions. Figure 1. GE Capitol I-sim Driving Simulator
Driving Scenarios Four urban roadway scenarios consisting of two levels of traffic density, low and moderate were presented. Each scenario lasted approximately 5 minutes. Sensory Detection Tasks Visual detection. For the visual detection task, a color was briefly presented on the entire 15-inch viewable area of a laptop computer located to the right of the participant as he/she was seated in the driver seat (refer to Figure 1). The distractor color, green, was presented 70% of the time and the target color, red, was presented the remaining 30% of the time at a rate of 1 per 1700 ms for a duration of 50 ms. Participants were instructed to indicate the presence of the target (red) color by pressing a response button. Auditory detection. The auditory detection task utilized the same response mode and timing parameters as the visual oddball paradigm. However, instead of a color, a 1500 Hz distractor tone was presented 70% of the time and a 1000 Hz target tone was presented 30% of the time. Auditory stimuli were presented at 65 dB from two stereo speakers, with one located on the floor board of the simulated vehicle directly to the right of the accelerator pedal and the other located directly to the left of the brake pedal. ERP Recording Equipment Electroencephalographic (EEG) activity was recorded from three sites (Fz, Cz, and Pz according to the International 10/20 system) and linked mastoids were used as references. Electroocular activity recorded from electrodes placed above and below the left eye was evaluated and used to edit ocular artifacts from the EEG data file. Electrode impedances were maintained below 5 kohms. A NuAmps amplifier system in conjunction with Neuroscan 4.0 software was used for data collection and analysis.
21
PROCEEDINGS of the Second International Driving Symposium on Human Factors in Driver Assessment, Training and Vehicle Design
Procedure Participants completed an orientation scenario to acquaint them with the controls and handling characteristics of the simulated vehicle. They were then given practice on the driving task by itself, followed by both versions of the detection tasks alone, and finally practice performing both tasks concurrently. Following the completion of all practice trials, participants completed the experimental blocks in counterbalanced order. Baseline trials of each of the detection tasks were included at the beginning and end of the dual task trials and baseline driving trials (driving only trials) of both low traffic density and moderate traffic density scenarios were included in the counterbalanced experimental blocks. The entire experimental paradigm lasted approximately two hours. RESULTS Secondary Detection Task Event-related potentials. The primary focus of the ERP analysis was amplitude of the P300 component. The P300 is characterized by a large positive deflection that peaks between 300 to 500 ms. Peak amplitude was defined as the largest positive deflection between this range. A 2 (event type: target, distracter) by 3 (electrode site: Fz, Cz, Pz) by 2 (ERP task modality: visual, auditory) repeated measures ANOVA design was used to analyze the P300 amplitude data. ERP detection task baseline trials-P300 amplitude. A significant main effect for event type (targets versus distracters) during baseline (ERP detection task only) trials was observed F(1,6) = 14.761, p < .05. P300 amplitude to target events was significantly larger than to distractor events for both the visual and auditory baseline trials. Means are presented in Figure 2. Main effects for modality and site were not significant and there were no significant interactions for P300 amplitude. ERP detection task workload Index-P300 Amplitude. P300 amplitude for target 14 stimuli at midline central and parietal 12 sites (Cz and Pz) were examined as an 10 index of mental workload of driving 8 difficulty in low versus moderate traffic µV Distracter density. P300 amplitude in this paradigm 6 Target was not sensitive to increased task load 4 resulting from addition of the driving 2 task, nor increased traffic density. The 0 main effect for task load as measured by Fz Cz Pz Fz Cz Pz P300 amplitude was not significant, Vi sua l T a sk A ud i t o r y T a sk F(2,6) = .135, p > .05. However, the means were generally in the expected Figure 2. P300 Amplitude for Targets and direction indicating a decrease in Distracters at Each Site amplitude as traffic density increased. Mean P300 amplitude for the visual detection task were 12.19, 12.35, and 10.28 at site Cz and 12.93, 11.96, and 9.27 at Pz for the no driving, low density and moderate density conditions,
22
PROCEEDINGS of the Second International Driving Symposium on Human Factors in Driver Assessment, Training and Vehicle Design
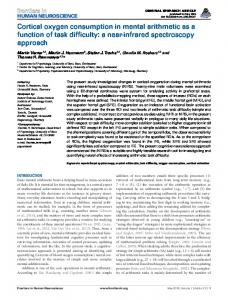
respectively. Mean P300 amplitude for the auditory detection task were 10.67, 9.03, and 15.48 at site Cz and 10.87, 6.77, and 10.90 at Pz for the no driving, low density and moderate density conditions, respectively. It should be pointed out that due to random data loss from individual cells, only 4 participants could be included in this analysis and this, coupled with high individual variability, resulted in very low statistical power. Secondary task performance. Accuracy and response time (RT) measures were recorded for the ERP detection task. A 2 modality (visual and auditory) by 3 task load (baseline detection only, low traffic density, high traffic density) design was used. There was a significant main effect for task load (traffic density) for both accuracy and RT to the detection task, F(2,12) = 6.88, 1 p < .05 and F(2,12) =13.02, p < .05, %0.9 respectively. Figure 3 presents the mean 0.8 accuracy for each task load condition. Tests C 0.7 of within-subjects contrasts indicated that o 0.6 accuracy decreased significantly as task load r 0.5 Auditory r 0.4 increased from no driving conditions Visual e 0.3 (detection task only) to low and high traffic c 0.2 density conditions. RT revealed a similar t 0.1 pattern demonstrating that RT increased 0 NoDriving Low High significantly as task load increased from no driving conditions (detection task only) to TrafficDensity low and high traffic density conditions. Figure 3. Mean Detection Task Accuracy as a Mean RT is presented in Figure 4. There was Function of Traffic Density no significant main effect of modality on accuracy, F(1,4) = 3.36, p > .05, nor for response time, F(1,4) = .65, p > .05. Subjective workload. Participants completed a computerized version of the NASA Task Load Index (TLX) at the end of each experimental condition. The unweighted average of the six TLX dimensions was analyzed. Average TLX ratings were analyzed using a 3 task type (driving only, driving/auditory detection task, driving/visual detection task) by 2 traffic density (low, moderate) repeated measures ANOVA. A significant main effect was observed for detection task, F(2,10) = 17.74, p < .05. Tests of within subjects contrasts indicated that the driving only conditions were rated as significantly less difficult than the dual task driving and detection task conditions, F(1,5) = 20.59, p < .05. The driving and visual detection task conditions were rated as significantly more difficult than both the driving only and driving and auditory detection task 600 combination, F(1,5) = 14.734, p < .05. 500 R T 400
DISCUSSION
i 300 n
Auditory
m 200 s
Visual
100 0 No Driving
Low
High
Traffic Density
Three methods of assessing mental workload— specifically, a physiological ERP component (P300 amplitude), behavioral performance measures (accuracy and RT) and a subjective workload rating scale (NASA TLX)—were compared in the present investigation. The
Figure 4. Detection Task RT as a Function of Traffic Density 23
PROCEEDINGS of the Second International Driving Symposium on Human Factors in Driver Assessment, Training and Vehicle Design
current investigation presents initial evidence for the feasibility of using analogous visual and auditory versions of a sensory detection task to assess mental workload in an operational environment such as driving or flying. Analogous versions were created in an effort to develop a methodology of comparing the mental demands of secondary visual and auditory displays. Driving a vehicle, much like piloting an airplane, places heavy demands on visual processing. Many new in-vehicle technologies propose to add additional visual displays and or auditory displays. For example, collision avoidance system warnings can be presented in either visual or auditory format. The same is true for in-vehicle routing and navigational displays. Examining the effectiveness and safety of each format will demand a method of comparing mental workload across modalities. Results of the current investigation provide initial support for the use of analogous visual and auditory detection tasks for assessing workload across modalities. P300 amplitude differed significantly between target and distracter stimuli, but did not differ as a function of the modality used to present the detection task. Measures of RT and accuracy were sensitive to the increased demands of driving through moderate versus low density traffic. Importantly, however, no significant differences for RT and accuracy were observed as a function of the detection task modality. The only dependent measure that indicated a difference in mental demand as a function of the modality of the detection task was the subjective assessment as indicated on the NASA TLX. As indicated, P300 amplitude was not sensitive to the demands of traffic density. Methodological issues of low statistical power most likely contributed to the observed insensitivity of this measure and further investigations are currently being conducted to examine this issue. Results of the current investigation underscores the importance of using a variety of assessment techniques each aimed at examining a different aspect of mental workload. REFERENCES Coles, M. G., Smid, H. G. O. M., Scheffers, M. K., & Otten, L. J. (1995). Mental Chronometry and the study of human information processing. In M. G. Coles (Ed.), Electrophysiology of the Mind: Event-related brain potentials and cognition. (pp. 86-131). Oxford: Oxford University Press. Hancock, P. A., & Caird, J. K. (1993). Experimental evaluation of a model of mental workload. Human Factors, 35(3), 413-429. Kramer, A. F., Sirevaag, E. J., & Braune, R. (1987). A psychophysiological assessment of operator workload during simulated flight missions. Human Factors, 29, 145-160. Mangun, G. R., & Hillyard, S. A. (1995). Mechanisms and models of selective attention. In M. G. Coles (Ed.), Electrophysiology of the Mind: Event-related Brain Potentials and Cognition (No. 25 ed., pp. p. 40-85). Oxford: Oxford University Press. Polich, J., Ellerson, P. C., & Cohen, J. (1996). P300, stimulus intensity, modality, and probability. International Journal of Psychophysiology, 23(1-2), 55-62.
24