May 31, 2008 - Keywords: Data Ranking Algorithms, Computational Grids, Failures, .... could malfunction due to hardware failures (e.g., hard drive burns,.
May 31, 2008
Parallel Processing Letters c World Scientific Publishing Company
Metadata Ranking and Pruning for Failure Detection in Grids
∗
Demetrios Zeinalipour-Yazti Pure and Applied Science, Open University of Cyprus, 1304, Nicosia, Cyprus Harris Papadakis Institute of Computer Science, Foundation of Research and Technology - Hellas, Heraklion, Greece Chryssis Georgiou, Marios D. Dikaiakos Department of Computer Science, University of Cyprus, 1678, Nicosia, Cyprus
ABSTRACT The objective of Grid computing is to make processing power as accessible and easy to use as electricity and water. The last decade has seen an unprecedented growth in Grid infrastructures which nowadays enables large-scale deployment of applications in the scientific computation domain. One of the main challenges in realizing the full potential of Grids is making these systems dependable. In this paper we present FailRank, a novel framework for integrating and ranking information sources that characterize failures in a grid system. After the failing sites have been ranked, these can be eliminated from the job scheduling resource pool yielding in that way a more predictable, dependable and adaptive infrastructure. We also present the tools we developed towards evaluating the FailRank framework. In particular, we present the FailBase Repository which is a 38GB corpus of state information that characterizes the EGEE Grid for one month in 2007. Such a corpus paves the way for the community to systematically uncover new, previously unknown patterns and rules between the multitudes of parameters that can contribute to failures in a Grid environment. Additionally, we present an experimental evaluation study of the FailRank system over 30 days which shows that our framework identifies failures in 93% of the cases and can achieve this by only fetching 65% of the available information sources. We believe that our work constitutes another important step towards realizing adaptive Grid computing systems. Keywords: Data Ranking Algorithms, Computational Grids, Failures, Scheduling
1. Introduction Grids have emerged as wide-scale, distributed infrastructures that comprise heterogeneous computing and storage resources, operating over open standards and ∗ This
work is supported in part by the European Union under projects CoreGRID (# IST-2002004265) and EGEE (#IST-2003-508833). A Preliminary version of this paper has appeared in [32] and [33]. The second author was supported by a CoreGRID REP Fellowship during 2008. 1
May 31, 2008
2
Parallel Processing Letters
distributed administration control [13, 14]. Grids are quickly gaining popularity, especially in the scientific sector, where projects like EGEE (Enabling Grids for E-sciencE) [8], TeraGrid [25] and Open Science Grid [23] , provide the infrastructure that accommodates large experiments with thousands of scientists, tens of thousands of computers, trillions of commands per second and petabytes of storage [8, 25, 23]. At the time of writing, EGEE assembles over 250 sites around the world with more than 30,000 CPUs and 18PB of storage, running over 25,000 concurrent jobs and supporting over 100 Virtual Organizations. While the aforementioned discussion shows that Grid Computing will play a vital role in many different scientific domains, realizing its full potential will require to make these infrastructures dependable. As a measure of dependability of grids we use the ratio of successfully fulfilled job requests over the total number of jobs submitted to the resource brokers of a grid infrastructure. The FlexX and Autodock data challenges of the WISDOM [30] project, conducted in August 2005, have shown that only 32% and 57% of the jobs completed successfully (with an ”OK” status). Additionally, our group conducted a nine-month characterization of the South-Eastern-Europe resource broker (rb101.grid.ucy.ac.cy) in [6] and showed that only 48% of the submitted jobs completed successfully. Consequently, the dependability of large-scale grids needs to be improved substantially. Detecting and managing failures is an important step toward the goal of a dependable grid. Currently, this is an extremely complex task that relies on overprovisioning of resources, ad-hoc monitoring and user intervention. Adapting ideas from other contexts such as cluster computing [21], Internet services [19, 20] and software systems [22] seems also difficult due to the intrinsic characteristics of grid environments. Firstly, a grid system is not administered centrally; thus it is hard to access the remote sites in order to monitor failures. Moreover we cannot easily encapsulate failure feedback mechanisms in the application logic of each individual grid software, as the grid is an amalgam of pre-existing software libraries, services and components with no centralized control. Secondly, these systems are extremely large; thus, it is difficult to acquire and analyze failure feedback at a fine granularity. Lastly, identifying the overall state of the system and excluding the sites with the highest potential for causing failures from the job scheduling process, can be much more efficient than identifying many individual failures. Of course the latter information will be essential to identify the root cause of a failure [20], but this operation can be performed in a offline phase, and thus it is complementary to our framework. In the FailRank architecture, feedback sources (i.e., websites, representative lowlevel measurements, data from the Information Index, etc.) are continuously coalesced into a representative array of numeric vectors, the FailShot Matrix (FSM). FSM is then continuously ranked in order to identify the K sites with the highest potential to feature some failure. This allows the system to automatically exclude the respective sites from the job scheduling process.
May 31, 2008
Metadata Ranking and Pruning for Failure Detection in Grids
3
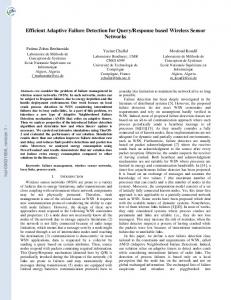
The advantages of our approach are summarized as follows: (i) FailRank is a simple yet powerful framework to integrate and quantify the multi-dimensional parameters that affect failures in a grid system; (ii) our system is tunable, allowing system administrators to drive the ranking process through user-defined ranking functions; (iii) we eliminate the need for human intervention, thus our approach gives space for automated exploitation of the extracted failure semantics; (iv) we expect that the FailRank logic will be implemented as a filter outside the Grid job scheduler (i.e., Resource Broker or Workload Management System), thus imposing minimum changes to the Grid infrastructure. 2. Background on Grid Computing In this section we will describe the anatomy of a Grid system and detail all the components pertinent to the operation of a Grid site. In particular, we will focus on Grid computing in the context of the EGEE project although other architectures feature a similar framework. We also describe the main causes of unsuccessful job executions in a grid system. 2.1. The Anatomy of a Grid A Grid interconnects a number of remote clusters, or sites. Each site features heterogeneous resources (hardware and software) and the sites are interconnected over an open network such as the Internet. Figure 1 illustrates the anatomy of a typical grid (rectangles represent hardware while ellipses the services). The figure shows how sites with different capabilities and capacities are contributing their resources to the Grid infrastructure. In particular, each site features one or more Worker Nodes, which are usually rack-mounted PCs. The Computing Element shown in the same figure runs various services responsible for authenticating users, accepting jobs, performing resource management and job scheduling. Additionally, each site might feature a Local Storage site, on which temporary computation results can reside, and local Software libraries, that can be utilized by executing processes. The Grid middleware is the component that glues together local resources and services and exposes high-level programming and communication functionalities to application programmers and end-users. For instance EGEE uses the gLite middleware [16], while NSF’s TeraGrid is based on the Globus Toolkit [15]. A Grid system also features some global services which are described in the next subsection. 2.2. Lifecycle of Grid Jobs A Grid job, or computation, consists of a set of input files that defines the elements of a given computation (code, custom libraries, input files, etc). Grid jobs can be classified as CPU-intensive and data-intensive, depending on the type of work performed. For clarity we divide the lifecycle of a grid job into the following three conceptual phases:
May 31, 2008
4
Parallel Processing Letters
U
I
n
f
o
r
m
a
t
i
o
s
e
r
R
e
p
l
i
c
l
o
a
n e
u
r
s
I
n
t
e
r
f
a
c
C
e
a
t
a
g
R S
e
r
v
i
c
e
s
o
u
r
c
e
e
B
W
i
M
d
e
o
�
n
i
a
o
r
r
e
a
N
e
t
w
o
r
r
o
k
e
r
k
.
t
A
g
n
e
M
t
o
n
f
r t
w
a
m
p
u
t
i
n
l
e
m
e
n
g
r
.
n
e
t
g o
S
E
o
e
A
o
i t
o
S
C
f
C
r t
w
o
m
t
o
r
a
g
o
m
p
u
t
i
n
S
l
e
m
e
n
l
e
m
e
n
t
e
r
e
r
o
r
a
g
e
m
i
e
n
n
g
M
o
t
l
e
m
e
n
o
r
k
e
r
e
r
o
S
o
d
N
W t
o
r
a
g
k
o
r
k
e
o
d
o
d
o
d
t
o
r
a
g
d
e
o
N
o
N
k
e
o
r
k
e
o
r
i
d
S
i
t
d
r t
r
i
d
w
a
S
e
r
o
k
d
e
r
e
r
o
d
i
t
e
e
e
o
r
k
e N
o
G
r
G
N
f
e
k
e
W
W
d
r
r
N
d
o
e
e
e
r
o
.
t
e
W
o
N
r
n
r
W
N
N
o
e
S r
N
W
i
e
e
S
o
g
t
W
N
W
n
A
e
t
t
E
k
l
g
e
E
r
t
t
E
C
S
o
u
t
E
W
p
e
a
e
Fig. 1.
o
d
e
G
r
i
d
S
i
t
e
The Anatomy of a GRID Infrastructure.
(i) Assignment Phase: Jobs are submitted to a Grid by users through some authenticated remote workstation, denoted as the User Interface (UI). Besides obtaining the output from completed jobs, the UI might also provide supplementary functionality for requesting the status of a job and the status of resources in the system. Jobs submitted to the UI are directed to some Resource Broker (RB), a central global grid service that performs matching between requests and available resources using the matchmaking approach [24]. Being able to quickly identify failures, would obviously be very helpful information to the RB as it would be able to avoid bottlenecks and resources leading to errors. Although this is not currently possible, our work sets the foundation towards this goal. The matchmaking performed by the RB is based on the information provided by another central service, the Information Index, which provides information about the state of grid resources. If the matchmaking is successful, the job is sent to the respective computing elements for execution. (ii) Execution Phase: During job execution, if any input files are necessary, these have to be pushed to a remote grid site at runtime. Alternatively these files could have been pushed to the grid site during the assignment phase. In both occasions, a service called the Replica Catalog maintains the location of various replicas of a file held in remote Storage Elements. (iii) Completion Phase: When the job completes successfully, the user is informed through the User Interface with a set of output files that are a superset of the command line outputs, had the job run on a standalone computer. Although the user will be notified in the event of a failure, there is no indication about the possible cause. 2.3. Causes of Failures In this section we identify the main causes of failures in Grid infrastructures. These observations are extrapolated from the experiences we acquired by operating an
May 31, 2008
Metadata Ranking and Pruning for Failure Detection in Grids
5
EGEE grid site that consists of: (i) a Regional Resource Broker (3.6GHz/1GB RAM), (ii) a Regional Information Service which features the same aforementioned characteristics, (iii) a 72 CPU cluster of Worker Nodes which utilizes a blend of 2.6GHz AMD Opteron and 2.8GHz Xeon CPUs, and (iv) a Storage Element which features 4x250GB disk space in RAID 5. Our analysis takes into account 37,860 job submissions (≈19K normalized CPU hours), between March 2005 and June 2006. We combine our observations with others obtained by fellow-researchers [30, 18] to conclude the following: Grid component failures: One or more of the components involved in the Grid infrastructure could malfunction due to hardware failures (e.g., hard drive burns, RAM or motherboard failures, power supply failures and overheating) and software faults (e.g., O/S mis-configurations and middleware bugs). Such problems may result to a total collapse of a component (crash failure) or to a component becoming partially unresponsive or extremely slow. Network failures: Network links could cause permanent or transient network disconnections leading to a loss, corruption or delay of messages and data transfers. Network disconnections may result to total inaccessibility of a Grid component, a condition that is equivalent to a crash failure of that component. Network access mis-configuration (firewall changes or updates) lead to the same effect. Information faults: The information provided by the Grid Information Service, which provides state information about the distributed grid sites, may be erroneous or obsolete due to administrator errors, software faults, and network delays. As a result, the Resource Broker, a central service that performs matching between resources and requests based on this information, may take sub-optimal decisions that result to excessive delays in job processing or even to failures in job execution. Excessive delays: In the large, shared and dynamic Grid infrastructure, unusual workload conditions, like those triggered by flash crowds and denial of service attacks, may lead to long queuing delays in Computing or Storage Elements, to reduced Grid service throughput, and to long network delays in data transfers. Such conditions may result to job turnaround times that are substantially longer than those expected by Grid users. A similar effect may arise also because of the heterogeneity of the Grid: jobs may end-up being executed on very slow resources, resulting to unacceptably slow execution times. Because of the resource virtualization imposed by many Grids, end-users have limited control over the performance characteristics of resources allocated to their jobs. 3. Monitoring Failures in a Grid Environment In this subsection we overview typical failure feedback sources provided in a grid environment. These sources contain information that is utilized by our system in order to deduct, in an a priori manner, the failing sites. Our discussion is in the context of the EGEE infrastructure, but similar tools and sources exist in other grids [25, 23]. Meta-information sources: Several methods for detecting failures have been de-
May 31, 2008
6
Parallel Processing Letters
ployed so far. Examples include (for a detailed description see [27]): (i) Information Index Queries: these are performed on the Information Service and enable the extraction of fine-grained information regarding the complete status of a grid site; (ii) Service Availability Monitoring (SAM) [31]: a reporting web site that is maintained for publishing periodic test-job results for all sites of the infrastructure; (iii) Grid statistics: provided by services such as GStat [17]; (iv) Network Tomography Data: these can be obtained by actively pinging and tracerouting other hosts in order to obtain delay, loss and topological structure information. Network tomography enables the extraction of network-related failures; (v) Global Grid User Support (GGUS) ticketing system [9]: system administrators use this system to report component failures as well as needed updates for sites. Such tickets are typically opened due to errors appearing in the SAM reports; (vi) Core Infrastructure Center (CIC) broadcasts [5]: allow site managers to report site downtime events to all affected parties through a web-based interface; and (vii) Machine log-files: administrators can use these files to extract error information that is automatically maintained by each grid node. Active benchmarking: Deploying a number of lower level probes to the remote sites is another direction towards the extraction of meaningful failure semantics. In particular, one can utilize tools such as GridBench [26, 28], the Grid Assessment Probes [4] and DiPerF [7], in order to determine in real time the value of certain low level and application-level failure semantics that can not be furnished by the meta-information sources. For example, the GridBench tool developed by our group provides a corpus of over 20 benchmarks that can be used to evaluate and rank the performance of Grid sites and individual Grid nodes. Both the Meta-Information Sources and the Active Benchmarking approaches have a major drawback: their operation relies heavily on human intervention. As Grid infrastructures become larger, human intervention becomes less feasible and efficient. As we would like Grid Dependability to be scalable, our proposed architecture does not rely on human intervention but instead provides the means for acquiring and analyzing the data from the above resources in an automated manner. 4. The FailRank System In this section we describe the underlying structure that supports the FailRank system. We start out with an architecture overview and then proceed with basic definitions in order to formalize our description. We follow with the description of the failure ranking mechanism deployed in FailRank. 4.1. Architecture Overview The FailRank architecture (see Figure 2), consists of four major components: (i) a FailShot Matrix (FSM), which is a compact representation of the parameters that contribute to failures, as these are furnished by the feedback sources; (ii) a temporal sequence of FSMs defines an FSM timeseries which is stored on local disk; (iii) a
May 31, 2008
Metadata Ranking and Pruning for Failure Detection in Grids
Grid Sites
Feedback Sources
FailRank Architecture FSM
Top-K Ranking Module
Data Exploration Tools
FSM Timeseries (Storage)
7
R e s u l t s
The FailRank System Architecture: Feedback sources are continuously coalesced into a representative array of numeric vectors, the FailShot Matrix (FSM). FSM is then continuously ranked in order to identify the K sites with the highest potential to feature some failure.
Fig. 2.
Top-K Ranking Module which continuously ranks the FSM matrix and identifies the K sites with the highest potential to run into a failure using a user defined scoring function; and (iv) a set of data exploration tools which allow the extraction of failure trends, similarities, enable learning and prediction. FailRank is tunable because it allows system administrators and domain experts to drive the ranking process through the provisioning of custom scoring functions. 4.2. Definitions and System Model In this section we will provide some definitions and our system model upon which we will structure our presentation in the subsequent sections. Definition 1 (FailShot Matrix (FSM)): Let S denote a set of n grid sites (i.e., S = {s1 , s2 , ..., sn }). Also assume that each element in S is characterized by a set of m attributes (i.e., A = {a1 , a2 , ..., am }). These attributes are obtained by the feedback sources described in Section 3. The rows in Table 1 represent the sites while the columns represent the respective attributes. The j th attribute of the ith site is denoted as sij . The j-th attribute specifies a rating (or score) which characterizes some grid site si (i ≤ n) at a given time moment. These ratings are extracted by custom-implemented parsers, which map the respective information to real numerical values in the range [0..1] (1 denotes a higher possibility towards failure). The m × n table of scores defines the FailShot Matrix (FSM), while a Site Vector is any of the n rows of FSM. A graphical illustration for some synthetic example is given in Table 1. The figure shows five sites {s1 , ..., s5 } where each site is characterized by five attributes: CPU (% of CPU units utilized), DISK (% of storage occupied), QUEUE (% of job queue occupied), NET (% of dropped network packets) and FAIL (% of jobs that don’t complete with an ”OK” status). Definition 2 (FSM Timeseries): A temporal sequence of l FailShot Matrices defines an FSM Timeseries of order l. Keeping a history of the failure state for various prior time instances is important
May 31, 2008
8
Parallel Processing Letters
as it enables the automatic post-analysis of the dimensions that contributed to a given failure, enables the prediction of failures and others (Section 7 provides an overview). It is important to notice that the FSM timeseries can be stored incrementally in order to reduce the amount of storage required to keep the matrix on disk. Nevertheless, even the most naive storage plan of storing each FSM in its entirety, is still much more storage efficient than keeping the raw html/text sources provided by the feedback sources. In constructing FailBase, described in Section 5, we found that the FSM representation saves us approximately 350GB of storage per month. 4.3. The Ranking Module Although the snapshot of site vectors in FSM greatly simplifies the representation of information coming from different sources, observing individually hundreds of parameters in real time in order to identify the sites that are running into trouble is still a difficult task. For example a typical LDAP query to the Grid Information Service returns around 200 attributes. Monitoring these parameters in separation is a cumbersome process that is very expensive in terms of human resources, can rarely lead to any sort of a priori decision-making and is extremely prone to mistakes and human omissions. Instead, automatically deducting the sites with the highest potential to suffer from failures is much more practical and useful. Since this information will be manipulated in high frequencies, we focus on computing the K sites with the highest potential to suffer from failures rather than finding all of them (K is a user-defined parameter). Therefore we don’t have to manipulate the whole universe of answers but only the K most important answers, quickly and efficiently. The answer will allow the Resource Broker to automatically and dynamically divert job submissions away from sites running into problems as well as notify administrators in advance (compared to SAM & tickets) to take preventive measures for the sites more prone to failures. Finally, we developed a mechanism for selective extraction of monitoring information for selecting those K sites, which we describe later on. This mechanism is capable of reducing the information we need to fetch and process by approximately one third. Scoring Function: In order to rank sites we utilize some aggregate scoring function which is provided by the user (or system administrator). For ease of exposition we use, similarly to [2], the function: Score(si ) =
m X
wj ∗ sij
(1)
j=1
where sij denotes the score for the j th attribute of the ith site and wj (wj > 0) a weight factor which calibrates the significance of each attribute according to the user preferences. For example if the CPU load is more significant than the DISK load, then the former parameter is given a higher weight . Should we need to capture more complex interactions between different dimensions of FSM we could
May 31, 2008
Metadata Ranking and Pruning for Failure Detection in Grids
9
construct, with the help of a domain expert, a custom scoring function or we could train such a function automatically using historic information (Section 6.3 conducts an evaluation of this parameter). It is expected that the scoring function will be much more complex in a real setting (e.g., a linear combination of averages over n′ correlated attributes, where n′