VisMeB has a client-server architecture implemented in. Java (see ... system provides a dedicated server for storing user-, ses- sion- and .... rent context. It eases ...
Metadata Visualization with VisMeB Peter Klein, Frank Müller, Harald Reiterer, Tobias Limbach University of Konstanz, Department of Computer & Information Science, Universitätsstr. 10, 78457 Konstanz, Germany {peter.klein, frank.mueller, harald.reiterer, tobias.limbach}@uni-konstanz.de Abstract This paper presents a new framework for Metadata Visualization Systems called VisMeB (Visual Metadata Browser). It is based upon redesign ideas from the INSYDER1 System that were come under extensive evaluations. The aim of our approach is to improve the process of finding relevant information in an intuitive yet multifunctional way. We use a ScatterPlot in combination with a so called SuperTable for visualization. The two techniques are tightly coupled and present unique possibilities of interaction through the use of visual filters.
1. Introduction The goals of the research project VisMeB (Visual Metadata Browser) presented in this paper are to support users in finding relevant data and to enhance the possibilities of browsing and filtering an information space (e.g. digital library, web, geodata base, movie data base). To achieve these goals, our system makes use of different visualizations. Our thesis is, that users will benefit in terms of effectiveness, efficiency and satisfaction[15] from our Visual Metadata Browser compared with common list or table-based presentations. This thesis is not undisputed, as our own work has shown (see [5], where a traditional result list presentation beats the visualizations in usability tests (n=40)). First we assume that users will use our system on a regular basis and therefore a training period for the visualizations will be expected to them. Then based on our experience (see [5]) we have tried to integrate our different visualizations very smoothly in a common tabular visualization. Finally our visualizations cover the whole information retrieval process beginning at the query stage and ending at the relevance feedback. The main ideas of developing our visual information retrieval system VisMeB, using different visualizations and interaction techniques, are presented. VisMeB is engineered in the framework of the EC-funded project INVISIP2. After this introduction, [Chapter 2] will give a short overview of the system. The query stage with a Query Preview [2] will be presented in [Chapter 3]. We 1
Internet Système de Recherche – ESPRIT project #29232 – Information Visualization for Site Planning, funded by EC, Project No. IST-2000-29640, www.invisip.de
2INVISIP
will focus on the different visualization and interaction techniques we used, combining the two visualizations SuperTable and ScatterPlot in [Chapter 4]. [Chapter 5] gives a brief summary of our evaluation studies. The related work that has influenced our own will be presented in [Chapter 6]. Conclusions and outlook are given in [Chapter 7].
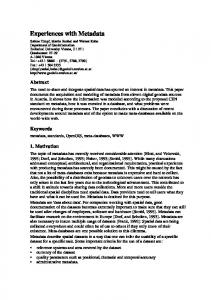
2. Architecture of VisMeB VisMeB has a client-server architecture implemented in Java (see Fig. 1). The visual metadata browser can work as an application or an applet within a Web browser. The system provides a dedicated server for storing user-, session- and configuration data (in a postgres database system). So it shares all advantages of a classic terminal application (e.g. stop your work on your laptop and continue with the same session at your workstation in the office).
Figure 1: Architecture of VisMeB showing three possible (and available) application domains: A movie database, the INVISIP geodata base and a snapshot of a small part of the WWW concerning GIS (Geo Information Systems).
Especially regarding the site planning process, which is probably not only done in an office but partly in the specific location (e.g. with mobile devices), this part seemed important to us. A visual assistance to formulate the query is given with a domain specific query form with query preview functionality. Access to different metadata bases leads to the display of search results in table and
plot based visualizations. Both visualizations have their interactions synchronized. Keeping the experience with a preceding project called INSYDER in mind, VisMeB was kept generic and can be used in various fields of application. The sophisticated data model allows easy adaptation to domain specific needs. The client consists of the query processor / query preview and our result visualizations. Each visualization is tightly coupled [14] to the other. We implemented a visual configuration editor to easily adopt VisMeB to different data sources. This configuration tool is able to access a database with its tables and to map different columns to different visualizations. It can define interactions between visualizations, filter behavior and will be able to adapt to different clients, like PDA, TabletPC or Workstations (we have to accommodate to CPU power, screen size and input devices e.g. we will support gestures for TabletPC).
3. The Circle Segment View To further improve the smooth change of modalities from the textual input of the query to the visualization of the result set, the idea of Query Previews [2] was adapted. Additionally the users benefit from this because of the prevention of zero-hit or mega-hit queries. The evaluation results [3] for the INVISIP domain show a clear tendency towards filtering out irrelevant data based on some metadata attributes as early as possible. We introduced a visualization called Circle Segment View (CSV), which emphasizes the distribution of the data. This visualization also gives continuous feedback about the size of the result set. The effectiveness of control depends on the data type and on the cardinality of the values. So it should be carefully considered which data from our databases matches the requirements of the query preview.
data concerning one type of metadata. For each circle the user through drop down menus can choose this attribute. The size of each segment hints at the distribution of the data. A legend on top provides an overview of the different categories. Dots on the circle represent documents. This works up to a few thousand documents. For more documents the dots will vanish until the user has filtered out some of them. The dots are placed using two other numeric metadata. One metadata is mapped on the radius (e.g. relevance) and another one on the angle (e.g. release date). The metadata mapped on the angle is supported by a color gradient to gain easy access to that information (e.g. the older documents lay in the brighter drawn area). To influence this visualization and filter out some documents we use two AlphaSliders [4]. The first one specifies a range for the radius (e.g. relevance from 50..100), the second a range for the angle (e.g. a range from 1982 – 2002 is mapped to 10 degrees). By clicking on the AlphaSliders a popup window appears and lets us change the assignment for the radius or the angle. Users have the possibility to link both circles through Boolean expression chosen in a dropdown menu. They can select the documents of a segment by simply clicking on it. The dots will change their colors for feedback and the size of the result set will be altered. A typical scenario for a search in a movie database would look like this: The user wants to see a new science fiction movie with a good ranking and German language. He chooses 'Genre' for the category of the first circle and 'Language' for the second. After clicking on the segments representing 'German' and 'Science Fiction' he adjusts the sliders to a range of [1995..2002] for 'Release Date' and [70..100] for 'Rank'. He uses the predefined Boolean ‘AND’ operator on both circles. The user now adjusts the sliders until the result set reaches an appropriate size. Thereafter he will continue to examine the documents with our SuperTable. The general problems we are facing with this form of query preview are: interaction speed