Sustainability 2015, 7, 4004-4021; doi:10.3390/su7044004 OPEN ACCESS
sustainability ISSN 2071-1050 www.mdpi.com/journal/sustainability Article
Metafrontier Environmental Efficiency for China’s Regions: A Slack-Based Efficiency Measure Guoping Mei 1,2, Jingyi Gan 1,2 and Ning Zhang 3,* 1
2 3
School of Information Management College, Jiangxi University of Finance and Economics, Nanchang 330013, China; E-Mails:
[email protected] (G.M.);
[email protected] (J.G.) Institute of Management Science, Jiangxi Normal University, Nanchang 330022, China Institute of Poyang Lake Eco-Economics, Jiangxi University of Finance and Economics, Nanchang 330013, China
* Author to whom correspondence should be addressed; E-Mail:
[email protected] or
[email protected]; Tel.: +86-791-8381-0553; Fax: +86-791-8381-0892. Academic Editor: Marc A. Rosen Received: 1 February 2015 / Accepted: 31 March 2015 / Published: 7 April 2015
Abstract: A metafrontier slack-based efficiency measure is presented to measure environmental efficiency for various regions in China. The objective of the new approach is to investigate the change of environmental efficiency while incorporating group heterogeneities and all variable slack and environmental pollutants into environmental efficiency analysis. Global production technology is used to improve the discriminating power of environmental efficiency measurement. An empirical analysis of regional environmental efficiency is carried out incorporating sulfur dioxide emissions and the chemical oxygen demand (COD) of China’s regions from 2000–2011. Results indicate that excessive emissions pollution is the major cause of environmental inefficiency. Most of the regions return environmental efficiency values. Significant regional technology gaps in environmental efficiency are found between the east, central, and west areas. Finally, some policy implications are presented from the empirical results. Keywords: data envelopment analysis; environmental efficiency; Chinese regions; metafrontier slack-based measure (MSBM)
Sustainability 2015, 7
4005
1. Introduction Since the reform and opening-up policy, China’s economy has maintained rapid growth, but progress is based on the consumption of resources and environmental pollution. Extensive economic growth reduces the potential of economic sustainability, so improving the environmental efficiency of regions is an inevitable requirement for sustainable development. According to the Ministry of Environmental Protection’s report, the cost of environmental pollution continues to rise and pressure to control it is increasing. The cost of ecological environmental degradation and ecological destruction in 2010 was about 1538 billion Yuan, 3.5% percentage of GDP [1]. Since early 2013, the hazy weather over most regions in China has greatly impacted residents’ living conditions and economic development. This impact reflects the fact that rapid industrialization has caused severe environmental problems. Most provinces are now facing these serious environmental problems. The extensive mode of economic development, irrational industrial structure, and irrational energy structure will cause even greater environmental pollution. With the increasing environmental pollution, environmental efficiency has become one of the important academic subjects. Environmental efficiency is critically important because environmental improvement brings potential benefits to social and economic development. Higher environmental efficiency reflects the quality of economic development. The aim of this study is to propose a new approach, metafrontier slack-based, to measure environmental efficiency for China’s regions. The rest of this paper is organized as follows: Section 2 presents the related literature review, Section 3 explains the methodology, Section 4 presents an empirical study using the proposed metafrontier approach to analyze China’s regions from 2001–2011, and Section 5 concludes with some policy suggestions. 2. Literature Review In previous efficiency analysis studies, Färe et al. [2] and Krüger [3] employed the Malmquist index to analyze the total-factor efficiency and productivity of industrialized countries. However, these authors neglected to address the environmental impact of undesirable output in their efficiency analysis, so there were some limitations to their studies. To take into account the growing concern regarding environmental impacts, undesirable outputs should be incorporated into the environmental DEA framework [4]. In order to consider undesirable output variables, an output-oriented, directional, distance function has been proposed to solve the problem of assessment efficiency of undesirable outputs [5]. Kumar [6] used the directional distance function to derive the Malmquist–Luenberger (ML) productivity index and break the total-factor productivity (TFP) down into measures of technical and environmental efficiency changes. Chung et al. [7] proposed a directional distance function (DDF) to label environmental pollution as an undesirable output, taking into account that ignoring undesirable outputs will lead to biased results. The DDF has also been used for measuring eco-efficiency [8]. However, the above approaches were based on radial efficiency measures and suffered the limitation of overestimating environmental efficiency because they neglected the slack variables that are an important source of inefficiency [9]. To overcome this problem and in order to improve the accuracy of environmental efficiency, Tone [10] first proposed the slack-based measure (SBM) model, which incorporates slack variables to measure technical efficiency. Li and Hu [11] incorporated undesirable
Sustainability 2015, 7
4006
outputs into the slack-based model (SBM) to measure ecological total-factor energy efficiency. Zhou et al. [12] also incorporated undesirable outputs into the basic SBM to calculate environmental performance. Some recent studies have employed the SBM to calculate environmental efficiency and carbon emission performance [13–15]. Using the SBM approach can improve the accuracy of environmental efficiency measurement. Although there is much progress in measuring environmental efficiency, some methodological limitations persist. A notable limitation of [13–15] is that they did not consider regional heterogeneities in production technology. If technological heterogeneities are not considered, the estimated environmental efficiency may be placed under the unified group “frontier technology” [16]; the estimated efficiency may be biased because group heterogeneity may lead to differences in production technologies [17]. For China, this situation is especially significant. There are large differences among provinces in the production structure; some provinces have more FDI and fixed asset investment to develop industry while others have more rural industry. Thus, there are large heterogeneities in production technology among provinces. The single technology approach, wherein the production technology is assumed to be the same, is therefore not accurate. Some studies have used the metafrontier approach to incorporate technology heterogeneities to overcome this limitation [18–21]. However, these studies have not combined the metafrontier approach with the SBM framework. Thus, this study proposes a metafrontier SBM, incorporating regional heterogeneities to measure China’s environmental efficiency. This new approach can simultaneously incorporate slacks, undesirable outputs, and group heterogeneities of regions into an environmental efficiency analysis framework. Furthermore, this new approach has better discriminating power because it employs global environmental technology as the reference technology. 3. Methodology 3.1. SBM Model Many studies have adopted the data envelopment analysis (DEA) approach to analyze environmental efficiency. Song et al. [22] provided literature reviews on energy and environmental performance using the DEA method. The non-parametric DEA method is employed in our research to construct the frontier for ecological total-factor efficiency. The basic idea of this method is to use a metafrontier slack-based model to calculate the efficiency index incorporating regional heterogeneities. In this paper, we propose a new approach by combining the concept of metafrontier environmental technology and the SBM method; we refer to this as the metafrontier SBM model (MSBM). Suppose that there are N provinces and that each has three factors—inputs, good outputs, and bad outputs (pollutants)—which are denoted by three vectors. The SBM model incorporates the slacks for undesirable outputs as follows:
Sustainability 2015, 7
4007
smx 0 m1 x * m0 min g s srb 0 s s 1 r0 1 ( r11 1g r2 1 b1 ) 1 2 s1 s2 yr1 0 br2 0 1 1 M
M
S .T . N
z x n 1
n mn
N
z n 1
n
(1)
yr1n yr1 0 srg1 0
N
z b n 1
xm 0 smx 0
n r2 n
br2 0 srb2 0
smx 0 0, srg1 0, srb2 0, zn 0 smx 0 srg1 0 srb2 0 smx 0
s
Slack variables (potential reduction) of inputs;
g r1 0
Slack variables (potential enhancement) of good outputs;
b r2 0
Slack variables (potential enhancement) of bad outputs;
s
The decision-making unit whose efficiency is being estimated in the model; Subscript “0” Zn A non-negative multiplier vector for construction linear programming. Model (1) is an SBM model with undesirable outputs and can be solved using the linear transformed model [10]. If * 1 (which indicates that all slacks variables are 0), the DMU is efficient in the presence of undesirable outputs. The environmental efficiency (EE) for region i at time t can be defined as the ratio of target pollution output to actual pollution output. EE can be measured using the following equation: EE (i, t) =
Target pollution output (i, t ) Actual pollution output (i, t )
1 Target SO 2 output(i,t ) Target COD output(i,t ) ) = ( 2 Actual SO 2 output(i,t ) Actual COD output(i,t )
(2)
Thus, the target pollution (SO2, COD) output for each region can be calculated from Model (1) and is defined as: Target SO2 output = Actual SO2 outputt (i, t ) SO2 output slack(i, t )
(3)
Target COD output = Actual COD outputt (i, t ) COD output slack(i, t )
(4)
If Slack (i,t) = 0, which indicates that the gap between the actual frontier and target frontier does not exist, the DMU is efficient.
Sustainability 2015, 7
4008
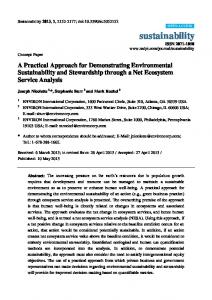
3.2. Metafrontier SBM Model Cooper et al. [23] incorporated the undesirable output into the SBM framework. O’Donnell et al. [18] introduced the metafrontier approach based on DEA. We now combine the concept of the metafrontier DEA approach with that of the undesirable outputs-SBM model to develop several indices of metafrontier environmental efficiency (MEEE) and investigate the regional heterogeneity of China. For this purpose, as shown in Figure 1, we define two frontier technologies: metafrontier and group frontier technologies.
Figure 1. Metafrontier and group frontier.
Suppose that K groups show some technological heterogeneities. In such a case, the provinces in certain groups may not access other groups’ technologies due to their own technological, resource, and other environmental constraints. Like Zhang et al. [24], we define the group frontier technology of group k as Tk {( x, y, b) : x can produce ( y, b)} , k = 1, 2,… K. Assume that Tk is nonparametric production technology. Then, the group frontier environmental efficiency for specific group k (GEEEk) using Models (1) and (2) can be defined as follows: GEEE (i, t) =
Group-frontier target pollution output (i, t ) Actual pollution output (i, t )
(5)
Unlike the case of group frontier technology, we construct a metafrontier technology that can envelop all group frontier technologies. Thus, the metafrontier can be defined as Tm {T1 T2 ... TK } . Suppose that each group k has Nk observations. The nonparametric metafrontier technology can be expressed as follows: K
Nk
MT {(x,y, b) : nk xmn xm , m 1,..., M , k 1 n 1 K
Nk
z k 1 n 1 K
Nh
k n
yr1n yr , r1 1,..., S1 ,
z b k 1 n 1
h n r2 n
1
br2 , r2 1,..., S2 ,
znk 0, n 1, , N k , k 1,...K .}
(6)
Sustainability 2015, 7
4009
znk is a nonnegative multiplier vector for constructing metafrontier technologies. Model (6)
indicates that the metafrontier needs data from all provinces across all groups. All group frontier technologies are covered by the production possibility set of metafrontier technologies. Combining Model (6) and analysis by O’Donnell et al. [18], in order to make the metafrontier smooth, we impose the convexity constraint of VRS assumption, as shown in Model (6). Combining the SBM Model (1) and the metafrontier technology Model (6), we propose the MSBM model. We also incorporate global environmental technology into the MSBM model to improve the discriminating power and comparability of intertemporal observations. The global MSBM can be measured by solving the following DEA model: s mx 0 m 1 x mo min g sr 0 s rb 0 S J 1 1 / ( S1 S 2 )( r 11 1 j 1 1 ) 1 y r1 0 br2 0 1
m*
1 M
M
S .T . T
K
Nk
z t 1 k 1 n 1 T
K
Nk
z t 1 k 1 n 1 T
K
Nk
z t 1 k 1 n 1 K
Nk
z k 1 n 1
k n
k n
x t mn x t mo s mx 0 t
y
s
y
k n
b t r2 n brt2 0 s rb2 0
rn
t r1 0
(7)
k n
g r1 0
1
s mx 0 0, s rg1 0 0, s rb2 0 0, z n 0
After solving Model (7) using the linear transformed model, the optimal solutions under metafrontier technologies can be obtained. Thus, we develop the Metafrontier Environmental Efficiency (MEEE) index for environmental performance as follows: MEEE (i, t) =
Metafrontier target pollution output (i , t ) Actual pollution output (i, t )
1 Metafrontier Target SO2 output(i,t ) Metafrontier Target COD output(i,t ) ) = 2( Real SO2 output(i,t ) Real COD output(i,t )
(8)
The traditional method uses the same technology to measure efficiency. However, if the observation lies under different technology, the result will be biased. The advantage of the metafrontier approach is to access the efficiency of all observations across different groups under different technologies; in addition, it can estimate the technology gap of each group. 3.3. Decomposition of MEEE In line with O’Donnell et al. [18], environmental efficiency under metafrontier technologies can be divided into within-group environmental efficiency and the metatechnology ratio (MTR) shown in Figure 1. Within-group environmental efficiency measures the relative environmental efficiency of observations under specific group frontier technologies. MTR represents the technology gap ratio between
Sustainability 2015, 7
4010
the frontier technologies for different groups relative to the metafrontier technology; MTR = 1 implies that no technology gap exists between group frontier technology and metafrontier technology. The higher the MTR, the closer the group frontier technology to the metafrontier technology. The Metafrontier Environmental Efficiency (MEEE) index can be broken down into a within-group energy efficiency index and an MTR index. The formulation can be expressed as follows: MEEE = GEEE × MTR
(9)
Next, we define the technology gap pertaining to environmental efficiency (TGEE) for each group as follows: TGEE = 1 − MTR
(10)
The TGEE measures the technology gap in environmental efficiency between group frontier technology and metafrontier technology. The higher the TGEE, the further the distance between the group frontier technology and the metafrontier technology, while TGEE = 0 indicates that no technology gap exists between the two technologies. 4. Empirical Findings
4.1. Data and Materials We first collected the data for the inputs and outputs described in our framework. The data consisted of 29 provinces and cities in mainland China. We assumed that the production model involves three kinds of input: one output and two undesirable outputs. The input data include capital stock (K), labor population (L) and energy consumption (E). Almost all the literature on energy or environmental efficiency measurement uses the three inputs. Population data has a strong relationship with labor data, thus it is not suitable to use labor and population together in the model. The capital stocks were procured from Wu [25], while the data after 2006 were estimated using the perpetual inventory method. Labor population was from the total number of employees. The energy consumption includes all energy sources that can be selected as the energy input, such as coal, oil, and gas. The energy consumption of all types is calculated as tons of standard coal (TSC). The real GDP, based on the constant year 2000, is used as the desirable output. For the undesirable output, we use SO2 emissions and COD to measure environmental energy efficiency. The pollutants data were sourced from the National Environment Statistical Yearbook (2001–2012) [26]. The GDP, capital stock, and labor population were sourced from the National Statistical Yearbook (2001–2012) and converted to 2000 constant prices with deflator [27]. Table 1 shows the descriptive statistics of input and output data. Table 2 shows the input-output correlation matrix, which indicates a significant correlation between input and output.
Sustainability 2015, 7
4011
Table 1. Descriptive statistics of variables, 2001–2011. Variable K L E GDP SO2 COD
Unit 109 Won 103 Persons 104 TSC 108 Yuan 104 Tons 104 Tons
N 348 348 348 348 348 348
Mean 8479.4 18,172.4 9838.9 6931.5 76.6 46.2
StDev 8417.9 12,586.9 10,540.1 6530.5 50.6 29.2
Min 337.7 1296.2 520.4 263.6 2.0 3.2
Max 55,055.9 53,448.9 159,165.0 39,550.9 214.1 124.6
Notes: K capital; L number of employees; E energy use.
Table 2. Input-output correlation matrix. Variables GDP COD SO2 K L E
GDP 1.000 0.544 *** 0.451 *** 0.942 *** 0.738 *** 0.856 ***
COD
SO2
K
L
E
1.000 0.663 *** 0.478 *** 0.832 *** 0.573 ***
1.000 0.486 *** 0.715 *** 0.726 ***
1.000 0.688 *** 0.896 **
1.000 0.769 ***
1.000
*** 1% level, ** 5% level.
4.2. Regional Heterogeneities in China In order to calculate the MEEE index to measure environmental efficiency, we classified the groups and determined the group members. Depending on the traditional classifications of Chinese regions, the 29 regions were divided into three groups: eastern area, central area, and western area. Geographical closeness was used as the criterion for categorizing the groups. The eastern area contains the most developed regions in China; it is composed of 11 regions (e.g., Beijing, Tianjin, Hebei, Shandong, and Guangdong). The eastern area possesses the best infrastructure in China and accounts for half of China’s GDP; thus, almost half of China’s foreign trading, modern service industries, energy usage, and pollution emissions are produced by the eastern area. The central area is composed of nine inland regions (e.g., Shanxi, Neimenggu, Jilin, and Heilongjiang). This area has had a good foundation of intensive heavy industry since 1979. Like the eastern area, it is also very industrial, but it also has the characteristic of foreign direct investment (FDI), technological development, and lower management. The western area is composed of 10 regions (e.g., Shanxi, Gansu, Qinghai, and Inner Mongolia). Although the western area has good natural resources, more than half of the territory, and lower population density, this area is nonetheless the least developed of the areas. Thus, the three areas show heterogeneities in their level of development. 4.3. Group Frontier Environmental Efficiency The group frontier environmental efficiency (GEEE) is calculated for each region based on models (1), (3), and (4), which are estimated under group technologies based on data only for specific regions. As shown in Figure 2 and Table 3, the average GEEE of each province is about 0.589. Some provinces in
Sustainability 2015, 7
4012
different areas have a GEEE value of unity, indicating that these provinces represent the best practices under within-group technologies. However, in general, most of the provinces show worse performance within their group technologies. 1.2
1
0.8
0.6
0.4
0.2
0 2000
2001
2002
2003
2004
Eastern area
2005
2006
2007
Central area
2008
2009
2010
2011
Western area
Figure 2. Trends of the group frontier environmental efficiency. Table 3. Group frontier environmental efficiency (GEEE) of regions. Province
Area
2000
2001
2002
2003
2004
2005
2006
2007
2008
2009
2010
2011
Beijing
E
0.565
0.637
0.697
0.837
0.867
0.983
0.999
0.770
0.927
1.000
0.889
1.000
Fujian
E
1.000
1.000
1.000
0.762
0.755
0.647
0.693
1.000
1.000
0.941
1.000
1.000
Hainan
E
0.605
0.494
0.671
1.000
1.000
0.789
0.855
1.000
1.000
0.966
1.000
1.000
Guangdong
E
1.000
1.000
1.000
0.994
0.881
0.914
0.871
1.000
1.000
1.000
1.000
1.000
Hebei
E
0.148
0.164
0.177
0.184
0.195
0.209
0.221
0.250
0.297
0.340
0.387
0.441
Jiangsu
E
0.316
0.282
0.308
0.292
0.285
0.281
0.358
0.456
0.564
0.681
0.799
1.000
Liaoning
E
0.417
0.573
1.000
1.000
0.661
0.382
0.362
0.352
0.420
0.462
0.414
0.470
Shandong
E
0.151
0.172
0.195
0.212
0.247
0.268
0.325
0.418
0.521
0.637
0.800
1.000
Shanghai
E
0.345
0.370
0.395
0.421
0.490
0.489
0.548
0.816
1.000
0.895
0.926
1.000
Tianjin
E
0.333
0.546
0.582
0.491
0.575
1.000
0.613
1.000
0.782
0.893
0.989
1.000
Zhejiang
E
0.590
0.498
0.488
0.442
0.395
0.366
0.387
0.462
0.540
0.641
0.754
0.846
Anhui
C
1.000
1.000
1.000
1.000
1.000
1.000
0.901
1.000
1.000
0.975
1.000
1.000
Henan
C
0.459
0.483
0.490
0.495
0.468
0.437
0.458
0.537
0.649
0.761
0.897
1.000
Heilongjiang
C
0.937
0.956
1.000
1.000
1.000
1.000
1.000
1.000
1.000
0.988
1.000
1.000
Hubei
C
0.534
0.570
0.586
0.578
0.571
0.580
0.583
0.645
0.704
0.763
0.886
1.000
Hunan
C
0.553
0.538
0.520
0.479
0.477
0.458
0.447
0.474
0.516
0.566
0.671
1.000
Jiling
C
1.000
1.000
1.000
1.000
0.996
1.000
0.825
1.000
0.944
0.948
1.000
1.000
Jiangxi
C
1.000
1.000
1.000
0.811
0.736
0.690
0.682
0.713
0.775
0.838
0.934
1.000
Shanxi
C
1.000
1.000
1.000
0.601
0.581
0.575
0.588
0.620
0.630
0.636
0.649
1.000
Gansu
W
0.250
0.285
0.272
0.239
0.255
0.235
0.257
0.285
0.312
0.336
1.000
1.000
Guangxi
W
0.094
0.120
0.132
0.115
0.114
0.127
0.159
0.204
0.257
0.320
0.397
0.465
Guizhou
W
0.120
0.136
0.143
0.141
0.147
0.154
0.160
0.177
0.197
0.218
0.235
0.246
Neimenggu
W
0.166
0.168
0.191
0.160
0.184
0.206
0.259
0.342
0.430
0.570
0.794
1.000
Sustainability 2015, 7
4013 Table 3. Cont.
Province
Area
2000
2001
2002
2003
2004
2005
2006
2007
2008
2009
2010
2011
Ningxia
W
1.000
0.177
0.237
0.238
0.339
0.189
0.192
0.205
0.224
0.250
0.264
0.283
Qinghai
W
1.000
1.000
1.000
1.000
0.709
0.418
0.415
0.425
0.448
0.459
1.000
1.000
Shaanxi
W
0.163
0.171
0.184
0.183
0.187
0.192
0.229
0.297
0.382
0.485
0.210
0.211
Sichuan
W
0.157
0.187
0.220
0.248
0.295
0.356
0.430
0.632
0.766
1.000
1.000
1.000
Xinjiang
W
0.250
0.265
0.277
0.265
0.220
0.222
0.225
0.237
0.251
0.279
0.122
0.115
Yunnan
W
0.234
0.253
0.268
0.257
0.267
0.278
0.308
0.379
0.464
0.555
0.643
0.699
Eastern area
0.497
0.521
0.592
0.603
0.577
0.575
0.567
0.684
0.732
0.769
0.814
0.887
Central area
0.810
0.818
0.825
0.746
0.729
0.717
0.685
0.749
0.777
0.809
0.880
1.000
Western area
0.343
0.276
0.292
0.284
0.271
0.238
0.263
0.318
0.373
0.447
0.567
0.602
China
0.530
0.519
0.553
0.533
0.514
0.498
0.495
0.576
0.621
0.669
0.747
0.820
The central area performs best compared with other groups, and the lowest GEEE value is for the western area. In sum, the results for the GEEE based on the within-group comparison indicate that the regions show relatively moderate environmental efficiency and the environmental efficiency under different group technologies is heterogeneous. 4.4. Metafrontier Environmental Efficiency To test whether these two groups are operating under the same environmental production technology, the non-parametric Mann–Whitney test is employed with the SBM efficiency result using the pooled data. The result shows that the null hypothesis of a single technology is rejected at a 1% significance level, showing the necessity of constructing group frontiers separately for each group using the metafrontier technology. That is to say, the level of environmental efficiency measured under one frontier cannot be compared with that for another frontier because of regional heterogeneous technologies. Therefore, we introduce the environmental efficiency (MEEE) measured under metafrontier technology, as shown in Table 4. As expected, the average MEEE for regions is lower than GEEE, indicating the existence of a technology gap between the metafrontier and group frontiers. For instance, with respect to the average MEEE from 2000–2011, the MEEE varied from 0.138 to 0.962 (average = 0.399), indicating that all provinces together showed an average increase of 60.1% in environmental efficiency under global metafrontier technologies. There is a huge potential improvement of MEEE after effective policies are taken. As shown in Table 4, the eastern regions are more efficient, showing the highest MEEE values. On the other hand, the western regions show poor environmental performance, with average MEEE values of 0.275. The average MEEE of the central area lies between the other areas. This conclusion confirms the Porter Hypothesis (Porter & van der Linde, 1995), which states that appropriate environmental regulation can encourage more innovation to improve productivity. Furthermore, this conclusion also provides evidence in favor of the environmental Kuznets curve hypothesis, which posits that environmental improvements occur after a certain level of economic development.
Sustainability 2015, 7
4014
Table 4. Metafrontier environmental efficiency (MEEE) of regions. Province
Area
2000
2001
2002
2003
2004
2005
2006
2007
2008
2009
2010
2011
Beijing
E
0.527
0.607
0.694
0.802
0.861
0.978
0.994
0.752
0.908
1.000
0.884
1.000
Fujian
E
0.467
0.537
0.625
0.440
0.448
0.380
0.416
0.615
0.745
0.746
0.888
0.939
Hainan
E
0.365
0.363
0.460
0.524
1.000
0.656
0.796
1.000
1.000
0.963
1.000
1.000
Guangdong
E
1.000
1.000
1.000
0.990
0.874
0.902
0.866
0.907
1.000
1.000
1.000
1.000
Hebei
E
0.142
0.158
0.170
0.175
0.187
0.200
0.212
0.240
0.287
0.331
0.377
0.441
Jiangsu
E
0.222
0.218
0.246
0.261
0.277
0.281
0.358
0.456
0.564
0.681
0.799
1.000
Liaoning
E
0.164
0.184
0.214
0.253
0.290
0.228
0.235
0.260
0.311
0.363
0.414
0.470
Shandong
E
0.144
0.165
0.187
0.203
0.237
0.258
0.325
0.418
0.521
0.637
0.800
1.000
Shanghai
E
0.343
0.369
0.394
0.419
0.479
0.489
0.540
0.616
0.736
0.891
0.925
1.000
Tianjin
E
0.285
0.458
0.531
0.490
0.566
0.541
0.600
0.679
0.765
0.851
0.978
1.000
Zhejiang
E
0.265
0.292
0.308
0.313
0.330
0.341
0.380
0.453
0.540
0.641
0.754
0.846
Anhui
C
0.260
0.280
0.301
0.295
0.317
0.328
0.372
0.573
0.687
0.779
1.000
1.000
Henan
C
0.189
0.207
0.187
0.193
0.193
0.185
0.205
0.237
0.278
0.318
0.373
0.437
Heilongjiang
C
0.304
0.322
0.346
0.313
0.352
0.363
0.494
1.000
1.000
0.577
0.630
0.698
Hubei
C
0.195
0.212
0.218
0.216
0.216
0.227
0.237
0.277
0.317
0.359
0.411
0.466
Hunan
C
0.168
0.177
0.189
0.163
0.169
0.172
0.191
0.234
0.267
0.286
0.305
0.322
Jiling
C
0.239
0.280
0.311
0.324
0.343
0.279
0.286
0.321
0.373
0.420
0.466
0.512
Jiangxi
C
0.236
0.255
0.288
0.235
0.221
0.212
0.218
0.238
0.271
0.299
0.337
0.368
Shanxi
C
0.130
0.139
0.151
0.143
0.148
0.155
0.167
0.191
0.210
0.226
0.252
0.280
Gansu
W
0.250
0.285
0.272
0.239
0.255
0.235
0.257
0.285
0.312
0.336
0.667
0.586
Guangxi
W
0.094
0.120
0.132
0.115
0.114
0.112
0.120
0.134
0.152
0.168
0.192
0.200
Guizhou
W
0.120
0.136
0.143
0.141
0.147
0.154
0.160
0.177
0.197
0.218
0.233
0.232
Neimenggu
W
0.166
0.168
0.191
0.160
0.184
0.189
0.204
0.237
0.269
0.302
0.346
0.376
Ningxia
W
0.183
0.177
0.237
0.238
0.339
0.189
0.192
0.205
0.224
0.250
0.264
0.283
Qinghai
W
1.000
1.000
1.000
1.000
0.709
0.418
0.415
0.425
0.448
0.459
1.000
1.000
Shaanxi
W
0.163
0.171
0.184
0.183
0.187
0.187
0.194
0.220
0.251
0.291
0.210
0.211
Sichuan
W
0.106
0.120
0.112
0.115
0.125
0.141
0.153
0.180
0.206
0.237
0.273
0.323
Xinjiang
W
0.250
0.265
0.277
0.265
0.220
0.222
0.225
0.237
0.251
0.260
0.122
0.115
Yunnan
W
0.234
0.253
0.268
0.257
0.267
0.270
0.274
0.298
0.331
0.360
0.391
0.402
Eastern area
0.357
0.395
0.439
0.443
0.505
0.478
0.520
0.582
0.671
0.737
0.802
0.881
Central area
0.215
0.234
0.249
0.235
0.245
0.240
0.271
0.384
0.425
0.408
0.472
0.510
Western area
0.257
0.269
0.281
0.271
0.255
0.212
0.219
0.240
0.264
0.288
0.370
0.373
China
0.283
0.307
0.332
0.326
0.347
0.320
0.348
0.409
0.463
0.491
0.562
0.604
Figure 3 shows MEEE trends under metafrontier technologies from the group perspective. Before 2005, the eastern area had the highest MEEE, followed by the western area and central area. After 2005, the eastern area was followed by the central area and western area. From the MEEE trends, it is clear that the year 2005 was a key turning point of MEEE. That is, environmental efficiency significantly increased. One possible explanation might be the policy changes. Before 2005, with the development of industries and infrastructure, industrialization and urbanization were the main factors driving of China’s economic growth. Thus, the consumption of energy and resource were very high in that period.
Sustainability 2015, 7
4015
1 0.9 0.8 0.7 0.6 0.5 0.4 0.3 0.2 0.1 0 2000
2001
2002
2003
Eastern area
2004
2005
2006
Central area
2007
2008
2009
2010
2011
Western area
Figure 3. Trends of the metafrontier environmental efficiency.
Looking deeper, a possible interpretation might be found in the paradigm shift in Chinese policies. Before 2005, energy- and pollution-intensive industries and infrastructure development, which require vast amounts of energy and generate considerable emissions, were the main factors driving China’s economic growth. After 2005, because of the better implementation of the 11th Five-Year Plan (2006–2010), which includes sustainable development policies, stricter environmental regulations, and the policy of technology innovation in environmental production, led to environmental efficiency improvements. The MEEE of the eastern area shows a sustained increasing trend from 2000–2011, especially after 2005, whereas the MEEEs of the central and western areas show a slow growth trend. The main reason for this result is that eastern areas have more economic foundation and government management to implement the policy of sustainable growth, but the central and western areas did not have the same conditions. In order to better understand these regional heterogeneities of China, we analyzed the technology gap pertaining to environmental efficiency in the following section. 4.5. Meta-Technology Gap Ratio Table 5 shows the TGEE based on Equation (10) for each province. The eastern area shows the lowest average TGEE value, indicating that it has the smallest technology gap relative to the other areas. For instance, the average TGEE for the eastern area in 2011 was 0.123, indicating that this area can improve its environmental efficiency by 12.3% when it can access metafrontier technologies. That means that the efficiency of the eastern area under group frontier technology is 87.7% of that under metafrontier technology. The average TGEE for the central and western areas is about 0.598 and 0.142, respectively, indicating a relatively large technology gap between the two technologies for these areas. The average TGEE for some provinces is unity in some years, indicating the “best practice” environmental performance under two technologies, and there is no technology gap between the two technologies in these years.
Sustainability 2015, 7
4016 Table 5. TGEE of environmental efficiency for regions.
Province
Area
2000
2001
2002
2003
2004
2005
2006
2007
2008
2009
2010
2011
Beijing
E
0.067
0.047
0.004
0.043
0.006
0.004
0.006
0.024
0.021
0.000
0.006
0.000
Fujian
E
0.533
0.463
0.375
0.424
0.407
0.413
0.400
0.385
0.255
0.207
0.112
0.061
Hainan
E
0.397
0.266
0.315
0.476
0.000
0.169
0.070
0.000
0.000
0.003
0.000
0.000
Guangdong
E
0.000
0.000
0.000
0.004
0.009
0.013
0.006
0.093
0.000
0.000
0.000
0.000
Hebei
E
0.038
0.039
0.038
0.047
0.044
0.044
0.042
0.038
0.032
0.028
0.026
0.000
Jiangsu
E
0.297
0.227
0.203
0.107
0.027
0.000
0.000
0.000
0.000
0.000
0.000
0.000
Liaoning
E
0.607
0.679
0.786
0.747
0.560
0.404
0.351
0.260
0.259
0.215
0.000
0.000
Shandong
E
0.043
0.046
0.039
0.042
0.038
0.037
0.000
0.000
0.000
0.000
0.000
0.000
Shanghai
E
0.005
0.001
0.003
0.004
0.021
0.001
0.016
0.245
0.264
0.004
0.001
0.000
Tianjin
E
0.142
0.160
0.087
0.002
0.016
0.459
0.022
0.321
0.021
0.047
0.011
0.000
Zhejiang
E
0.551
0.413
0.369
0.291
0.166
0.069
0.018
0.020
0.000
0.000
0.000
0.000
Anhui
C
0.740
0.720
0.699
0.705
0.683
0.672
0.587
0.427
0.313
0.201
0.000
0.000
Henan
C
0.587
0.572
0.618
0.610
0.588
0.577
0.553
0.559
0.572
0.582
0.584
0.563
Heilongjiang
C
0.675
0.663
0.654
0.687
0.648
0.637
0.506
0.000
0.000
0.416
0.370
0.302
Hubei
C
0.635
0.627
0.628
0.626
0.622
0.608
0.593
0.571
0.550
0.530
0.537
0.534
Hunan
C
0.697
0.671
0.637
0.660
0.646
0.623
0.573
0.507
0.483
0.494
0.545
0.678
Jiling
C
0.761
0.720
0.689
0.676
0.655
0.721
0.654
0.679
0.605
0.557
0.534
0.488
Jiangxi
C
0.764
0.745
0.712
0.710
0.700
0.693
0.680
0.666
0.650
0.644
0.639
0.632
Shanxi
C
0.870
0.861
0.849
0.761
0.744
0.730
0.715
0.693
0.667
0.645
0.611
0.720
Gansu
W
0.000
0.000
0.000
0.000
0.000
0.000
0.000
0.000
0.000
0.000
0.333
0.414
Guangxi
W
0.000
0.000
0.000
0.000
0.000
0.118
0.243
0.343
0.409
0.474
0.518
0.570
Guizhou
W
0.000
0.000
0.000
0.000
0.000
0.000
0.000
0.000
0.000
0.000
0.008
0.054
Neimenggu
W
0.000
0.000
0.000
0.000
0.000
0.084
0.211
0.307
0.375
0.470
0.564
0.624
Ningxia
W
0.817
0.000
0.000
0.000
0.000
0.000
0.000
0.000
0.000
0.000
0.000
0.000
Qinghai
W
0.000
0.000
0.000
0.000
0.000
0.000
0.000
0.000
0.000
0.000
0.000
0.000
Shaanxi
W
0.000
0.000
0.000
0.000
0.000
0.023
0.151
0.259
0.343
0.401
0.000
0.000
Sichuan
W
0.324
0.359
0.489
0.535
0.575
0.605
0.645
0.714
0.731
0.763
0.727
0.677
Xinjiang
W
0.000
0.000
0.000
0.000
0.000
0.000
0.000
0.000
0.000
0.068
0.000
0.000
Yunnan
W
0.000
0.000
0.000
0.000
0.000
0.028
0.111
0.214
0.286
0.351
0.392
0.425
Eastern area
0.244
0.213
0.202
0.199
0.118
0.147
0.085
0.126
0.078
0.046
0.014
0.006
Central area
0.716
0.697
0.686
0.679
0.661
0.658
0.608
0.513
0.480
0.509
0.477
0.490
Western area
0.114
0.036
0.047
0.054
0.055
0.086
0.136
0.184
0.214
0.253
0.254
0.276
China
0.329
0.286
0.282
0.281
0.246
0.267
0.247
0.253
0.236
0.245
0.225
0.232
Figure 4 allows us to investigate the dynamic trend in the TGEE for each area from 2000 to 2011. Before 2005, the western areas showed the smallest technology gap, followed by the eastern and western areas. After 2005, the eastern area showed the smallest technology gap, indicating that the eastern area successfully reduced the technology gap for sustainable development in recent years. Generally, the trend in the technology gap for eastern and central areas continued decreasing throughout the analysis period, while the western area continued increasing.
Sustainability 2015, 7
4017
Figure 4. Trends of the technology gap in metafrontier performance.
From the above analysis, it can be seen that the Metafrontier Environmental Efficiency (MEEE) index from MSBM is lower than the group frontier environmental efficiency (GEEE) from SBM. This finding indicates that the group frontier environmental efficiency tends to overestimate the actual environmental efficiency. We employed the Wilcoxon–Mann–Whitney test not only to determine any significant differences between MEEE and GEEE, but also to determine any significant differences between areas. As shown in Table 6, the results reject the null hypothesis at the 1% level, indicating a significant difference between the two environmental efficiency values and a significant difference between the eastern and other two areas. Table 6. Results of the non-parametric test. Test Wilcoxon–Mann–Whitney Wilcoxon–Mann–Whitney Wilcoxon–Mann–Whitney
Null Hypothesis (Ho) Mean(MEEE) = Mean(GEEE) Mean(MEEE Eastern) = Mean(MEEE Central) Mean(MEEE Eastern) = Mean(MEEE Western)
Statistics 93 207 220
p-value 0.0011 0.0011 0.0001
4.6. Economic Efficiency vs. Environmental Efficiency In this sub-section, we examine the differences between economic and environmental efficiency. The economic efficiency is defined as the efficiency value without considering environmental undesirable outputs based on the metafrontier SBM model. To estimate economic efficiency, we use capital stock (K), labor (L), and energy consumption (E) as inputs; the real GDP is used as the output. Thus, the economic efficiency measures the regional economic performance without considering environmental factors. Figure 5 shows the results of average environmental efficiency and economic efficiency for China’s regions; economic efficiency is higher than environmental efficiency. These results suggest that without incorporating environmental factors, the economic efficiency index overestimates the real sustainability efficiency value.
Sustainability 2015, 7
4018
1 0.9 0.8 0.7 0.6 0.5 0.4 0.3 0.2 0.1 0 2000 2001 2002 2003 2004 2005 2006 2007 2008 2009 2010 2011 Environmental efficiency
Economic efficiency
Figure 5. Trends of economic efficiency and environmental efficiency.
From Figure 6, it can be seen that the economic efficiency of the three areas has a U-shaped trend, with the turning point at 2006. Before 2006, which is the starting point of the 11th Five-Year Plan, China’s economic growth was fueled by energy-intensive heavy industry and infrastructure building, which required enormous amounts of energy. Since then, the Chinese government announced the goal of a 20% reduction in energy intensity between 2006 and 2010. Therefore, the government’s stricter energy regulations likely increased the economic efficiency. The eastern area shows the highest economic efficiency, while the western area shows the lowest. The eastern area enjoys both high economic efficiency and environment efficiency. The Chinese government can thus allocate more of the capital derived from economic growth to environmental governance. The western area is well known for its rich natural resources, but has lagged well behind the other areas in terms of economic development due to its lack of infrastructure. Thus, this area has both the lowest economic efficiency and environmental efficiency. These gaps in regional economic and environmental efficiency indicate that the Chinese government needs to promote different types of environmental and economic policies for different areas to reduce technology gaps, aiming at filling the missing links for sustainable development. 1.000 0.950 0.900 0.850 0.800 0.750 0.700 2000 2001 2002 2003 2004 2005 2006 2007 2008 2009 2010 2011 Eastern area
Central area
Western area
Figure 6. Trends of economic efficiency for the three areas.
Sustainability 2015, 7
4019
5. Concluding Remarks
This paper proposed a Metafrontier Environmental Efficiency (MEEE) index based on the slack-based metafrontier model. This new approach investigates the change in environmental efficiency, incorporating group heterogeneities, slacks, and undesirable outputs into environmental efficiency analysis. Global environmental technology is also incorporated into the approach to improve the discriminating power of efficiency measurement. We conducted an empirical study of environmental efficiency for different Chinese regions for data spanning 2000–2011. The empirical results can be summarized as follows. First, most of the provinces showed weak environmental efficiency and showed potential to improve environmental efficiency; the current overuse and excessive discharge of pollutants are the main cause of inefficiency. Second, the eastern area showed the highest environmental efficiency, followed by the central area; the western area showed the worst environmental efficiency. Thus, the eastern area represented the best practices under metafrontier technologies. This observation was also supported by the environmental Kuznets curve hypothesis and Porter Hypothesis. Third, the eastern area showed the best environmental efficiency and all three areas showed an increasing trend of environmental efficiency after 2005. This confirms that the implementation of sustainable development policy in the 11th Five-Year Plan has had significant effects in all three areas. Finally, the eastern area showed the smallest technology gap, followed by the western and central areas. After 2005, the eastern area showed the smallest technology gap, whereas no such gap reductions were evident in the other areas. This indicates that the western and central areas failed to mitigate the technology gap, whereas the eastern area continued to improve. The study shows that environmental efficiency shows significant regional heterogeneity in China. These findings suggest that the Chinese government should implement and promote heterogeneous policies to improve the environmental efficiency of central and western areas, especially the sustainable development of western areas. It is necessary for all regions, according to their unique economic development and environmental conditions, to increase environmental efficiency. The central and western government should enhance their R&D investment to reduce the technology gap and allocate a reasonable amount of fixed capital to undertake environmentally friendly industries from the eastern area to improve sustainable development. Furthermore, the central government can make sustainable development policy in the New Year Plan to enable environmental efficiency and avoid serious contamination of the environment. Acknowledgments
We thank the two anonymous reviewers for providing helpful suggestions. The authors are grateful for the financial support provided by National Science Foundation, China (71063006, 41461118), the National Social Science Foundation, China (14BJY020); the Jiangxi Province Graduate Innovative Research Project (YC2013-B049) and the China Postdoctoral Foundation (2014M551849, 2014KY55). Author Contributions
Guoping Mei designed research; Jingyi Gan performed research and analyzed the data; Jingyi Gan and Ning Zhang wrote and revised the paper. All authors read and approved the final manuscript.
Sustainability 2015, 7
4020
Conflicts of Interest
The authors declare no conflict of interest. References
1. 2. 3. 4. 5. 6. 7. 8. 9. 10. 11. 12. 13. 14. 15.
16. 17.
National Bureau of Statistics of China (NBSC). National Environmental Statistical Bulletin 2010; China Statistics Press: Beijing, China, 2011. Färe, R.; Grosskopf, S.; Norris, M.; Zhang, Z. Productivity Growth, Technical Progress, and Efficiency Change in Industrialized Countries. Am. Econ. Rev. 1994, 84, 66–83. Krüger, J.J. The Global Trends of Total Factor Productivity: Evidence from the Nonparametric Malmquist Index Approach. Oxf. Econ. Papers 2003, 55, 265–286. Färe, R.; Grosskopf, S. New Directions: Efficiency and Productivity; Springer: New York, NY, USA, 2005. Färe, R.; Grosskopf, S.; Pasurka, C.A. Environmental production functions and environmental directional distance functions. Energy 2007, 32, 1055–1066. Kumar, S. Environmentally sensitive productivity growth: A global analysis using Malmquist–Luenberger index. Ecol. Econ. 2006, 56, 280–293. Chung, Y.K.; Färe, R.; Grosskopf, S. Productivity and Undesirable Outputs: A Directional Distance Function Approach. J. Environ. Manag. 1997, 51, 229–240. Picazo-Tadeo, A.J.; Diego, P. Environmental externalities and efficiency measurement. J. Environ. Manag. 2009, 90, 3332–3339. Fukuyama, H.; Weber, W.L. A directional slacks-based measure of technical efficiency. Socio-Econ. Plan. Sci. 2009, 43, 274–287. Tone, K. A Slacks-based Measure of Efficiency in Data Envelopment Analysis. Eur. J. Oper. Res. 2001, 130, 498–509. Li, L.B.; Hu, L.J. Ecological Total-Factor Efficiency of Regions in China. Energy Policy 2012, 46, 216–224. Zhou, P.; Ang, B.W.; Poh, K.L. Slacks-based efficiency measures for modeling environmental performance. Ecol. Econ. 2006, 60, 111–118. Zhang, N.; Choi, Y. Environmental efficiency of China’s Regional Economies: A Non-oriented slacks-based measure analysis. Soc. Sci. J. 2013, 50, 225–234. Zhou, Y.; Xing, X.P.; Fang, K.; Liang, D.P.; Xu, C.L. Environmental efficiency analysis of power industry in China based on an entropy SBM model. Energy Policy 2013, 57, 68–75. Li, H.; Fang, K.N.; Yang, W.; Wang, D.; Hong, X.X. Regional environmental efficiency evaluation in China: Analysis based on the Super-SBM model with undesirable outputs. Math. Comput. Model. 2013, 58, 1018–1031. Zhang, N.; Choi, Y. A note on the evolution of directional distance function and its development in energy and environmental studies 1997–2013. Renew. Sustain. Energy Rev. 2014, 33, 50–59. Battese, G.; Rao, D.S.P.; O’Donnell, C.J. A Metafrontier Production Function for Estimation of Technical Efficiencies and Technology Gaps for Firms Operating Under Different Technologies. J. Product. Anal. 2004, 21, 91–103.
Sustainability 2015, 7
4021
18. O’Donnell, C.J.; Rao, D.; Battese, G. Metafrontier frameworks for the study of firm-level efficiencies and technology ratios. Empir. Econ. 2008, 34, 231–255. 19. Oh, D.H.; Lee J.D. A metafrontier approach for measuring Malmquist productivity index. Empir. Econ. 2010, 38, 47–64. 20. Zhang, N.; Choi, Y. A comparative study of dynamic changes in CO2 emission performance of fossil fuel power plants in China and Korea. Energy Policy 2013, 62, 324–332. 21. Zhang, N.; Zhou, P.; Choi, Y. Energy efficiency, CO2 emission performance and technology gaps in fossil fuel electricity generation in Korea: A meta-frontier non-radial directional distance function analysis. Energy Policy 2013, 56, 653–662. 22. Song, M.; Guan, Y. The environmental efficiency of Wanjiang demonstration area: A Bayesian estimation approach. Ecol. Indic. 2014, 36, 59–67. 23. Cooper, W.W.; Seiford, L.M.; Tone, K. Data Envelopment Analysis: A Comprehensive Text with Models, Applications, References and DEA-Solver Software; Kluwer Academic Publishers: Boston, MA, USA, 2007. 24. Zhang, N.; Kong, F.; Yu, Y. Measuring ecological total-factor energy efficiency incorporating regional heterogeneities in China. Ecol. Indic. 2014, 51, 165–172. 25. Wu, Y. China’s Capital Stock Series by Region and Sector; The University of Western Australia Discussion Paper 09.02; University of Western Australia: Perth, Australia, 2009. 26. National Bureau of Statistics of China (NBSC). Available online: http://www.stats.gov.cn/tjsj/ndsj/ (accessed on 12 March 2015). (In Chinese) 27. National Bureau of Statistics of China (NBSC). Available online: http://tongji.cnki.net/kns55/Navi/ HomePage.aspx?id=N2010080088&name=YCXME&floor=1 (accessed on 12 March 2015). (In Chinese) © 2015 by the authors; licensee MDPI, Basel, Switzerland. This article is an open access article distributed under the terms and conditions of the Creative Commons Attribution license (http://creativecommons.org/licenses/by/4.0/).