Computers & Geosciences 91 (2016) 128–135
Contents lists available at ScienceDirect
Computers & Geosciences journal homepage: www.elsevier.com/locate/cageo
Case study
MetClass: A software for the visualization and exploitation of Dill's (2010) “chessboard” classification of mineral deposits Hamza Kaabeche a,n, Moulley Charaf Chabou b, Abderrahmane Bendaoud a, Jean-Louis Bodinier c, Olivier Lobry d, Fabien Retif d a Université des Sciences et de Technologie Houari Boumediène, Faculté des Sciences de la Terre, de la Géographie et de l’Aménagement du Territoire, BP 32, Dar El Beida, 16111 Alger, Algérie b Université Ferhat-Abbas, Sétif 1, Institut d’Architecture et des Sciences de la Terre, Département des Sciences de la Terre, Campus El-Bez, 19000 Sétif, Algérie c Université de Montpellier, Géosciences Montpellier, Campus Triolet, CC 60, Place Eugène Bataillon, 34095 Montpellier Cedex 05, France d Université de Montpellier, Observatoire de Recherche Méditerranéen de l’Environnement, Campus Triolet, CC 22002, Place Eugène Bataillon, 34095 Montpellier Cedex 05, France
art ic l e i nf o
a b s t r a c t
Article history: Received 20 October 2015 Received in revised form 21 March 2016 Accepted 23 March 2016 Available online 25 March 2016
Rising economic value of a large number of metals as a result of their importance for new technologies and industrial development has renewed worldwide interest for mineral exploration and detailed studies of ore deposits. The Dill's (2010) “chessboard” classification of mineral deposits is the most recent attempt to provide an exhaustive overview of all mineral deposits known to date. However, the voluminous Dills review paper is accessible only in print or as PDF file. In this article, we present MetClass, software that provides advanced solutions to perform efficient research and statistics using Dill's classification and the related database. MetClass allows to assemble all results relevant to a given ore deposit on a user-friendly interface. This software is therefore a valuable tool for mineral exploration and research on ore deposits, as well as an educational solution for students in metallogeny. & 2016 Elsevier Ltd. All rights reserved.
Keywords: Metallogeny Ore deposits Dill's classification Software Database interrogation
1. Introduction The demand for a large number of metals of economical interest has drastically increased in the last decades as a result of their multiple applications in new technologies and their importance in the exploitation of both conventional and renewable energy resources. Interest for metallogeny was therefore reactivated, which includes both finding new ore deposits and thorough characterization of those already known (e.g., Laznicka, 2014). This also reinforces the need for a global classification of metal deposits providing comprehensive insight into the relationship between metals distribution, host rock types, and the different forms of deposits. Since the pioneering works of De Launay (1913), who introduced the term “metallogeny” and provided the first classification of mineral deposits, and those of Lindberg (1922) and Lindgren (1933) on deposit terminology and classification, several attempts were made to propose classifications of ore deposits (Bateman, 1950; Schneiderhöhn, 1962; Routhier, 1963; Stanton, 1972; Hutchinson, 1983; Laznicka, 1985, 2005; Schröcke, 1986; n
Corresponding author. E-mail address:
[email protected] (H. Kaabeche).
http://dx.doi.org/10.1016/j.cageo.2016.03.014 0098-3004/& 2016 Elsevier Ltd. All rights reserved.
Guilbert and Park, 1986; Carr & Herz, 1989; Whitney and Naldrett, 1989; Kirkham et al., 1993; Evans, 1993; Kesler, 1994; Robb, 2004; Dill, 2010). However, some of these works are restricted to a given type of deposit, such as hydrothermal ores (Barnes, 1997). Others focus on one prominent parameter, such the nature of the host rock (Whitney and Naldrett, 1989) or the metallogenic process involved (Routhier, 1963; Guilbert and Park, 1986). The recent Dill's compilation (“The chessboard classification scheme of mineral deposits: Mineralogy and geology from aluminum to zirconium”, by Dill (2010) – published in the 100th issue of Earth Science Reviews) is an attempt to provide an exhaustive classification of all mineral deposits known to date. It is also the most comprehensive as it includes most parameters that are pertinent to the deposits characterization, with extensive references to previous studies. The Dill's “chessboard” classification is therefore highly valuable as it makes the present-day knowledge on metal resources widely accessible to the interested scientific community. It is however quite an effort for users to retrieve all the information from Dill's article pertinent to a given type of chemical element, or to specific metallic ores and deposits, and to assemble information dispersed throughout the 420 pages of the volume. The MetClass software presented in this paper was designed to overcome these difficulties and make the information available in
H. Kaabeche et al. / Computers & Geosciences 91 (2016) 128–135
129
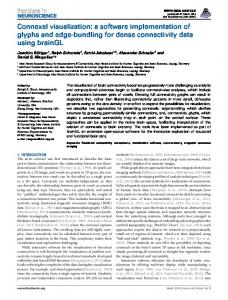
Fig. 1. Schematic representation of the Dill's (2010) “chessboard” table (a) and examples of information relative to the table lines (chemical elements – b, c, d), columns (host rocks – e, f) and cells (ore deposits – g).
Table 1 Types of data sources that were identified by analyzing Dill's article. “Chessboard” table (12 sources)
Gemstones and ornamental stones Industrial minerals and rocks Ore minerals and metallic resources Element- industrial minerals and rocks Host rock type Host rock code Ore deposit form Ore deposit type Ore mineralization process Ore code Ore deposit form code Rock subtype code
Article's body (7 sources)
Chemistry and mineralogy Supply and use Minerals that contains that chemical element Deposition environment Geodynamic settings Rocks with the same type as the ore deposit host rock Ore deposit form description
economic interest and the columns for the host rocks (and/or structures), classified in four main groups: (1) magmatic rocks, (2) ore-bearing structures (pipes and faults), (3) sedimentary rocks and (4) other host types. Additional information pertinent to the chemical elements and host rocks is given in the text of the article and in tables. This includes, for instance, geochemical information on the elements (Fig. 1b), on their industrial use (Fig. 1c), and on related ore minerals (Fig. 1d), as well as petrographic and metallogenic information on host rocks (Fig. 1e,f). At the intersection of the lines and columns, the cells indicate the different types and forms of ores (sub-cells) relevant to a given chemical element and a given host rock/structure. For more details, each sub-cell refers to relevant information given in the main body of the article, including type localities, geological settings, ores mineralogy and the metallogenic processes involved (Fig. 1g). Table 1 summarizes the 19 types of data sources that were identified by analyzing Dill's article. Most of them were retrieved from the text but the data also include photographs, maps and drawings.
3. MetClass design and implementation Dill's compilation easily accessible. The software uses the Dill's “chessboard” structure but minimizes the efforts to query the database and optimizes the relevance of the search results. 2. The Dill's (2010) “chessboard” model Dill's classification is primarily composed of a 20-pages matrix table (Fig. 1a) in which the lines stand for the chemical elements of
The MetClass software aims to facilitate retrieval of information from the Dill's “chessboard” table and extraction of complementary data from the article. The structure of the classification is fully preserved so that the search for relevant information can proceed from the chemical elements or/and from the host rocks. The visualization of the chessboard table is optimized and advanced query functions allow to maximize the relevance of the
130
H. Kaabeche et al. / Computers & Geosciences 91 (2016) 128–135
Fig. 2. Schematic representation of the successive steps involved in the development of the MetClass software.
Table 2 Database pre-structure of MetClass. Table
Attribute
Type
Chemical element (8)
Gemstones and ornamental stones Industrial minerals and rocks Ore minerals and metallic resources Element- industrial minerals and rocks Chemistry and mineralogy Supply and use Mineral that contains that chemical element Chemical element code
String String String String Text Text String
Deposition environment Geodynamic settings Host rock type Rocks with the same type as the ore deposit HR Host rock code
Text Text String String
Ore deposit form Ore deposit type Mineralization process Ore deposit form description Ore deposit code Other host rocks that contain this ore deposit
String String Text Text character String
Host rock (5) (HR)
Ore (6)
Integer
character
Fig. 3. Fields of the MetClass database related to the lines (chemical elements), columns (host rock types) and cells (ore deposits) of the Dill's (2010) “chessboard” classification scheme.
results. Information retrieved via the automatized interrogation procedure is displayed on the same Graphical User Interface (GUI) as the “chessboard” table. The MetClass design and implementation, as well as the
construction tools, were chosen to be efficient, and yet simple and easy to implement. This notably applies to the software development process, the data management system, and the programming language.
H. Kaabeche et al. / Computers & Geosciences 91 (2016) 128–135
131
Fig. 4. Overall organization of the MetClass Graphical User Interface illustrating the main window divide between an upper “Data selection” area and a lower “Data visualization” box.
Fig. 5. Display of the MetClass User Interface in the “Data visualization” mode illustrating a query on a given chemical element (horizontal path).
132
H. Kaabeche et al. / Computers & Geosciences 91 (2016) 128–135
The software development process (Fig. 2) is based on the waterfall model (Royce, 1987) modified to fit the requirements of the Dill's classification. This process works like a production chain where each step of the chain performs morphological and structural changes on the classification structure and data. At the end of this process, a less complex and fully automated structure is obtained with identical data to those of the source classification, but different in their organization. The database pre-structure of MetClass (Table 2) consists of three tables wherein the 19 data sources from Table 1 are grouped and stand for the fields. A link is made between these 3 tables by adding two fields (the codes for the host rocks and for the ore deposits) to the “Ore_deposit” table in the database pre-structure. Fig. 3 shows the final database structure and the interactions between the three tables, representing the lines (chemical elements), columns (host rock types) and cells (ore deposits). MetClass is designed to run on all Windows-based machines, running XP or later versions. It is a “run to use” and “stand-alone” software, meaning that it does not need to be installed on the host machine and that no driver or third-party application is required. The native Windows database engine manager, called “Microsoft Jet Engine” is used to manage the MetClass database. Its latest version (4.0) is very flexible and compatible with the SQL standard, giving the MetClass database all the power and reliability required for its manipulation. The choice of the programming language went toward a compiled language, for its lightness and speed advantages (Aho et al., 2007). Coding of the application was made on a last generation RAD type compiler, to facilitate the code production and maintenance, and also for improving application performance.
4. Graphical user interface and operating modes Owing to the large amount of information available in the MetClass database, efficient visualization is essential to provide the user with a clear display of the search results. The MetClass interface is subdivided into two main windows (Fig. 4) with two distinct ergonomic standards: (1) The regulation line model (Nogier, 2008) is used for the “Data selection” area, in the upper part of the interface. This area comprises a selection panel, on the left, that proposes different tools to search the database (text box, buttons and drop-down lists, etc.). The content of this box is variable, depending on the selected visualization path and data search modes. The rest of the “Data selection” area is occupied by a large workspace displaying the list of query results. (2) The screen areas visibility and accessibility model (Nogier, 2008) was preferred for the lower, “Data visualization” area, displaying all information pertinent to the user's query results. This standard recommends to display important information at the GUI center and to spread the rest on the sides. Accordingly, our choice was to provide information on ore deposits in the middle of the area and to display the information on related chemical elements and further additional information on either side (Fig. 4). MetClass 1.0 has two main functions: the “Data visualization mode” and the “Data interrogation mode”. The user can switch between these two modes from the menu bar, atop the main window (Fig. 4). In the Data visualization mode, MetClass faithfully reproduces the Dill’s classification paths, which can be browsed from the
Fig. 6. Display of the MetClass User Interface in the “Data visualization” mode illustrating a query on a given host rock (vertical path).
H. Kaabeche et al. / Computers & Geosciences 91 (2016) 128–135
chemical elements (horizontal path) or from the host rocks (vertical path). Whatever the browsing direction, the user must choose an input data from the drop down list to start querying the database. For the horizontal path (Fig. 5), the data will be the chemical element that is predominant in the ore deposit; for the vertical path (Fig. 6), it will be the host rock of interest. To optimize the query results, filtering data may be selected from the dropdown lists or entered into the text boxes. By clicking on one of the query results from the list shown in the selection data area (upper part of the window), the user is provided with detailed information on the ore deposit type. This information is displayed in the “Data visualization” box situated in the lower part of the interface (Fig. 4). The Data interrogation mode is a true added value of the MetClass software to the Dill's compilation. It allows to retrieve accurate and pertinent data in a simple and fast way. The user can choose between a basic (blind) and an advanced (multi-criteria) query methods. The basic query method simply requires to enter keywords into the text box and click on “Find” (Fig. 7). The (upper) “Data selection” area then splits into four boxes providing relevant information on chemical elements, ore deposits, related mineral associations, and host rocks, respectively. Clicking on one of these results provides more detailed information displayed on the (lower) “Data visualization” box. Switching to the “Advanced research” panel allows the user looking for a peculiar type of deposit or a specific information to refine his research (Fig. 8). This can be achieved using the “by data type” panel where the user can select different types of data from a dropdown list in order to define a specific field. Finally, users who are familiar with the Dill's model can also go straight to the information on a given deposit type by entering its EDS code, with no need to use the research functions. The EDS
133
code is formed by the chemical element code number (E), ore deposit (D) and host rock type (S) code letters. For example, 6aM is the EDS code for vanadium in phosphorite deposit in special sedimentary rocks. To do so, the user simply switch to the “EDS code search” panel (Fig. 9) to enter the EDS code. The display of results is the same as for the other search approaches.
5. MetClass performance Through its different search functions and path visualization modes, the MetClass 1.0 software reduces search efforts and optimizes the relevance of the information that can be retrieved from the Dill's database. The results display system occupies 47.9% of the total MetClass interface, which increases the software usability by providing all information on a single window. The Average Necessary Time (ANT) for querying the database is indicated after each interrogation, together with the number of results (Figs. 5–9). The value depends on the power of the host machine but is generally less than 100 milliseconds. Tests on different computers with Intel i3 (2 cores, 2.4 GHz clock frequency), i5 (4 cores, 2.6 GHz) and i7 (4 cores, 1.73 GHz) provided ANT values ranging between 15 and 78 ms.
6. Authors’ and editors’ rights The MetClass 1.0 database contains information issued exclusively from the Dill’s (2010) review paper. For copyright reasons, its use is restricted to users who possess the original article, in PDF downloaded from the official website of Earth-Science Reviews. By clicking on “Authenticate” and choosing the original
Fig. 7. Display of the MetClass User Interface illustrating a basic (blind) query in the “Data interrogation” mode.
134
H. Kaabeche et al. / Computers & Geosciences 91 (2016) 128–135
Fig. 8. Display of the MetClass User Interface illustrating an advanced (multi-criteria) query in the “Data interrogation” mode.
Fig. 9. Display of the MetClass User Interface illustrating a query in the “EDS search” mode.
H. Kaabeche et al. / Computers & Geosciences 91 (2016) 128–135
article in PDF in the dialog box that appears, MetClass opens access to the database. In this version, a sample of chrome deposits data is proposed as demonstration, without authentication.
135
Appendix A. Supplementary material Supplementary data associated with this article can be found in the online version at http://dx.doi.org/10.1016/j.cageo.2016.03.014.
7. Conclusion References The MetClass software provides an easy way to explore the largest database of mineral deposits currently available (Dill, 2010). The principles of the Dill's chessboard classification are respected, meaning that information on ore deposits can be primarily obtained via chemical elements or host rocks. However, MetClass provides several advanced solutions to perform efficient research through the database, as well as statistics on a variety of parameters. Further strength of the software is that the results are displayed on a user-friendly interface gathering all the information relevant to a given ore deposit. MetClass is therefore a promising tool for mineral exploration and research on ore deposits, as well as an educational solution for students in metallogeny. Forthcoming releases of the software will include further features, such as figures and images illustrating ore deposits forms, and the possibility to add information to the database, such as new technological uses of metals, the ecological impact of their exploitation and refinement, etc. Particular attention will be given to a new graphical interface where the location of known worldwide ore deposits and useful element concentrations will be projected on geo-referenced maps (e.g., Google Earths), making MetClass a unique metallogenic inventory tool. These versions of MetClass will be available on mobile devices such as tablets and smartphones, and its database will have the OGC standards for cataloging data.
Acknowledgments This study was performed as part of a collaborative multi-disciplinary research project between University of Sciences and Technologie Houari Boumediène, Algiers (“Faculté des Sciences de la Terre, de Géographie et d’Aménagement du Territoire”), University Ferhat-Abbas, Setif 1 (“Institut d’Architecture et des Sciences de la Terre”) and Université de Montpellier & CNRS (“Géosciences Montpellier” and “Observatoire de Recherche Méditerranéen de l’Environnement”), funded by the FP7-PEOPLE-2013IRSES project MEDYNA under the Grant Agreement PIRSES-GA2013-612572 (WP4-Applied Geology). Professor Khadidja Ouzegane (USTHB) is greatly thanked for her help during the preparation of the manuscript.
Aho, A.V., Lam, M.S., Sethi, R., Ullman, J.D. (Eds.), 2007. Compilers: Principles, Techniques, and Tool. Pearson, United Kingdom, p. 993. Barnes, H.L., 1997. The Geochemistry of Hydrothermal Ore Deposits, 3rd edn. John Wiley and Sons, N.Y., p. 972. Bateman, A.M. (Ed.), 1950. Mineral Deposits. John Wiley and Sons, p. 916. Carr, D.D., Herz, N., 1989. Concise Encyclopedia of Mineral Resources. MIT Press, MA, p. 426. De launay, L., 1913. Traite De Metallogenie: Gites Mineraux et Metalliferes: Gisements, Recherche, Production Et Commerce Des Mineraux Utiles Et Minerais, Description Des Principales Mines. C. Beranger, Paris. Dill, H.G., 2010. The chessboard classification scheme of mineral deposits: Mineralogy and geology: from aluminum to zirconium. Earth-Sci. Rev. 100, 420. Evans, A.M. (Ed.), 1993. Ore Geology and Industrial Minerals - An Introduction. Blackwell, Oxford, p. 358. Guilbert, J.M., Park, C.F. (Eds.), 1986. The Geology of Ore Deposits. W.H. Freeman and Co., New York, p. 985. Hutchinson, C.S. (Ed.), 1983. Economic Deposits and Their Tectonic Setting. Macmillan, London, p. 365. Kesler, S.E. (Ed.), 1994. Mineral Resources, Economics and the Environment. Macmillan, N.Y., p. 391. Kirkham, R.V., Sinclair, W.D., Thorpe, R.I., Duke, J.M., (eds.), 1993. Mineral Deposit Modeling. Geological Association of Canada, Special Paper 40. 770 p. Laznicka, P. (Ed.), 1985. Empirical Metallogeny. Elsevier, Amsterdam, p. 1794. Laznicka, P. (Ed.), 2005. Giant Metallic Deposits: Future Sources of Industrial Metals. Springer, Berlin, Heidelberg, p. 732. Laznicka, P., 2014. Giant metallic deposits – a century of exponential progress. Acta Geol. Sin. 88 (s2), 90–92. Lindberg, W., 1922. A suggestion for the terminology of certain mineral deposits. Econ. Geol. 17, 292–294. Lindgren, W. (Ed.), 1933. Mineral Deposits, 4th Ed. McGraw-Hill, New York, p. 930. Nogier, J.-F., 2008. Ergonomie du Logiciel et Design Web, 4th edn Dunod, Paris, p. 291. Robb, L. (Ed.), 2004. Introduction to Ore-forming Processes. Wiley-Blackwell Publishing, Oxford, p. 384. Routhier, P. (Ed.), 1963. Les Gisements Métallifères. Masson, Paris, p. 1282. Royce, W.W., 1987. Managing the development of large software systems: concepts and techniques, In: Proceeding of the 9th International Conference on Software Engineering, Monterey, California, USA. IEEE Computer Society Press, pp. 328– 338. Schneiderhöhn, H. (Ed.), 1962. Erzlagerstätten-Kurzvorlesungen Zur Einführung Und Wiederholung. Fischer, Jena, p. 371. Schröcke, H. (Ed.), 1986. Die Entstehung der endogenen Erzlagerstätten. W. de Gruyter, Berlin, p. 878. Stanton, R.L. (Ed.), 1972. Ore Petrology. McGraw-Hill Book Company, New York, p. 713. Whitney, J.A., Naldrett, A.J., 1989. Ore deposition associated with magmas. Rev. Econ. Geol. 4, 250.