Int. J. Pharm. Sci. Rev. Res., 32(2), May – June 2015; Article No. 11, Pages: 55-58
ISSN 0976 – 044X
Research Article Method Development and Validation for the Estimation and Evaluation of Clotrimazole (an-Antifungal Drug) in Tablet Preparation by UV-VIS Spectroscopy 1
1
2
1
1
1
3
Sajid Mahmood*, Zaheer Ahmad, Muhammad Aslam, Fiza Naeem, Abrar Hussain, Naresh Kumar Division of Science and Technology, University of Education, Township Campus, College Road, Lahore, Pakistan. 2 Department of Chemistry, University of Wah, Wah Cantt, Pakistan. 3 Underground Coal Gasification Project Thar, Islamkot, Pakistan. *Corresponding author’s E-mail:
[email protected]
Accepted on: 08-04-2015; Finalized on: 31-05-2015. ABSTRACT The goal of the present study was to develop and validate of an analytical method for the evaluation of Clotrimazole in bulk and tablet dosage form. UV-VIS spectroscopic technique was used for the estimation of Clotrimazole. Organic solvents and chemicals were used as trial diluents. The selection of the diluents was carried out on the basis of solubility and stability factors upon which drug was fully solubilised and stable for sufficient time. The drug was finally soluble in 1NH2SO4. Beer Lambert’s law obeyed over a concentration range 4-12 ppm. Clotrimazole showed absorption maxima (λmax) at 263 nm. The recovery studies were established the accuracy of the proposed method and the results were validated as per ICH guidelines. Linearity was obtained by concentration versus absorbance for Clotrimazole with correlation coefficient r꞊0.999. Robustness of the method was calculated at two different wavelengths and was found to be 100.2% and 100.4% which was very close to the proposed assay value i.e., 100.4%. The LOD and LOQ were calculated as 0.353 ppm, 1.07 ppm respectively. The result analysis was validated statistically and recovery studies confirmed the accuracy and precision of the proposed method. The developed method can effectively be applied for the quality control analysis and determination of Clotrimazole in tablet dosage form. Keywords: Clotrimazole, 1N H2SO4, UV- Spectrophotometer, Validation, Antifungal.
INTRODUCTION
C
lotrimazole is imidazole derivative that is a broad spectrum fungicidal drug. It is an antifungal medication. This pessary (also known as a “vaginal tablet”) contains Clotrimazole, which act to treat infections caused by fungi. It can be used to in the treatment of fungal infections of both human and animals such as vaginal yeast infections, oral thrush, ringworm, athlete’s foot and jock itch1. Thrush is a common infection caused by a yeast (or fungus), which may live harmlessly in the vagina without you even noticing it. This vaginal tablet contains Clotrimazole 500 mg, which is the active ingredient. As well as the active ingredient, the vaginal tablet also contains lactose, adipic acid, pregelatinised maize starch, sodium, hydrogen carbonate, microcrystalline cellulose, magnesium stearate, maize starch, stearic acid, colloidal silicon dioxide, polysorbate 802. Mechanism of action of Clotrimazole is against the division and growing of fungi, alters the permeability of the fungal cell wall by inhibiting the biosynthesis of ergosterol and other sterols required for cell membrane production3. There are very few methods appearing in the literature for the method development and validation of Clotrimazole spectrophotometrically i.e. thin layer 4 5 chromatography , HPLC method , UV spectrophotometric 6 7 method and RP-HPLC method , HPLC method with UV detection, chromatographic and simultaneous spectrophotometric estimation8-10 combine dosage form by HPTLC method11. However, there was no
spectrophotometric method has been reported by using 1NH2SO4 as a solvent and also this procedure was convenient for the determination of the Clotrimazole in tablet dosage form at λmax 263nm. The objective of this work is to develop and validate the precise, simple and economical method for the estimation of Clotrimazole by UV-spectroscopy. MATERIALS AND METHODS Chemicals and Instruments The reference standard Clotrimazole (99.4%) pure was received as a gift sample from Java Pharmaceutical Kot Lakhpat Lahore. H2S04 (AR grade) was procured from Merck Chemical. Sample tablets Canesten (Clotrimazole label claim 500 mg) were purchased from local market Lahore. Distilled water was used throughout the study. A single beam UV-vis spectrophotometer (Shamdzui-2000 series) with 1 cm thickness of cell was used for the measurement. Disintegration apparatus (Galvano Scientific) was used to check disintegration time. Analytical balance (JS-110, Japan) was used to weigh the sample and standard (Clotrimazole) material. Preparation of Stock and Standard solution To prepare stock solution weigh accurately 100mg of Clotrimazole and transfer it into 100ml of volumetric flask, added small volume of 1NH2SO4, shake well and
International Journal of Pharmaceutical Sciences Review and Research Available online at www.globalresearchonline.net © Copyright protected. Unauthorised republication, reproduction, distribution, dissemination and copying of this document in whole or in part is strictly prohibited.
55
© Copyright pro
Int. J. Pharm. Sci. Rev. Res., 32(2), May – June 2015; Article No. 11, Pages: 55-58
ISSN 0976 – 044X
make the volume up to the mark with 1NH2SO4 to get 1000 ppm stock solution.
for 5 minutes. The resulting solution was filtered through Whatmann paper No. 41.
Further 10 ppm standard dilution was made by taking 1ml of above stock solution and make up the volume up to 100 ml with 1NH2SO4.
Take 1 ml from the above filtrate and make the volume up to 100 ml with 1NH2SO4 to get 10ppm concentration of the sample solution.
Application of Proposed method on Sample tablets
Assay Measurement
Commercially available twenty tablet (Canesten) was weighed and grind them to fine powder. An accurately weighed tablet powder 293.6 mg equivalent to 100 mg Clotrimazole was transferred to 100 ml volumetric flask and dissolved it in 1NH2SO4. The contents were sonicated
The mean assay results of three sample tablets were comparable with claimed value. The obtained results are presented in Table 1 and percentage was found to be 100.4%.
Table 1: Assay determination of Clotrimazole from its tablet. Sample Tablet
λmax
Label Claimed
Amount Found (mg∕Tab.)
Mean % Assay
Clotrimazole
263 nm
500 mg
502 mg
100.4 %
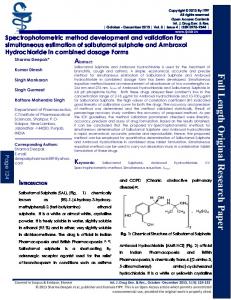
Figure 1: Structure of Clotrimazole
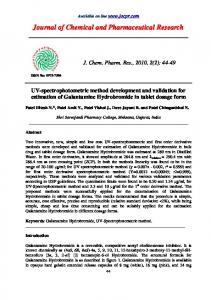
Figure 2: Linearity Study for Clotrimazole
Method Validation
Table 2: Dilutions for Calibration Curve
The method was validated by using the following parameters as described in ICH guidelines. Specificity The sample and the standard spectra were scanned to check the specificity of the method. There was not found any interference of the excipients for the determination of Clotrimazole which confirm the method is highly specified for the estimation of Clotrimazole in its tablet formulation.
S. No
Concentration of Clotrimazole (ppm)
Absorbance(nm)
1
4
0.065
2
6
0.125
3
8
0.173
4
10
0.239
5
12
0.292
6
14
0.349
Table 3: Regression Analysis of linearity curve
Linearity
Parameters
Linearity was measured by the analysis of various concentrations of the analyte as described in Table 2. Calibration curve was plotted over the concentration range 4-14 ppm. Correlation coefficient was found by using linear relationship between two variables x and y. Pearson’s Correlation coefficient ‘r’ was used which confirmed the linearity of the method. The value of correlation coefficient obtained was +1 and indicated that a linear relation exists between concentration and absorbance. The value of regression coefficient calculated was 0.999 which is close to 1 and indicated a best straight line.
Result 2
Correlation coefficient (R )
0.999
Regression Equation (R)
0.999
Regression Coefficient (Y)
0.048
Precision Precision of the assay was measured by performing assay on two tablet solutions (Tablet-A and Tablet-B) and comparing the value of mean percentage assay with the proposed assay. The mean percentage (%) assay of the tablets was found to be 100.3% and 101.5 % respectively, which was very close to the proposed assay value (100.4 %) hence the assay method was found to be precise.
International Journal of Pharmaceutical Sciences Review and Research Available online at www.globalresearchonline.net © Copyright protected. Unauthorised republication, reproduction, distribution, dissemination and copying of this document in whole or in part is strictly prohibited.
56
© Copyright pro
Int. J. Pharm. Sci. Rev. Res., 32(2), May – June 2015; Article No. 11, Pages: 55-58
ISSN 0976 – 044X
Table 4: Precision Data Sample
Absorbance of Tablet A
Percentage (%) Assay Tablet A
Absorbance of Tablet B
Percentage (%) Assay Tablet B
Sample-1
0.244
101.6
0.245
102.0
Sample-2
0.242
100.8
0.244
101.6
Sample-3
0.244
101.6
0.243
101.2
Sample-4
0.243
101.2
0.244
101.6
Sample-5
0.244
101.6
0.246
102.2
Mean (%) Assay+ SD
---------
100.3 + 0.389
----------
101.5 + 0.387
Mean (%) Assay + RSD
---------
0.38%
-----------
0.38%
Table 5: Recovery Study Data Samples
Added Amount
Sample Absorbance
Recovery (%) Assay
Sample-1
10 mg
0.455
97.9
Sample-2
10 mg
0.463
99.9
Sample-3
10 mg
0.460
98.5
Sample-4
10 mg
0.462
99.6
Sample-5
10 mg
0.464
100.2
Mean (%) Recovery Assay
----------
99.22
Percentage (%) Recovery + Standard deviation
---------
99.22 + 0.978%
---------
99.22 + 0.99%
Percentage (%) Recovery + Relative standard deviation
Table 6: Ruggedness Data Condition
Day 1
Day 2
Samples
% Assay
Sample Absorbance
% Assay
Sample Absorbance
Sample-1
99.04
0.273
99.5
0.281
Sample-2
100.2
0.281
100.1
0.285
Sample-3
100.5
0.283
99.4
0.279
Sample-4
101.3
0.288
100
0.282
Sample-5
100.1
0.275
99.02
0.271
Mean (% ) Assay + SD
100.2 + 0.812
-------
99.6 + 0.44
--------
Mean (% ) Assay + RSD
100.2 + 0.81%
-------
99.6 + 0.45%
--------
Table 7: Robustness Data Conditions
Wavelength Plus Condition (263+1)
Wavelength Minus Condition (263-1)
Samples
% Assay
Sample Absorbance
% Assay
Sample Absorbance
Sample-1
100.1
0.251
99.6
0.243
Sample-2
100
0.248
100
0.251
Sample-3
100.2
0.254
101.1
0.256
Sample-4
101.1
0.255
101.5
0.298
Sample-5
100
0.248
99.8
0.244
Mean (%) Assay + SD
100.2 + 0.423
------
100.4 + 0.845
--------
Mean (%) Assay + RSD
100.2 + 0.42%
------
100.4 + 0.84%
--------
Accuracy The accuracy of the proposed method was performed by using concentrations same as for calibration curve and adding a known amount (10 mg) of standard in each
sample. The percentage recovery and the level of spiking was calculated which was found to be 99.22%. It shows that almost all the spiked amount was recovered in the assay by the sample which was very close to the
International Journal of Pharmaceutical Sciences Review and Research Available online at www.globalresearchonline.net © Copyright protected. Unauthorised republication, reproduction, distribution, dissemination and copying of this document in whole or in part is strictly prohibited.
57
© Copyright pro
Int. J. Pharm. Sci. Rev. Res., 32(2), May – June 2015; Article No. 11, Pages: 55-58
actual percentage assay (100.4 %) and indicated a good accuracy of results. Ruggedness Ruggedness was determined by analysing the sample preparations on two different days. The mean percentage % assay at two consecutive days was found to be 100.2% and 99.6% respectively, which were very close to the proposed value (100.4 %) therefore the ruggedness parameter was found to be passed by the sample tablet containing Clotrimazole. Robustness Robustness was measured by changing the wavelength as 263 + 1nm (262 nm and 264 nm). The effect of change in wavelength was observed on proposed assay method. Values of mean percentage assay was calculated at two different wavelengths and was found to be 100.2% and 100.4% which was very close to the proposed assay value (100.4%) thus the robustness parameter was passed by the sample tablet containing Clorimazole. LOD and LOQ The limit of detection was calculated by standard deviation of the sample and the slope from the Calibration graph. The calculated value for limit of detection was 0.353ppm. The limit of quantization of an analytical procedure is the lowest concentration of an analyte in a sample that can be determined with suitable precision and accuracy under the stated experimental conditions. The calculated value for limit of quantification was 1.07 ppm.
CONCLUSION This sensitive and economical method for the estimation of Clotrimazole by uv-vis spectroscopy in tablet dosage form is specific and highly accurate, so it can definitely be employed for the routine analysis of tablet preparations in pharmaceutical industry. Acknowledgement: The authors are very grateful to Jawa Pharmaceutical, 112/10 Industrial area, Kot Lakhpat Lahore for providing gift sample of Clotrimazole and facilities for the study. We are also gratified to Mr. Baqir Jawa (CEO) Jawa Pharmaceutical for his valuable cooperation during the whole research work. REFERENCES 1.
Medicines and health care products regulatory agency (MHRA), British pharmacopoeia. London, 1, 2008, 2148.
2.
Marieb and Hoehn. Human Anatomy and Physiology, Toronto, Pearson. 2010, 643.
3.
Sweetman SC. Martindale: The complete drug reference, th 35 edition, British pharmacopoeia. Pharmaceutical press, London UK. 3, 2007, 764.
4.
The Indian Pharmacopoeia, 4 edition. New delhi. Controller of publication. 1, 1996, 196-198.
5.
Huang DL, Wang I. RP-HPLC Determination of Metronidazole, Clotrimazole and Chlorhexidine acetate in shuangzuaotai suppository compound. Yaowu fenxi zazhi. 22, 2002, 129-131.
6.
Devarajan, Laxmi S.S. Simultaneous spectrophotometric estimation of Valdecoxib and Tinidazole in tablet. Indian J. Pharm. Sci. 68(2), 2006, 240-242.
7.
Quing Z. HPLC determination of Metronidazole, Clotrimazole and Chlorhexidine acetate in their compound effervescent tablets. Yaowu fenxi zazhi. 21, 2001, 335-337.
8.
Renata H, Hana S, Ludmila M, Petra S, Petr S. Development and validation of HPLC method for determination of Clotrimazole and its two degradation products in spray formulation. Talanta. 73(3), (2007), 483-489.
9.
Abdel-Moety Em, Khattab Fi, Kelani Km, Aboual-Alamein Am. Chromatographic determination of Clotrimazole, Ketoconazole and Fluconazole in pharmaceutical formulations. Farmaco. 57(11), (2002), 931-938.
RESULTS AND DISCUSSION The aim of the present work is to develop and validate the method of determination of Clotrimazole under the suitable spectral conditions. Estimation of Clotrimazole by uv-vis spectroscopy was carried out. Absorbance of both the solutions (standard and sample) was calculated. Linearity was obtained by concentration versus absorbance for Clotrimazole with correlation coefficient r=0.999. The percentage recovery and the level of spiking was calculated which was found to be 99.22% and 9.99 respectively. It shows that almost all the spiked amount was recovered in the assay by the sample which was very close to the actual percentage assay (100.4 %) and indicated a good accuracy of results. There was not found any interference of the excipients for the determination of Clotrimazole which confirm the method is highly specified for the estimation of Clotrimazole in its tablet formulation. This reveals that the described method is applicable for the estimation of Clotrimazole in the pure as well as tablet dosage form.
ISSN 0976 – 044X
th
10. Bharath S.A, Arshad MD, Venugopal D, Kalyan KC. Development and validation of simultaneous spectrophotometric estimation of Clotrimazole and Tinidazole in tablet dosage forms. Inter. J. Phrama. Informa. 2(1), (2011), 12-17. 11. Getachew G, Ariaya H and Adnan AB. Development and validation of HPTLC assay method for simultaneous quantification of Hydrocortisone and Clotrimazole in cream and applying for stability indicating test. J. Chil. Chem. Soc. 57(3), 2012, 1199-1203.
Source of Support: Nil, Conflict of Interest: None. International Journal of Pharmaceutical Sciences Review and Research Available online at www.globalresearchonline.net © Copyright protected. Unauthorised republication, reproduction, distribution, dissemination and copying of this document in whole or in part is strictly prohibited.
58
© Copyright pro