by UPLC-UV detection and its application to a pharmacokinetic study. Prasada Rao. ... Rat plasma (K2EDTA) was obtained from Bioneeds, Bangalore, India. ... The mobile phase containing a mxture of 0.1%formic acid and methanol in the.
Available online at www.scholarsresearchlibrary.com
Scholars Research Library Der Pharmacia Lettre, 2013, 5 (1):205-214 (http://scholarsresearchlibrary.com/archive.html) ISSN 0975-5071 USA CODEN: DPLEB4
Method development and validation of atovaquone in rat plasma by UPLC-UV detection and its application to a pharmacokinetic study Prasada Rao. Ma,b and B. R. Challac* a
MAM College of Pharmacy,Kesanapudi,Narasaraopet,Guntur, Andhrapradesh, India b CMJ University, Shillong, Meghalaya, India c Nirmala college of Pharmacy, Madras road, Kadapa, Andhrapradesh, India
_____________________________________________________________________________________________ ABSTRACT A simple, sensitive, selective, rapid, rugged, reproducible and specific Ultra performance liquid chromatography (UPLC) method was used for a quantitative estimation of Atovaquone (AQ) in Rat plasma using 2,3-diphenyl-1indenone (AQIS) as an internal standard (IS). Chromatographic separation was performed on Waters Acquity UPLC® BEH C18, 2.1 x 50 mm, 1.7 µm column with an isocratic mobile phase composed of 0.1% formic acid : methanol (20:80 v/v), at a flow-rate of 0.2 mL/min AQ and AQIS were detected with waters TUV detector at UV wave length 277 (nm). Liquid-liquid extraction method was used and validated over a linear concentration range of 50.0-10000.0 ng/ mL with a correlation coefficient of (r2) ≥ 0.9981. The lower limit of quantification (LOQ), Limit of detection (LOD) was found as 50.0 ng/ mL and 100 p.g respectively. Intra and inter-day precision within 1.0 to 8.5 and 1.9 to 4.3 % and accuracy within 101.0 to 107.5 and 103.9 to 104.7 % for AQ. Drug found to be stable throughout three freeze-thaw cycles. This method was successfully applied into a pharmacokinetic study of rats through i.v administration. Keywords: UPLC; Atovaquone; Rat Plasma; Pharmacokinetic Study; _____________________________________________________________________________________________ INTRODUCTION Atovaquone is an antiprotozoal agent. The chemical name of atovaquone is trans 2-[4-(4-chlorophenyl)cyclohexyl]3-hydroxy-1,4-naphthalenedione. Atovaquone is a yellow crystalline solid that is practically insoluble in water. It has a molecular weight of 366.84 and the molecular formula C22H19ClO3[1]. The bioavailability of atovaquone is low and variable and is highly dependent on formulation and diet. Bioavailability of the suspension increases two-fold when administered with meals. When administered with food, bioavailability is approximately 47%. Without food, the bioavailability is 23%. Atovaquone is extensively bound to plasma proteins (99.9%) over the concentration range of 1 to 90 µg/mL. Half life 2.2 to 3.2 days [2-6]. Literature survey reveals that, there are few methods reported for quantification of Atavaquone in Biological [7-14], Pharmaceutical [15, 16]. These methods which are developed by LC-MS [7, 8], HPLC [9-14]. There is no method reported for quantification of Atavaquone in biological matrices by UPLC.
205
Scholar Research Library
B. R. Challa et al Der Pharmacia Lettre, 2013, 5 (1):205-214 _____________________________________________________________________________ The aim of the present research includes development and validation of Atavaquone in Rat plasma by using UPLC. This method was successfully applied into a pharmacokinetic study of rats through i.v administration.
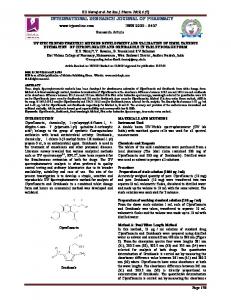
MATERIALS AND METHODS Chemicals and Reagents Atavaquone (AQ) (98.90% purity) was purchased from USP and 2,3-diphenyl-1-indenone (AQIS) (97.50% purity) was obtained from Creative Organics, India.(Fig.1). HPLC grade methanol and acetonitrile were purchased from Jt. Baker Mallinckrodt Baker, Inc. Phillipsburg, NJ, USA. N, N-Dimethylformamide (reagent grade) was purchased from Merck Limited, worli, Mumbai., Methyl t-butyl ether was purchased from Merck speciality private limited, worli, Mumbai. Rat plasma (K2EDTA) was obtained from Bioneeds, Bangalore, India. Ultra pure water from MilliQ system (Millipore, Bedford, MA, USA) was used through the study. All other chemicals in this study were of analytical grade. Instrumentation and Chromatographic Conditions UPLC was performed using Waters Acquity system equipped with binary solvent delivery pump, an autosampler and tunable UV detector. The chromatographic separation was performed using Waters Acquity BEH, 2.1 x 50 mm, 1.7 µm C18 analytical column at 30°. The mobile phase containing a mxture of 0.1%formic acid and methanol in the ratio of 20:80( v/v). at a flow rate of 0.2 mL/ min was used . The Injection volume was 10 µL. The detection was obtained at a wavelength of 277 nm. AQ and AQIS were eluted at 5.1 ± 0.2 min, 2.5 ± 0.2 min with a total run time of 8 min for each sample. Preparation of Standards, Calibration and Quality control (QC) Samples Standard stock solutions of AQ (1000.00µg /ml) and AQIS (100.00µg /ml) were prepared in methanol. The IS spiking solutions (8.00 µg /ml) were prepared in 50% methanol from AQIS standard stock solution. Standard stock solutions and IS spiking solutions were stored in refrigerator conditions (2-8 °C) until analysis. Standard stock solution AQ was added to drug free Rat plasma to obtain AQ concentration levels of 50.0, 100.0, 250.0, 500.00, 1000.00, 2000.00, 4000.00, 6000.00, 8000.00 and 10000.00 ng/ mLfor analytical standards and 50.00, 150.00, 3000.00, 7000.00 ng/mL (LLOQ, LQC, MQC, HQC) for quality control standards and stored in the freezer below 30°C until analysis. The aqueous standards were prepared in reconstitution solution (0.1%formicacid : methanol (20:80 v/v) and stored in the refrigerator (2-8°C) for validation experiments until analysis.
206
Scholar Research Library
B. R. Challa et al Der Pharmacia Lettre, 2013, 5 (1):205-214 _____________________________________________________________________________ Sample Preparation Liquid-liquid extraction (LLE) was used to isolate AQ and AQIS from Rat plasma. 50 µL of AQIS (10.0 µg /ml) and 100 µL respective plasma concentrations were added into polypropylene tubes and vortexed briefly. This was followed by addition of 2.5 ml of methyl t-butyl ether into each tube and vortexed for 10 min. All the samples were centrifuged at 4000 g.force, 20°C for 10 min and transferred the supernatant from each sample into respective polypropylene tubes. Samples were evaporated to dryness under nitrogen at 40°C. Finally samples were reconstituted with 200 µL of reconstitution solution (0.1% formicacid : methanol (20:80 v/v)) and vortexed briefly. From this 10 µL of each sample was injected into the UPLC system. Linearity, Precision and Accuracy The analytical curves were constructed using values ranging from 50.00 to 10000.00 ng/ mLfor AQ in Rat plasma. Calibration curves were obtained by 1/Conc2 quadratic regression analysis. Calibration curves were plotted against the ratio of instrument response (peak area ratio AQ/AQIS ) versus AQ concentration. Calibration curve standard samples and quality control samples were prepared in replicates (n=6) for analysis. Precision and accuracy for the back calculated concentrations of the calibration points were maintained within ± 15% of their nominal values. However, for LLOQ the precision and accuracy are within ± 20%. Selectivity& Specificity The selectivity of the method was determined by blank Rat plasma samples from six different lots to test the potential interferences of endogenous compounds co-eluted with AQ and AQIS. The Chromatographic peaks of AQ and AQIS were identified based on their retention times. The mean peak area of LOQ for AQ and AQIS at corresponding retention time in blank samples should not be more than 20 and 5% respectively. Limits of Quantification (LOQ) and Detection (LOD) LOQ was estimated in accordance with baseline noise method. The LOQ was estimated at a signal-to-noise ratio(S/N) of 5. The LOQ was experimentally performed by six injections of AQ at LOQ concentration (Fig.3b) .Signal to noise ratio was (S/N) calculated “by selecting the noise region as close as possible to the signal peak, which is at least 8 times the width of the signal peak at half height”. Recovery Recovery of AQ was evaluated by comparing the mean peak area of six extracted low, medium and high quality control samples (150.00, 3000.00 and 7000.00 ng/ml) to the mean peak area of six post spiked with equal amounts of quality control samples. Similarly, the recovery of AQIS was evaluated by comparing the mean peak area of extracted quality control samples to the AQIS in post spiked samples with the same amount of AQIS. Stability LQC and HQC samples (n=6) were retrieved from a deep freezer after three freeze/thaw cycles according to clinical protocol. Samples were stored at –10 to –30oC in three cycles of 24, 36, and 48 h. In addition, the long-term stability of AQ in QC samples was also evaluated after 92 days of storage at –10 to –30oC. Post spiked stability was studied following a 50 h storage period in the auto sampler tray. Bench top stability was studied for a 42 h period. Stability samples were processed and extracted along with the freshly spiked calibration curve standards. The precision and accuracy for the stability samples must be within 15 and ±15%. Analysis of Rat Samples The validated method has been successfully used to quantify atovaquone concentrations in rat plasma. The study was conducted according to current GCP guidelines. Before conducting the study it was also approved by an authorized animal ethics committee. There was a total of 10 blood collection time points including the predose sample (0.25, 1, 2, 4, 10, 21, 33, 45, 117, 213 hr). The blood samples were collected in separate vacutainers containing K2EDTA as an anticoagulant. The plasma from these samples was separated by centrifugation at 3000 rpm within the range of 2–8 °C. The plasma samples thus obtained were stored at –30°C until analysis. Post analysis the pharmacokinetic parameters were computed using WinNonlin® software version 5.2.
207
Scholar Research Library
B. R. Challa et al Der Pharmacia Lettre, 2013, 5 (1):205-214 _____________________________________________________________________________ RESULTS AND DISCUSSION
Method Development and Validation The goal of this research is to develop and validate a simple, selective, sensitive, rapid, rugged and reproducible assay method for the quantitative determination of AQ from plasma samples. In the way to develop a simple and easy applicable method for AQ assay in Rat plasma for pharmacokinetic study, UPLC with UV detection was selected as the method of choice, Chromatographic Optimization and Extraction optimization to be optimized carefully to achieve the best results. The UPLC optimization was performed by direct infusion of solutions of both AQ and AQIS into the UPLC chamber. Other parameters, such as the UV region optimization, Chromatographic conditions, especially, selection of column, composition and nature of the mobile phase were optimized through several trials to achieve best resolution and increase the signal of AQ and AQIS. Separation was tried using various combinations of mobile phase with variety of columns. After that, the mobile phase was changed from more aqueous phase to organic phase to obtain a fast and selective LC method. A good separation and elution were achieved using 0.1% formicacid: methanol (20:80 v/v) as the mobile phase, at a flow-rate of 0.2mL/ min and injection volume of 10µl. Chromatographic analysis of the analyte and IS was initiated under isocratic conditions with an aim to develop a simple separation process with a short run time. A simple LLE technique was used in the extraction of AQ and AQIS from the plasma samples.
208
Scholar Research Library
B. R. Challa et al Der Pharmacia Lettre, 2013, 5 (1):205-214 _____________________________________________________________________________ Selectivity and Specificity Chromatograms obtained from plasma spiked with AQ (50.0 ng /ml) and AQIS (10.0 µg /ml) are shown in Fig 2 and plasma spiked with AQ (10000.0 ng /ml) and AQIS (10.0 µg /ml) are shown in Fig 3. The analysis of AQ and AQIS was highly selective with no interfering compounds [Fig 4], [Fig 5].
Limits of Quantification (LOQ) and Detection(LOD) The LOQ and LOD was found for this method is 50.00 ng/ mL100 p.g with S/N above 16.5 at the LOQ and above 3 at the LOD. Linearity, Precision and Accuracy Calibration curves were plotted as the instrument response (peak area ratio AQ/AQIS) versus AQ concentration. Calibration was found to be linear over the concentration range of 50.0 – 10000.0 ng/ml. The RSD’s was less than 4.1% and the accuracy ranged from 98.8 to 100.8 %. The determination coefficients (r2) were greater than 0.9981 for all curves. These results indicate adequate reliability and reproducibility of this method within the analytical range (Table 1).
209
Scholar Research Library
B. R. Challa et al Der Pharmacia Lettre, 2013, 5 (1):205-214 _____________________________________________________________________________
Precision and accuracy for this method were controlled bySS calculating the intra and inter-batch variations at three concentrations (150.00, 3000.00 and 7000.00 ng/ml) of QC samples in six replicates. As shown in Table 2 intra and inter-day precision within 1.4 to 2.8 and 5.2 to 6.4 % and accuracy within 96.5 to 100.4% and 99.1 to 101.5% for AQ.
210
Scholar Research Library
B. R. Challa et al Der Pharmacia Lettre, 2013, 5 (1):205-214 _____________________________________________________________________________
Stability (Freeze - thaw, Auto sampler, Bench top, Long term) Quantification of the AQ in plasma subjected to 3 freeze-thaw (-30oC to room temperature) cycles show the stability of AQ. No significant degradation of the AQ was observed even after 50 h storage periods in the auto sampler tray and the final concentrations of AQ was between 98.1 to 98.4 %. In addition, the long-term stability of AQ in QC samples after 92 days of storage at -30oC was also evaluated. The concentrations ranged from 102.1 to 103.5% of the theoretical values. These results confirmed the stability of AQ in Rat plasma for at least 92 days at -30oC. The bench top stability 42 h was proved for AQ with concentrations ranged from 103.1 to 106.6% (Table-3). Recovery The extraction recoveries of AQ were determined at three different concentrations 150.00, 3000.00 and 7000.00 ng /ml, were found to be 76.85 ± 7.66, 74.48 ± 5.02 and 75.18 ± 2.26 %, respectively. The overall average recoveries of AQ and AQIS were found to be 75.50 ± 4.98 and 69.73 ± 4.54% respectively.
211
Scholar Research Library
B. R. Challa et al Der Pharmacia Lettre, 2013, 5 (1):205-214 _____________________________________________________________________________
Application to Biological samples The validated method has been successfully applied to quantify darifenacin concentrations into a single-dose (4.5 mg/200g) in rats. Male Sprague-Dawley rats were obtained from Bioneeds, Bangalore. After i.v administration of drug via left femoral vein 0.2 ml of blood samples for analytical determinations were collected via the right femoral vein at specific time intervals for 213 h. Plasma samples were stored at −30 ◦C until analysis. The study was carried out after approval from an independent animal ethics committee. The pharmacokinetic parameters evaluated were Cmax (maximum observed drug concentration during the study), AUC0-213(area under the plasma concentration– time curve measured 213 hours, using the trapezoidal rule), Tmax (time to observe maximum drug concentration), Kel (apparent first order terminal rate constant calculated from a semi-log plot of the plasma concentration versus time curve, using the method of least square regression) and T1/2 (terminal half-life as determined by quotient 0.693/Kel). Pharmacokinetic details were shown in Table 4. The mean concentration versus time profile of darifenacin in rat plasma is shown in Fig.6.
212
Scholar Research Library
B. R. Challa et al Der Pharmacia Lettre, 2013, 5 (1):205-214 _____________________________________________________________________________ Table.4. Mean pharmacokinetic parameters of Atovaquone in rat plasma after intravenous administration of 4.5mg/200g male rat. Pharmacokinetic Atovaquone Parameter AUC0-t (ng · h/ml) 304419.1 Cmax (ng/ mL ) 2647.019 AUC0-∞ (ng · h/ml) 379213.8 Kel (h_1) 0.00750 Tmax (h) 0.25 Thalf (h) 92.42385 AUC0—∞: area under the curve extrapolated to infinity; AUC0—t: area under the curve up to the last sampling time; Cmax: the maximum plasma concentration; Tmax: the time to reach peak concentration; Kel: the apparent elimination rate constant.
CONCLUSION The Bio analytical method was developed and validated for the quantitative determination of Atavaquone in rat plasma samples by UPLC. This method demonstrated that drug and internal standard were eluted within 6 minutes with a total runtime of 8 minutes. This method demonstrates most simple, sensitive, selectivity, rugged and reproducible. The developed method was successfully applied in the pharmacokinetic study to evaluate plasma concentration of atovaquone in healthy male rats. Acknowledgements Authors wish to thank the support received from IICT (Indian institute of chemical technology) Hyderabad, India for providing Literature survey, Manipal accunova, Manipal, India for providing clinical samples, research support. REFERENCES [1]. http://www.rxlist.com/malarone-drug.htm [2]. http://www.drugbank.ca/drugs/DB01117 [3]. Nosten F, McGready R, d'Alessandro U, Bonell A, Verhoeff F, Menendez C, Mutabingwa T, Brabin B.( 2006). Curr Drug Saf. :1(1):1-15. [4]. Sek L, Boyd BJ, Charman WN, Porter CJ. (2006) J Pharm Pharmacol. :58(6):809-20. [5]. McGready R, Stepniewska K, Edstein MD, Cho T, Gilveray G, Looareesuwan S, White NJ, Nosten F.( 2003). Eur J Clin Pharmacol. :59(7):545-52. [6]. Ling J, Baird JK, Fryauff DJ, Sismadi P, Bangs MJ, Lacy M, Barcus MJ, Gramzinski R, Maguire JD, Kumusumangsih M, Miller GB, Jones TR, Chulay JD, Hoffman SL; (2002). Clin Infect Dis. :35(7):825-33. [7]. Gurule S, Goswami D, Khuroo AH, Monif T. (2010). Biomed Chromatogr. :24(5):497-505. [8]. Bergeron A, Furtado M, Garofolo F. (2009). Rapid Commun Mass Spectrom.: 23(9): 1287-97. [9]. Lindegarth N, Funding L, Bergqvist Y. (2001). J Chromatogr B Biomed Sci Appl.: 758(2): 137-44. [10]. Lindegårdh N, Bergqvist Y. (2000). J Chromatogr B Biomed Sci Appl.: 744(1): 9-17. [11]. Bergqvist Y, Hopstadius C. (2000). J Chromatogr B Biomed Sci Appl.: 741(2): 189-93. [12]. Hannan SL, Ridout GA, (1996). J Chromatogr B Biomed Appl.: 678(2): 297-302. [13]. Studenberg SD, Long JD, Woolf JH, Bruner CJ, Wilson D, Woolley JL. (1995). J Pharm Biomed Anal.: 13(11): 1383-93. [14]. DeAngelis DV, Long JD, Kanics LL, Woolley JL. (1994). J Chromatogr.: 652(2): 211-9. [15]. Hansson AG, Mitchell S, Jatlow P, Rainey PM. (1996). J Chromatogr B Biomed Appl.: 675(1): 180-2. [16]. De Aguiar PF, Vander Heyden YV, Van Oost Y, Coomber TJ, Massart DL. ( 1997). J Pharm Biomed Anal.: 15(11): 1781-7. [17]. Guidance for industry: bioanalytical method validation, U.S. Department of Health and Human Services, Food and Drug Administration, Center for Drug Evaluation and Research (CDER), Center for Biologics Evaluation and Research (CBER), May 2001 [18]. Guidance for industry Food- effect bio availability and Fed Bio equivalence studies. U.S Department of Health and Human services Food and Drug Administration Centre for Drug Evaluation and research (CDER) December 2002.
213
Scholar Research Library
B. R. Challa et al Der Pharmacia Lettre, 2013, 5 (1):205-214 _____________________________________________________________________________ [19] Guidance for industry Bio availability and Fed Bio equivalence Studies for Orally Administered Drug ProductsGeneral considerations U.S.Department of Health and Human services Food and Drug Administration Centre for Drug Evaluation and research (CDER) March 2003.
214
Scholar Research Library