For statistical language model training, tar- get task matched ... We propose a method of selecting the training set by selecting a ..... This test compared the auto-.
Method of Selecting Training Sets to Build Compact and Efficient Statistical Language Model Keiji Yasuda†,‡ , Hirofumi Yamamoto†,‡ and Eiichiro Sumita†,‡ † National Institute of Communications Technology ‡ ATR Spoken Language Translation Research Laboratories 2–2–2, Hikaridai, “Keihanna Science City”, Kyoto, 619–0288 Japan {keiji.yasuda,hirofumi.yamamoto,eiichiro.sumita}@nict.go.jp
Abstract For statistical language model training, target task matched corpora are required. However, training corpora sometimes include both target task matched and unmatched sentences. In such a case, training set selection is effective for both model size reduction and model performance improvement. In this paper, training set selection method for statistical language model training is described. The method provides two advantages for training a language model. One is its capacity to improve the language model performance, and the other is its capacity to reduce computational loads for the language model. The method has four steps. 1) Sentence clustering is applied to all available corpora. 2) Language models are trained on each cluster. 3) Perplexity on the development set is calculated using the language models. 4) For the final language model training, we use the clusters whose language models yield low perplexities. The experimental results we obtained indicate the language model trained on the data selected by our method gives lower perplexity on an open test set than a language model trained on all available corpora.
1
Introduction
Language-model technology plays one of the most important roles in natural language processing such as automatic speech recognition (ASR), machine
31
translation (MT), and morphological analysis. Statistical language models are trained on a language corpus, and there are two main factors contributing to their performance. The first is the quality of the corpus, and the second is its quantity. A corpus that has similar statistical characteristics to the target domain is expected to yield a more efficient language model, which improves quality. However, domain-mismatched training data could reduce the language model’s performance. A large training corpus obviously produces better quality than a small one. However, increasing the size of the training corpus causes another problem, which is increased computational processing load. This problem not only affects the training of the language model, but also its applications, such as statistical machine translation (SMT) or ASR. The reason for this is that a large amount of training data tends to yield a large language model and applications then have to deal with this model. We propose a method of selecting the training set by selecting a number of appropriate training sentences from a training corpus to solve the problem of an expanded language model with increased training load. This method enables an adequate training set to be selected from a large corpus using a small indomain development set and the sentence clustering method (Carter, 1994). We can make the language model compact without degrading performance because this method effectively reduces the size of the set for training the language model. This compact language model can outperform a language model trained on the entire original corpus. This method is especially effective for domains
where it is difficult to enlarge the corpus, such as in spoken language corpora (Kikui et al., 2003). The main approach to recovering undersupply of indomain corpus has been to use very large domainclose or out-of-domain corpus for the language model training (NIST, 2006). In such case, the proposed method effectively reduces size of the training set and language model. Section 2 describes the method of selecting the training set. Section 3 details the experimental results for selecting the training set using TC-STAR data. This section describes how we evaluated our method from several points of view, such as test-set perplexity and language-model size. In addition to Section 3, Section 4 presents experiments applied to statistical machine translation using the language model we obtained with the proposed method. Section 5 discusses the parameter settings for sentence clustering. Section 6 concludes the paper.
2
Method
We use a small in-domain development set and a large corpus in our method, and it selects a number of appropriate training sentences from the corpus. The development set must only consist of indomain text. However, the corpus is not limited in this way. Figure 1 is a flow diagram of the method. A large corpus is divided into m sub-corpora using an entropy-reduction-based sentence-clustering method (Carter, 1994). The procedure is as follows: 1. The number of clusters (m) is given by the user. 2. Sentences are randomly assigned to one cluster. 3. A language model (inter-clustering language model) is created for each cluster using the sentences belonging to each. The entropy of the sentences in each cluster is calculated using its own language model. The total entropy (Htotal ) is defined by
Htotal =
ni m ∑ ∑
log Pinter (Sij |Ci )
(1)
i=1 j=1
where Pinter is the probability given by the inter-clustering language model, Ci is the i-th cluster, ni is the number of sentences in Ci , and Sij is the j-th sentence of Ci . 4. Each of the sentences in each cluster is moved to yield the smallest Htotal . Execute Step 3 to find the smallest Htotal for each movement of one sentence. (Inter-clustering language models are updated corresponding to the movement of one sentence. Also, Htotal is calculated using the updated inter-clustering language models.) 5. This process is repeated until the reduced entropy is smaller than the given threshold. We set the language model order to one for the clustering process to reduce the computational load during iterations. The language models on each cluster were trained after this process was finished. We called these models “post-clustering language models” (LMpost in Fig. 1). We calculated the perplexity for the development set (P P devi ), using each post-clustering language model, as P P devi =
n∏ dev
−N1
Ppost (S devj |Ci )
dev
(2)
j=1
where Ppost is the probability given by the postclustering language model, Ci is the i-th cluster, S devj is the j-th sentence in the development set, and ndev is the number of sentences and Ndev is the number of words in the development set. The training set was selected based on these perplexities. We sorted out clusters that yielded low perplexity. We then built the final training set by concatenating the selected clusters. We have called the language model trained on the final training set “the final language model” in this paper. This language model has been notated by LMf inal in Fig. 1.
3 Experiments We describe the experiments we carried out with our method after this. In this section, we evaluated the language model using test-set perplexity.
32
LMpost 1
Train LM
LMpost i
Train LM
LMpost m
…
Train LM
Sentence clustering
Cluster i
…
Large language corpus
Cluster m
LMfinal
Calculate perplexity on development set using each LMpost i. Then, select clusters with low LM perplexity
Cluster 1
Dev. set
Concatenate selected clusters and train LM Figure 1: Framework of method.
3.1 Experimental Conditions We used data from the Chinese-to-English translation track of the TC-STAR third evaluation campaign (ELDA, 2007) for the experiments. Most of the data are from the LDC corpus (LDC, 2007). Details on the data are listed in Table 1. We set the number of clusters (m) to 10 for the sentence clustering explained in Section 2. We used a Good-Turing (Good, 1953) 3-gram language model to train the post-clustering language models. 3.2 Experimental Results 3.2.1 Development Set Perplexity of Post-clustering Language Models Figure 2 is a bar graph of development-set perplexities calculated with the post-clustering language models. The vertical axis represents the development-set perplexity, and the horizontal axis represents rank of the perplexities. We can see the development-set perplexities of the post-clustering language models vary from cluster to cluster. The lowest perplexity is 448, and the highest is 5504. 3.2.2 Test Set Perplexity Comparison with Baseline Method Figure 3 plots the test-set perplexity (P Ptest ) calculated by
33
P Ptest =
n∏ test
−N 1
Pf inal (S testi )
test
(3)
i=1
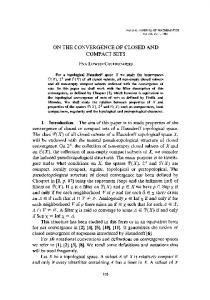
where Pf inal is the probability given by the final language model, S testi is the i-th sentence in the test set, and ntest is the number of sentences and Ntest is the number of words in the test set. The vertical axis in Fig. 3 represents the test-set perplexity, and the horizontal axis indicates the normalized test-set size. We normalized the size of the training set to obtain the latter acquired by the number of words in the original large corpus (382 m words), which is listed in Table 1. The closed circles with the bold line plot the results with our method. (For example, the second closed circle from the left indicates the test-set perplexity calculated with the language model, which was trained on the concatenated texts of the top two ranked clusters plotted in Fig. 2.) However, the open circles on the dotteddashed line plot the results for selecting a random training set. We regarded this as the baseline. We randomly selected the training set from the original large corpus to obtain these results. The size of the randomly selected training set was changed from 0.1 to 0.9. Here, we carried out three random-selection
Table 1: Experimental conditions for selecting language-model training set. Data type
Size (# of English word)
Large corpus (monolingual)
382 m
Development set
17 k
Test set
45 k
Explanation English corpus from LDC (LDC2002E18, LDC2003E07, LDC2003T17, LDC2004T07, LDC2005T06, LDC2003E14, LDC2004E12, LDC2004T08, LDC2005T10, and part of LDC2005T12) English Translation of Chinese version of "Voice of America" broadcast news (Two translations per sentence) English Translation of Chinese version of "Voice of America" broadcast news (Two translations per sentence)
6000
360 Random 340 10 clusters
Test set perplexity
Dev. set perplexity
5000
4000
3000
320
300
280
260
2000 240
1000 220 0
0.1
0.2
0.3
0.4
0.5
0.6
0.7
0.8
0.9
1
0 Normalized training set size
1
2
3
4
5
6
7
8
9
10
Figure 3: Test-set perplexities calculated with our method and baseline random selection.
Rank order of dev. set perplexity
Figure 2: Development-set perplexities calculated using post-clustering language models.
trials on each size, and averaged the test-set perplexities.
4 Application for Statistical Machine Translation We carried out statistical machine translation experiments using the language models obtained with the proposed method to check how effective it was in actual applications. 4.1 Framework
Random selection has a reasonable curve in the figure. That is, an increase in the size of the training set improves the performance of the language model. Our method, on the other hand, yields a totally different curve. The test-set perplexity falls sharply to the lowest point, where the normalized training-set size is 0.4. A slight increase occurs when the size is greater than 0.4. A comparison of the lowest point of perplexity with our method to the baseline revealed a 12% reduction in the test-set perplexity and a 60% reduction in the size of the training set.
34
We employed a log-linear model as a phrase-based statistical machine translation framework. This model expresses the probability of a target-language word sequence (e) of a given source language word sequence (f ) given by ) (∑ M λ h (e, f ) exp i i i=1 ) (4) (∑ P (e|f ) = ∑ M ′ i=1 λi hi (e , f ) e′ exp where hi (e, f ) is the feature function, λi is the feature function’s weight, and M is the number of fea-
Table 2: Experimental conditions for statistical machine translation experiments. Data type
Size
Bilingual corpus
0.2
6.7
0.198
6.68
0.196
6.66
0.194
6.64
NIST socre
BLEU score
Test set
Explanation Bilingual corpus from LDC (LDC2002E18, LDC2003E07, LDC2003T17, 156 m LDC2004T07, LDC2005T06, LDC2003E14, LDC2004E12, (# of English words) LDC2004T08, LDC2005T10) 608 Chinese version of "Voice of America" broadcast news (Two (# of Chinese sentences) reference translations per sentence)
0.192 0.19 0.188
6.62 6.6 6.58 6.56
0.186 6.54
0.184 6.52
0.182 6.5
0.18 0
0
0.1
0.2
0.3
0.4
0.5
0.6
0.7
0.8
0.9
0.1
0.2
0.3
0.4
0.5
0.6
0.7
0.8
0.9
1
1
Normarized training set size
Normalized training set size
Figure 4: Results of statistical machine translation experiments (BLEU score). tures. We can approximate Eq. 4 by regarding its denominator as constant. The translation results (ˆ e) are then obtained by eˆ(f, λM 1 ) = argmaxe
M ∑
λi hi (e, f )
(5)
i=1
Figure 5: Results of statistical machine translation experiments (NIST score). 4. Lexical weighting probability from source target to language weight = 0.2) 5. Phrase penalty (weight = 0.2) 6. Word penalty (weight = −1.0) 7. Distortion weight (weight = 0.5)
4.2 Experimental Conditions
8. Target language model probability (weight = 0.5)
4.2.1 Features We used eight features (Och and Ney, 2003; Koehn et al., 2003) and their weights for the translations. 1. Phrase translation probability from source language to target language (weight = 0.2) 2. Phrase translation probability from target language to source language (weight = 0.2) 3. Lexical weighting probability from source language to target language (weight = 0.2)
35
According to a previous study, Minimum Error Rate Training (MERT) (Och, 2003), which is the optimization of feature weights by maximizing the BLEU score on the development set can improve the performance of a system. However, the range of improvements is not stable because the MERT algorithm uses random numbers while searching optimum weights. As previously mentioned, we used fixed weights instead of weights optimized by MERT to remove its unstable effects and simplify evaluation.
4.2.2 Language Model
Table 3: Language model size.
We used a modified Kneser-Ney (Chen and Goodman, 1998) 3-gram language model for the experiments explained in this section because modified Kneser-Ney smoothing tended to perform better than the Good-Turing language model in this translation task.
Normalized n training-set size 1 0.4 2 3 1 1.0 2 3
gram # of entries gram gram gram gram gram gram
704 K 12 M 12 M 1509 K 23 M 27 M
4.2.3 Corpus We used the bilingual data listed in Table 2 for the statistical machine-translation experiments to train the translation model. We first aligned the bilingual sentences for preprocessing using the Champollion tool (Ma, 2006). We then segmented Chinese words using Achilles (Zhang et al., 2006). We used the preprocessed data to train the phrase-based translation model using GIZA++ (Och and Ney, 2003) and PHARAOH tools (Koehn et al., 2003). For the language model training, we used the data listed in Table 1. 4.3 Experimental results Figures 4 and 5 plot the results for the statistical machine translation experiments that used the final language model obtained with our method. The horizontal axis is the same as that in Fig. 3, and the vertical axis represents the automatic metric of translation quality (BLEU score (Papineni et al., 2002) in Fig. 4, and NIST score (NIST, 2002) in Fig. 5). Hence, higher automatic scores indicate better translations; the point where the normalized training-set size is 0.4 indicates the best translation quality. This point is the same as the lowest perplexity point in Fig. 3. We carried out the test proposed by Zhang et al. (Zhang and Vogel, 2004) to confirm whether there were significant improvements in the automatic scores. This test compared the automatic scores where the normalized training-set sizes were 0.4 and 1.0. The test1 revealed a significant improvement in the BLEU score when the confidence level was 0.85, and that in the NIST score when the confidence level was 0.95. Table 3 lists the sizes of the language models under these conditions. As the table indicates, our method reduced the sizes of the models by 50%. 1
We sampled 2000 times in the test.
36
This reduction had a positive effect on the computational load of decoding.
5 Discussions We set the number of clusters to 10 in the previous section without providing any rationale for this. Here, we discuss the relationship between the number of clusters and how effectively training sets were selected. Figure 6 plots the results for our selection of the training set when there were 5, 10, 30, and 50 clusters. Both the vertical and horizontal axes are the same as those in Fig. 3. As the figure indicates, the lowest-test-set perplexity points for the four cases are always around 0.4 of the size of the normalized test set. A comparison of the four points reveals that m = 10 has the lowest perplexity and that m = 5 has the second lowest. However, we still obtain improvements even if m = 30 or 50 when we compare them with the results when the size of the normalized training set is 1.0. As previously mentioned, 10 clusters are the best in the experimental setting described in this paper. However, the best value may not only be influenced by the size of the corpus but also other characteristics of the corpus. We still need to conduct further studies to clarify the relationship and to find the best way of determining the optimal number of clusters.
6 Conclusions We proposed a method of selecting training sets for training language models that drastically reduced the sizes of language models and the training set. It simultaneously improved the performance of the model. We carried out experiments using data from the Chinese-to-English translation track of TC-STAR’s third evaluation campaign. The experimental results
P. Koehn, F. J. Och, and D. Marcu. 2003. Statistical Phrase-Based Translation. Proc. of Human Language Technology Conference of the North American Chapter of the Association for Computational Linguistics (HLT-NAACL), pages 127–133.
360
5 clusters 10 clusters 30 clusters 50 clusters
Test set perplexity
340
320
LDC. 2007. Linguistic Data Consortium. http://www.ldc.upenn.edu/.
300
280
X Ma. 2006. Champollion: A Robust Parallel Text Sentence Aligner. In Proc. of international conference on Language Resources and Evaluation (LREC), pages 489–492.
260
240
220 0
0.1
0.2
0.3
0.4
0.5
0.6
0.7
0.8
0.9
1
Normalized training set size
Figure 6: Test set perplexity by method with several numbers of clusters. indicated that our method reduced the size of the training set by 60% and test-set perplexity by 12%. The language model obtained with the method also produced good results with SMT applications. Our experimental results demonstrated that an SMT system with a half-size language model obtained with our method improved the BLEU score by 0.0037 and the NIST score by 0.0842.
References D Carter. 1994. Improving Language Model by Clustering Training Sentences. In Proceedings of the Annual Meeting of the Association for Computational Linguistics (ACL), pages 59–64. S. F. Chen and J. Goodman. 1998. An empirical study of smoothing techniques for language modeling. In Technical report TR-10-98, Center for Research in Computing Technology (Harvard University). ELDA. 2007. TC-STAR: Technology and Corpora for Speech to Speech Translation. http://www.elda.org/en/proj/ tcstar-wp4/tcs-run3.htm. I. J Good. 1953. The population frequencies of species and the estimation of population parameters. Biometrika, 40(3):237–264. G. Kikui, E. Sumita, T. Takezawa, and S. Yamamoto. 2003. Creating corpora for speech-to-speech translation. In Proceedings of EUROSPEECH, pages 381– 384.
37
NIST. 2002. Automatic Evaluation of Machine Translation Quality Using N-gram Co-Occurence Statistics. http://www.nist.gov/speech/tests/mt/ mt2001/resource/. NIST. 2006. The 2006 NIST Machine Translation Evaluation Plan (MT06). http://www.nist.gov/speech/tests/mt/ doc/mt06 evalplan.v3.pdf. F. J. Och and H. Ney. 2003. A Systematic Comparison of Various Statistical Alignment Models. Computational Linguistics, 29(1):19–51. F. J. Och. 2003. Minimum Error Rate Training for Statistical Machine Translation. Proc. of the 41st Annual Meeting of the Association for Computational Linguistics, pages 160–167. K. Papineni, S. Roukos, T. Ward, and W.-J. Zhu. 2002. Bleu: a method for automatic evaluation of machine translation. In Proceedings of the 40th Annual Meeting of the Association for Computational Linguistics (ACL), pages 311–318. Ying Zhang and Stephan Vogel. 2004. Measuring confidence intervals for the machine translation evaluation metrics. In Proceedings of The 10th International Conference on Theoretical and Methodological Issues in Machine Translation. R. Zhang, G. Kikui, and E. Sumita. 2006. Subwordbased Tagging by Conditional Random Fields for Chinese Word Segmentation. Proc. of the North American Chapter of the Association for Computational Linguistics (NAACL), Short Paper:193–196.