Icons, widely used in computer programs, are part of the Graphical User Interface. (GUI) ..... (M = 948.90 vs. .... Apple Computer Inc., 2006; Microsoft Corp., 2006).
Icon-function relationship in toolbar icons
Published on the journal Displays, 29, 521-525. . Stefano Passini°, Filiberto Strazzari, Anna M. Borghi° University of Bologna
Icon-function relationship in toolbar icons Abstract Icons, widely used in computer programs, are part of the Graphical User Interface (GUI). They facilitate computer use regardless of users’ level of expertise. The authors report the results of a study focused on measuring performance of computer users in correctly and quickly associating toolbar icons and the action they represent in GUI. The study aimed to investigate the relationships between the rapidity of icon-function detection by user and user expertise, nature of icon (object or symbol) and context (appropriate, inappropriate, neutral). Findings indicated a scarce variation for different levels of expertise in relation to symbols, but only for icons depicting real-world objects, an overall better performance for objects and no significant response to the context. The discussion suggests future investigations in the field and offers practical considerations for GUI designers.
Keywords: Icons, HCI, GUI, usability, concreteness.
1
Icon-function relationship in toolbar icons
2
Icon-function relationship in toolbar icons Every time we work with a computer program, we interact with a Graphical User Interface (GUI). We have become so accustomed to such interface elements that typically we do not notice them, at least not until something goes wrong. What happens when we are working with a word processing software and try to perform an action, but cannot find the appropriate menu item or icon? We might find ourselves wandering through a varied set of small icons, looking for something that recalls the action we are trying to perform. As users we interact through the use of a pointer with virtual objects that represent tasks, data, devices, etcetera. All those graphical elements we see on the computer screen can be activated by moving the pointer (i.e. a mouse) over the element of the interface and by clicking on it. This approach in computer use is called “pointand-click” and stands at the base of Graphical User Interfaces (GUIs). GUIs, the most important instruments of Human Computer Interaction, represent the information and actions available to the user. They make it easier for people to work with computer software regardless of their computer skills. GUIs are composed of pointers (graphical images that indicate the location of a pointing device such as a mouse), menus (which permit the user to execute commands by choosing options from a hierarchical list of choices), windows (areas on the screen dedicated to a specific task or a piece of information), toolbar icons (sets of small pictures that represent commands) and icons (small pictures representing a program or a data file). In this paper we will focus on toolbar icons and will refer to them simply as “icons”.
Icon-function relationship in toolbar icons
3
The use of icons represents the most common and easiest way to interact with a computer. This is mainly because they transcend language barriers and represent meaning in a condensed form (Gittens, 1986; Horton, 1994). In general, the use of pictorial images for communication has several advantages. Pictures are processed faster than words (Pellegrino et al., 1977) and information is conveyed more directly through the use of images (Walker et al., 1965). For these reasons, icons have, since their birth in the 1970s at the Xerox Palo Alto Research Center facility, been developed as an instrument for making computer interfaces easier for novices to grasp. Currently, they are a primary graphical element of all computer programs. Recent psychological and ergonomic studies have focused mainly on two aspects of icons: their graphical properties and the way in which icons are processed and detected. Regarding graphical aspects, McDougall et al.(1999, 2000, 2001) found three properties to be of primary importance in the measurement of icons: concreteness, distinctiveness and complexity. Concreteness refers to the degree to which an icon could be considered concrete or similar to its real-world counterpart. Distinctiveness refers to the time taken to distinguish and find an icon in a display (therefore it is contingent on the nature of the context and visual display in which the icon is located). Complexity is the amount of detail or intricacy within the icon itself. In general, concreteness is considered important in providing meaning to the user; it’s relevant to the initial understanding of the icon (Guastello et al., 1989; McDougall et al., 2000). Namely, as McDougall and colleagues (2000) demonstrated, concrete icons (objects) are unlikely to enhance usability if users are experienced, and more abstract icons (symbols) may elicit faster responses than icons offering more concrete representations (Arend, et al., 1987; McDougall et al.,
Icon-function relationship in toolbar icons
4
2000). Thus, according to McDougall et al. (2000), concrete icons can be useful when icon learning needs to occur quickly or when icons are encountered infrequently. Accordingly, it seems that GUI designers should prefer simplicity over complexity and concreteness; that is, they should use very simple abstract icons. A shortcoming of studies such as those we report is that icons were not analysed in the natural context of computer use. No real computer icons were used and, above all, they were not associated with real tasks in computer use. Understanding which icons are immediately related to a specific function in a user's mind should play a crucial role in promoting more user-friendly GUI development. Namely, we believe that in the context of a specific human-computer interaction, the use of icons representing real-world objects can lead to less ambiguous interpretations as compared to abstract icons such as arrows or other symbols because they more easily evoke the functions they are associated with. This is supported by recent studies on usability (Norman, 1998, 2001; Nielsen, 1999) demonstrating that designers should pay more attention to the user-conceptual models of functioning and to conventions of computer use than to standards not directly related to computing. As far as icon processing and detection are concerned, research has focused in particular on the effect of icon spacing and size (Lindberg and Näsänen, 2003), the effect of image contrast and sharpness (Näsänen and Ojanpää, 2003), the effect of display characteristics (Shieh and Ko, 2005), the effect of user's age (Lindberg et al., 2006), of user’s culture and language (Onibere et al., 2001) and of visual acuity (Jacko et al., 2000). In general, a better distinctiveness of icons, in terms of spacing, size and sharpness, allows users to detect their purpose faster. In comparison with these studies,
Icon-function relationship in toolbar icons
5
our research goes one step further: rather than focusing on the mechanisms of icon detection or recognition, we aim at analyzing the capability of icons to represent their function and to convey their meaning to the user. The “point-and-click” approach in computer use is by far the easiest, most usable and fastest approach, but it requires graphical elements (above all icons) that can almost immediately communicate a specific meaning to the user. Our study focused on the meaning of icons, and in particular on icons from existing and commonly-used software packages in the context of everyday computer use. In addition, we intended to study the long-term effects of users’ computer expertise on correct icon-function identification. The level of expertise influences performance and increases rapidity in the association between the icon and its function. Indeed, an experienced subject can more easily distinguished icons. Some studies (Guastello et al., 1989; Horton, 1994) have found that familiarity – whether the subject is familiar with what the object in the icon represents or not – and domain expertise – the user's knowledge about computer – increased the association of an icon to its function. Specifically, the following hypotheses were formulated: (1) experienced users detect an icon's function more correctly and faster then less experienced users; (2) the functions of icons representing real-world objects are detected more correctly and quickly then icons representing abstract symbols; (3) after the activation of an iconcongruent environment, icons and related functions are detected more efficiently.
Icon-function relationship in toolbar icons
6
Method Participants Twenty participants, ten women and ten men, took part in this experiment. They were all native Italian speakers, right handed, with normal or corrected-to normal vision. The average age was 24.35 years (SD = 4.66; range: 19–36). Among the 20 participants, 10 were computer experts (computer programmers and digital graphic designers), and 10 were novices (people that have used a computer occasionally for fewer 4 years). Apparatus The experiment was conducted using a common PC equipped with a colour monitor. Participants responded to experimental trials by pressing two keys with the left and right forefingers (the “correct”/“incorrect” key association was inverted for half of the participants). Trials were presented and reaction times were measured using e-Prime software (Schneider et al., 2002). Materials and Procedure All subject began by completing a questionnaire with questions about sex, age, past and present computer experience and skills. In particular, participants were asked for how many years they have been using computer (scores 1 = less then 1 year, 2 = 1-2 years, 3 = 3-5 years, 4 = 6-10 years, 5 = more then 10 years), for how many years they have been using internet (scores 1 = less then 1 year, 2 = 1-2 years, 3 = 3-5 years, 4 = 610 years, 5 = more then 10 years), how frequently they use a computer (scores 1 = never, 2 = occasionally, 3 = some times a week, 4 = one or more times a day, 5 = more
Icon-function relationship in toolbar icons
7
then 2 hours each day) and how they consider their computer knowledge (on a 7-point scale from 1 = not expert to 5 = expert). Then, participants were asked to perform a match task. Presented with a function label (an action to be performed with the computer, i.e. “save”) and then with an icon (i.e. a floppy disk), they were asked to detect whether or not the icon correctly matched the given action. Icons and functions were taken from existing and commonly used programs: Internet Explorer web browser, Office Word word processor and Outlook Express e-mail client. All icons were taken from Microsoft's Windows XP/Office 2003 homogeneous set and were all presented to participants in low resolution (common to toolbar icons). Icons varied in terms of icon type: both real-world objects (e.g., a printer) and abstract symbols (e.g., an arrow) were presented to participants. Before each experiment trial, a prime was presented to participants for 600 ms. The prime identified the context of the function and could be appropriate to the icon (i.e. a word processor page associated with a “save” action/icon), inappropriate (i.e. an e-mail client associated to “back” action/icon) or neutral (a grey screen). The function label was presented to participants for 500 ms. It was assumed that the 500 ms display is a sufficient time frame for reading and understanding the single word or two-word phrases that formed the function label (Coltheart and Rastle, 1994; Waters et al., 1984). All labels were written in Italian, mother tongue of all participants. Participants were first given 12 practice trials to get used to the experimental procedure. Then 16 function labels were randomly presented for the three contexts. For each of the three contexts the labels were presented twice, once with a correct and once with an incorrect icon, for a
Icon-function relationship in toolbar icons
total of 96 experimental trials. After every practice trial, the testing program let participants evaluate their performance in real-time by displaying a “wrong” or “right” message with response time in milliseconds. Both reaction times (RTs) and errors were recorded. All participants were informed that their response times would be recorded and invited to respond as quickly as possible while still maintaining accuracy. Each experiment lasted from 15 to 20 minutes. Experimental design A 3 within (prime/context of the function: appropriate, inappropriate, neutral) × 2 within (function-icon matching: correct, incorrect) × 2 within (icon type: object, symbol) × 2 between (participant expertise: expert, non-expert) experimental design was used. Two dependent variables were used to evaluate participants' performance in the function-icon matching: response time (RT) and accuracy in the response (errors). Results Firstly, an ANOVA between experts and novices was performed on the questions concerning past and present computer experience and skills. As a confirmation of the difference in expertise, the group of experts uses computer (M experts = 4.20; M novices = 3.00; F1, 18 = 17.05; p = .001) and internet (M experts = 3.40; M novices = 2.60; F1, 18 = 8.47; p = .009) from more years, uses computer more frequently (M experts = 4.90; M novices = 4.00; F1, 18 = 10.57; p = .004) and self-rates their computer knowledge as more expert (M experts = 5.00; M novices = 2.90; F1, 18 = 14.76; p = .001). No significant differences between the experimental groups’ gender distribution and age distribution on computer experience and skills emerged.
8
Icon-function relationship in toolbar icons
9
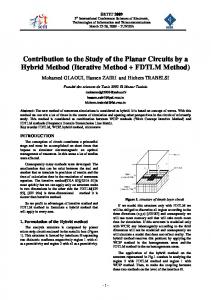
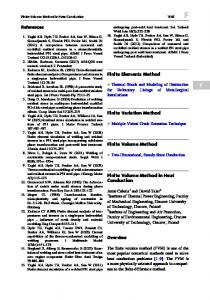
Analyses of RTs were performed only for correct responses. The analysis was based on the 3 (Context) × 2 (Matching) × 2 (Icon Type) × 2 (Expertise) ANOVA with repeated measures of the last factor. All analyses were conducted using a Type I error rate of .05. The main effect of Matching was significant due to the fact that participants responded faster when the function-icon matching was correct (M = 1022.97) than when it was incorrect (M = 1102.02) (F1, 18 = 11.53; Mse = 32528.52; p = .003). More interestingly, we also found an effect of the Icon Type with faster response times when the icon represented an object (M = 996.37) rather than a symbol (M = 1128.62), consistent with our second hypothesis (F1, 18 = 39.60; Mse = 26497.06; p = .001). In agreement with our first hypothesis, the interaction Expertise × Icon Type was significant (F1, 18 = 6.99; Mse = 26497.06; p = .02); Newman-Keuls post-hoc comparisons showed a difference between experts and non-experts only when the icon represented an object (see Figure 1) in which case experts responded faster than novices (M = 948.90 vs. M = 1043.84). There was no expertise-related difference when the icon was a symbol. The difference between objects and symbols (revealed by the main effect) was still present both for experts (p = .001) and non-experts (p = .02). --------------------------------------INSERT FIGURE 1 HERE------------------------------The interaction Matching × Icon Type was also significant (F1, 18 = 52.06; Mse = 25909.92; p = .001). Newman-Keuls post-hoc comparisons showed that participants responded faster and more accurately when an object was correctly associated with its function (M = 881.88) (see Figure 2). --------------------------------------INSERT FIGURE 2 HERE-------------------------------
Icon-function relationship in toolbar icons
10
Our third hypothesis did not receive confirmation, as the main effect of Context was not significant. A within-between ANOVA was performed on errors. The analysis revealed a main effect of Expertise (F1, 18 = 22.48; Mse = 8.49; p = .001), with experts more accurate than non-experts (Mexperts = 0.76, Mnon-experts = 2.54), consistent with the first hypothesis. In agreement with the RT analysis, the ANOVA revealed an effect of the Icon Type (F1, 18 = 5.14; Mse = 1.43; p = .04) due to the fact that participants made fewer errors when the icon represented an object (M = 1.48) than when it was a symbol (M = 1.83). The interaction Matching × Icon Type was significant (F1, 18 = 6.83; Mse = 1.18; p = .02). Newman-Keuls post-hoc comparisons showed that the difference between objects and symbols is significant only when the function-icon matching was correct, but not when it was incorrect (see figure 3). --------------------------------------INSERT FIGURE 3 HERE------------------------------No significant main effect was found both for Context and Matching. Then, qualitative analyses of RTs and errors on single icons was performed. As shown by Table 1, participants responded faster and more accurately (with fewer errors) when icons represented real-world objects rather than abstract symbols. --------------------------------------INSERT TABLE 1 HERE------------------------------The fastest RT was for “home” icon (M = 643.60) and the slowest was for “undo”, represented by a left-wards curving arrow (M = 1289.62). The few object icons that elicited longer RTs are the “copy” icon, the “paste” icon and the “print preview” icon, all of which, as we will discuss later, represent complex objects.
Icon-function relationship in toolbar icons
11
Discussion The purpose of this study was to evaluate how user expertise and how nature (object or symbol) and context (appropriate, inappropriate, neutral) of the icon influence the ability to correctly and quickly associate toolbar icons with the actions they represent. Our results clearly supported our first and second hypotheses, while the third hypothesis was not confirmed. In agreement with the first hypothesis, differences between experts and non-experts emerged concerning both RTs (but only relative to icons that represented objects) and accuracy. These results confirm that expertise has an influence upon the correctness and rapidity of responses in the function-icon matching task and emphasize the importance of long-term training in gaining familiarity with GUIs. Nevertheless, the results demonstrated that, in the case of symbol-icons, there was no significant difference in response times and errors for experts and non-experts, suggesting that objects evoke their intended meanings more clearly and directly, while functions of symbols are more ambiguous regardless of user expertise. In accordance with these results and with our second hypothesis, it appears that the use of icons depicting real-world objects rather than abstract symbols is preferable in GUI design for both experienced users and novices. Therefore, in apparent disagreement with previous studies (Arend et al., 1987; McDougall et al., 2000), it is of particular importance that concrete icons be used because they better fulfil the primary role of icons, which is to represent actions as clearly and efficiently as possible. Interestingly, the effect of icon concreteness is positive regardless of expertise.
Icon-function relationship in toolbar icons
12
Regarding icon complexity, Table 1 shows that some icons representing objects have long RTs similar to those of symbols. These objects are complex objects, representations composed of more than one object (“copy” is composed of two sheets of papers; “paste” is composed of a clipboard and a sheet of paper; “print preview” is composed of a magnifying glass on a sheet of paper). It is important to note that detected poor performance is probably not due to less frequent utilization of these icons: the “cut” icon is as rapidly associated with its meaning as other simple objects, but “copy” and “paste” are not, even if they belong to the same subset of commonly performed actions (“copy and paste” or “cut and paste” tasks). It could be argued that the poorer RTs linked to complex objects were a result of higher visual complexity (icon distinctiveness). However, there are good reasons to believe this is not the case. Consider, for example, the “print” icon (a printer): it is as complex as the “copy” icon as far as visual complexity is concerned. Thus, the difference in RTs and errors is most likely due to icon-function identification. The scarce or absent significance of the effect of the Context (or prime) is worth discussing. Our results suggest that for both expert and novice users, computer experience and the ability to adequately identify icons do not depend on the particular software being used. In user experience the entire computer is the environment and not its single components or programs. While novice participants confuse terms such as “computer”, “pc”, “windows”, “office”, expert users switch easily and rapidly from one program to another to perform complex tasks (i.e. finding information on-line, writing a document using that information and e-mailing the document to another person). In both cases, users do not pay significant attention to the program they are using because they
Icon-function relationship in toolbar icons
13
are focused on their goal; the means is the computer as a whole. This is in accordance with GUI-design guidelines provided by major software houses to application developers: the user experience of any application should be as consistent as possible with other applications and the operating system itself, providing a seamless experience and making it possible to comfortably move from application to application to perform complex tasks (cfr. Apple Computer Inc., 2006; Microsoft Corp., 2006) In general, the different speeds required to associate objects with their correspondent functions could serve as the basis of a suggestion that GUI designers refrain from using ambiguous abstract symbols when a real-world object is available. A printer does refer to printing despite context, but can you tell the function of a left-pointing arrow when it is not contextualised? In fact, the varying use of arrows for different functions forces the user, in the best-case scenario, to expend time and energy to interpret the message in its context, or, in the worst case, to make mistakes due to ambiguity. In order to create more concrete icons, reducing their complexity and increasing their distinctiveness by representing clear objects that refer directly and clearly to a function users can recognize from their real-world experience, designers need to be able to draw upon practical investigations. The findings also raised issues requiring further investigation on the differences in performance of icons depicting simple or complex objects, especially in relationship with resolution and picture details (distinctiveness) References Apple Computer Inc., 2006. Apple Human Computer Interface Guidelines. From: http://developer.apple.com.
Icon-function relationship in toolbar icons
14
Arend, U., Muthig, K-P., Wandmacher, J., 1987. Evidence for global feature superiority in menu selection by icons. Behaviour and Information Technology 6, 411-426. Coltheart, M., Rastle, K., 1994. Serial processing in reading aloud: Evidence for dualroute models of reading. Journal of Experimental Psychology: Human Perception and Performance 20, 1197-1211. Gittens, D., 1986. Icon-based human-computer interaction. International Journal of Man-Machine Studies 24, 519-543. Guastello, S. J., Traut, M., Korienek, G., 1989. Verbal versus pictorial representations of objects in a human-computer interface. International Journal of Man-Machine Studies 31, 99-120. Horton, W., 1994. The icon book: Visual symbols for computer systems and documentation. Wiley, New York. Jacko, J. A, Rosa, R. H., Scott, I. U., Pappas, C. J., Dixon, M. A., 2000. Visual Impairment: The Use of Visual Profiles in Evaluations of Icon Use in ComputerBased Tasks. International Journal of Human-Computer Interaction 12, 151-164. Lindberg, T., Nasanen, R., 2003. The effect of icon spacing and size on the speed of icon processing in the human visual system. Displays 24, 111-120. Lindberg, T., Nasanen, R., Muller, 2006. How age affects the speed of perception of computer icons. Displays 27, 170-177. Onibere, E.A., Morgan, S., Busang, E.M., Mpoeleng, D., 2001. Human–computer interface design issues for a multi-cultural and multi-lingual English speaking country – Botswana. Interacting with Computers 13, 497-512.
Icon-function relationship in toolbar icons
15
McDougall, S., Curry, M. B., de Bruijn, O., 1999. Measuring symbol and icon characteristics: Norms for concreteness, complexity, meaningfuiness, familiarity and semantic distance for 239 symbols. Behavior Research Methods, Instruments, Computers 31, 487-519. McDougall, S., de Bruijn, O., Curry, M. B., 2000. The Effects of Visual Information on Users’ Mental Models: An Evaluation of Pathfinder Analysis as a Measure of Icon Usability. International Journal of Cognitive Ergonomics 5, 59–84 McDougall, S., de Bruijn, O., Curry, M. B., 2000. Exploring the Effects of Icon Characteristics on User Performance: The Role of Icon Concreteness, Complexity, and Distinctiveness. Journal of Experimental Psychology: Applied 6, 291-306. Microsoft Corp., 2006. 2007 Microsoft Office System User Interface Design Guidelines. From: http://www.microsoft.com. Nasanen, R., Ojanpaa, H., 2003. Effect of image contrast and sharpness on visual search for computer icons. Displays 24, 137-144. Nielsen, J., 1999. Designing Web Usability: The Practice of Simplicity. New Riders Publishing, Thousand Oaks, CA. Norman, D.A., 1998. The Invisible Computer. MIT Press, Cambridge MA. Norman, D.A., 2001. The Design of Everyday Things. Basic Books, New York. Pellegrino, J. W., Rosinski, R., Chiesi, H., Siegel, A., 1977. Picture-word differences in decision latency: An analysis of single and dual memory models. Memory Cognition 5, 387-396.
Icon-function relationship in toolbar icons
16
Shieh, K. K., Ko, Y. H., 2005. Effects of Display Characteristics and Individual Differences on Preferences of VDT Icon Design. Perceptual and Motor Skills 100, 305-318. Schneider, W., Eschman, A., Zuccolotto, A., 2002. E-Prime reference guide. Psychology Software Tools Inc., Pittsburg. Walker, R. E., Nicolay, R. C. Stearns, C. R., 1965. Comparative accuracy of recognizing American and International road signs. Journal of Applied Psychology 49, 322–325. Waters, G. S., Seidenberg, M. S., .Bruck, M., 1984. Children's and adults' use of spelling-sound information in three reading tasks. Memory Cognition 12, 293-305.
Icon-function relationship in toolbar icons
Figure Captions Figure 1. The interaction Expertise & Icon Type (RTs). Figure 2. The interaction Matching & Icon Type (RTs). Figure 3. The interaction Matching & Icon Type (errors).
17
Icon-function relationship in toolbar icons
Table 1. Means of RTs and errors of each single icon. Icon
Icon function
Icon type
M RT
M errors
Home
Object
643.60
0.50
Print
Object
753.48
0.50
Save
Object
778.10
1.50
Cut
Object
787.61
0.50
Zoom
Object
808.95
1.17
Find
Object
891.78
1.67
Copy
Object
1036.29
1.50
Stop
Symbol
1048.32
2.67
Forward
Symbol
1056.87
2.33
Back
Symbol
1060.09
2.33
Paste
Object
1080.82
2.67
Trash
Symbol
1121.47
3.67
Refresh
Symbol
1127.07
2.17
Print preview
Object
1177.56
2.17
Answer
Symbol
1218.82
2.83
Undo
Symbol
1289.62
3.50
18
Icon-function relationship in toolbar icons
19
1200 RTss
1100 Object
1000
Symbol
900 800 Expert
Non-expert
Icon-function relationship in toolbar icons
20
1200
RTss
1100 Object
1000
Symbol
900 800 Correct
Incorrect
Icon-function relationship in toolbar icons
21
2,5
Errors Errors
2 1,5
Object Symbol
1 0,5 0 Correct
Incorrect