A novel approach to the runtime visualization and analy- sis of object-oriented programs is presented and illustrated through a prototype system called JIVE: ...
Methodology and Architecture of JIVE Paul Gestwicki and Bharat Jayaraman [pvg|bharat]@cse.buffalo.edu Department of Computer Science and Engineering University at Buffalo 201 Bell Hall, Box 602000 Buffalo, NY 14260-2000
Abstract A novel approach to the runtime visualization and analysis of object-oriented programs is presented and illustrated through a prototype system called JIVE: J ava I nteractive V isualization E nvironment. The main contributions of JIVE are: multiple concurrent representations of program state and execution history; support for forward and reverse execution; and graphical queries over program execution. This model facilitates program understanding and interactive debugging. Our visualization of runtime states clarifies the important point that objects are environments of execution. The history of object interaction is displayed via sequence diagrams, and in this way we help close the loop between design-time and run-time representations. Interactive execution is made possible by maintaining a runtime history database, which may be queried for information on variable behavior, method executions, and object interactions. We illustrate the capabilities of this system through examples. JIVE is implemented using the Java Platform Debugger Architecture and supports the Java language and libraries, including multithreaded and GUI applications.
1
Introduction
This paper presents several novel techniques for enhancing runtime comprehension of object-oriented programs. Object-oriented programs differ from procedural programs in two important ways: (i) objects are not just data structures, but serve as environments within which procedure activations take place; (ii) object-oriented programs engender the use of smaller methods, and more complicated interactions among objects result. Runtime comprehension is therefore enhanced by providing views of the object structure as well as the history of object interaction. Although these observations are fundamental, to our knowledge there is no visualization system for object oriented programs that realizes these basic criteria. According to our methodology, there are seven fundamental properties that a successful interactive visualization must exhibit, as we will explain. Just as graphical notations such as UML [Booch et al. 1999] clarify high-level relationships at design time, a graphical depiction of the relationships among objects and method activations at runtime is highly desirable [De Pauw et al.
1993]. The visualizations presented in this paper are applicable to object-oriented languages in general, but we focus on Java in particular. This demonstrates that our methodology can handle the nuances and complications of a generalpurpose programming language. We identify the following major requirements for a system that visualizes runtime states of Java: 1. Depict Objects as Environments. As noted earlier, the execution states of object-oriented programs differs fundamentally from those of procedural programs since an object is an environment within which method activations take place. There are several tools that clearly depict method call sequences and support inspection of objects’ internal details (see Section 2). However, these tools depict neither the overall object structure nor the method activations within these objects, and hence important relationships are missing in the visualization. 2. Provide Multiple Views of Execution States. The current execution state of the program should be observable at varying levels of granularity for better comprehensibility. The system should allow a user to view abstract, simplified relationships or to examine specific details of an inheritance hierarchy or complex data structure, for example. This flexibility allows the visualizations to be useful for both teaching and debugging, facilitating use by those with varied levels of experience. 3. Capture History of Execution and Method Interaction. The history of program execution should be observable using notations such as time-sequence or collaboration diagrams [Booch et al. 1999]. While these diagrams were motivated by program design considerations (to document the details of use cases), the ability to produce such diagrams at runtime helps close the loop between program design and program execution. Additionally, the visualization of program history should be interactive, allowing the user to select the point in program history that he or she wishes to view. For example, selecting a method activation in a sequence diagram should cause the visualization tool to show the execution state at which the method was called. 4. Support Forward and Backward Execution. It should be possible to interactively step forward or backward through program execution. This capability is especially important in debugging, since the occurrence of an error is usually detected after the point of error [Agrawal et al. 1993]. The user should also be allowed to decide the granularity of stepping, for example, through statement-level and method-level step sizes or by setting execution breakpoints. Moreover, these capabilities should also be supported for multithreaded programs.
5. Support Queries on the Runtime State. One of the most important requirements for program debugging is understanding how the variable values are changed. It should be possible to query the runtime state for properties of variables, such as when a variable changed or took a certain value. This requirement enforces the perspective of a queryable database of runtime states. 6. Produce Clear and Legible Drawings. The visualization environment should automatically arrange diagram components so as to clarify the object structure and method-calling sequence. Custom visualizations of commonly used types such as arrays, lists, and tables should be provided. Patterns inherent in the runtime structure, such as shapes of known data structures, should also represented in an intuitive manner. 7. Use Existing Java Virtual Machine. It is important for the visualization system to run on existing Java Virtual Machines (JVM) and not require a custom implementation of a Java interpreter. A custom JVM implementation will be hard-pressed to keep up with advances in Java technology; for example, the new syntax supported in Java 2 Standard Edition 5.0 would require changes to any custom compilers and interpreter. Additionally, it should be possible to visualize programs with graphical user-interfaces built from libraries such as Swing and AWT. These criteria have guided our research into effective means of visualizing execution states and runtime details. The fundamental steps required to develop a visualization environment in keeping with the above requirements are: creating a visual operational semantics for Java; developing a model for interaction and reverse execution; generating multiple versatile and customizable views of runtime state; and integrating these into an application framework. The resulting tool would be usable as a visual debugger and as a teaching aid. To this end, we have created a prototypical tool called JIVE: Java Interactive Visualization Environment. The remainder of this paper is structured as follows: Section 2 surveys the related work in order to give the context and motivation for JIVE; Section 3 describes in general how and why we provide multiple, interactive, customizable views of Java program states and execution history; Section 4 describes the specific changes made to our visualization notation in order to support the nuances of Java runtime semantics; Section 5 gives an overview of the software architecture of JIVE, specifically focusing on its modular design and capacity for interactive execution; Section 5 also describes our view of runtime history as a database that can be queried for information; and Section 6 summarizes our contributions and outlines areas of further research.
2
Related Work
In the previous section, we outlined the requirements for the interactive visualization of Java. To the best of our knowledge, there is no tool that meets all of these criteria, though there are many projects that address one or more of our requirements. A few prominent projects from each category are identified, and their relationship to this work is discussed. Integrated Development Environments. The system we describe is not a programming environment, but its debugging capabilities merit comparing it to the debuggers present in common IDEs. Common development environments such as
Eclipse and Microsoft VisualStudio provide integrated debugging tools, but despite advances in development tools, these debuggers are still intrinsically based upon the classic dbx. The interfaces are based on interactions of text rather than interactions among graphical components, and so important relationships among methods and objects are lost. Our user studies have revealed that our notation is significantly more useful to students who are learning the object-oriented methodology. The simple list and tree visualizations of DDD [Zeller and Lutkehaus 1996] (a front-end to dbx) also do not capture the concept of objects as environments. The Smalltalk Inspector [Goldberg and Robson 1980] provides a view of objects similar to the visual semantics we propose. However, it does not provide a view of program history, nor does it visualize object graphs or methods in their inherited object contexts. Visualization and Animation Tools. One important branch of visualization research involves visual representations of performance analysis metrics such as memory usage, time spent in methods or classes, etc. Examples include BLOOM and Jive (not to be confused with our own system, JIVE), a low-overhead tool for dynamic visualization of Java [Reiss 2001; Reiss 2003]. The focus of such tools is substantially different from ours, which relates more closely to clarifying individual program states and object interactions. There is a branch of related work that is dedicated to pedagogic applications of program visualization. DYNALAB is a tool that enhances lectures or laboratory exercises with program animation techniques [Birch et al. 1995]. Although it does not appear to be currently in active development, it was one of the first systems to support reverse execution through a virtual machine. Another such tool is jGRASP [Hendrix et al. 2004], which is a development environment designed for educational use. It has integrated a true visual debugger, and it provides dynamic state visualization rather than animation of specific algorithms [Brown and Sedgewick 1985]. jGRASP provides intuitive graphical representations of program design and runtime structure, but it does not provide a visual operational semantics for Java; the visualizations are intentionally abstract in order to be understood at a high level. Also, jGRASP does not include support for interactive execution in the reverse direction, and hence cannot provide for comparative analysis of program histories or querying facilities. BlueJ is another prominent visual tool for teaching Java programming [K¨ olling and Rosenberg 2001]. The main visualization feature of BlueJ is its ability to program through the creation of interactive class diagrams. BlueJ solves many common problems of teaching the objects-first approach to computer science, but BlueJ does not highlight the important fact that objects are environments of program execution: it does not display structural relationship between objects, and it does not provide a visualization of method activations in their appropriate object environments. BlueJ helps teach the objects-first approach, but it ignores some low-level details of scoping and the complex interactions of objects at runtime. As we illustrate, it is possible to show such details through a combination of abstraction and elision, using multiple views and levels of granularity; this addresses the problem of information overload, that visualizing a nontrivial program’s execution in complete detail is impractical [De Pauw et al. 2001]. Other related work is focused more on visualization than on pedagogic applications. The “cel” visualizations of Walker et al. show a high-level model of object-oriented execution [Walker et al. 1998]. This technique requires the
engineer to specify what information is visualized, and it is designed for the dynamic environment of program execution. Our approach shows a much lower-level visualization, clarifying individual states and object interaction in history, rather than high-level behavior such as class-level abstractions [Richner and Ducasse 1999]; our intent is significantly different despite outward similarities. Matrix Visual Tester (MVT) is similar to JIVE in its design and intent [L¨ onnberg et al. 2004]. It is designed as a visual debugging aid, and it supports forward and reverse execution. Both MVT and JIVE rely on abstraction and elision, automatic and user-controlled, to reduce the amount of information presented in the visualization. MVT uses bytecode instrumentation and allows the user to dynamically change variables, whereas JIVE uses unmodified class files and does not allow for dynamic changes to programs. To contrast, JIVE does not perform any re-execution, and therefore avoids the viscosity problem, which occurs when a user steps backward and makes a change that invalidates recorded states; MVT also does not support interactive queries through an execution database. Interactive Execution. Reversible execution has been explored in two general forms: re-execution [Zelkowitz 1973] and state-saving [Balzer 1969]. The re-execution model uses repeated executions of a program to reach the desired point in execution. This model has the advantage that there is not much data to be logged, but it has the obvious drawback that execution must be repeated each time a single backward step is made. JIVE uses the state-saving model, which has the drawback that transaction logs grow quickly. However, increased processor speed and decreased cost of memory continue to reduce the overhead of our approach. JIVE’s state-saving mechanism uses a form of declarative event recording and analysis similar to some earlier work [Richner et al. 1998], though the events themselves are tailored for integration with Java through the Java Platform Debugger Architecture (JPDA). Our model of recording program execution allows for queries that are not just on specific states, as in the Fox query language [Potanin et al. 2004], but also over execution history. However, this technique precludes the possibility of effective memory-usage and time-efficiency analysis, since JIVE imparts certain operational costs on execution. Our Previous Work. This work considerably extends our previous work in interactive visual execution of Java. Our earlier work [Gestwicki and Jayaraman 2002] served as a proof of concept that a modified contour model of execution can be used to visualize Java execution, and furthermore that such a model supports interactive execution (forward and reverse stepping through execution states). This earlier model was based on a source-code transformation that converts an arbitrary Java program into a self-visualizing Java program. We have since altered our model to one that does not use source-code transformation; this advancement frees us from the task of writing complicated parsers that are beholden to the evolving Java grammar. Instead of transforming the source code, we use the JPDA to initiate communication between JIVE and the program being visualized and to monitor the program for events that affect the visualization. Our visual semantics for Java is an extension of our previous work; we have extended the notation to support static contexts, inner classes, threads, and Java’s unique overriding and shadowing behavior. We have further enhanced our model by providing multiple views of the execution state at customizable levels of detail. The history of program execution is shown using interactive sequence diagrams that
allow the user to inspect arbitrary execution states without having to step forward or backward to them. Another considerable advance is the view of program execution history as an object-oriented database: it is possible to query the execution history for information on methods, variables, and structures, and multiple execution histories can be compared. This database view of program execution is made possible by recording key events during execution.
3
Multiple Views of Execution
In our earlier work, we showed that an extension of the contour model [Johnston 1971] provides a clear depiction of the execution of object-oriented programs [Gestwicki and Jayaraman 2002; Jayaraman and Baltus 1996]. Contour diagrams were introduced for understanding recursion and scope rules in statically-scoped procedural programming languages such as Algol and Pascal. In essence, the classical contour diagram consists of a set of nested rectangles, or contours, where each one represents the runtime information of the activation of a procedure-level construct. This runtime information can include the bindings for parameters and local variables, the source code associated with the construct, the executable instructions, and appropriate linkage information. Traditional contour diagrams are insufficient to capture the history of execution, and large diagrams are too detailed to facilitate the understanding of runtime states. In order to address the first problem, we provide multiple, customizable, abstracted views of the program state that emphasize different aspects of execution. To depict execution history, we employ time sequence diagrams as defined in the Unified Modeling Language. We will consider some sample visualizations before exploring details of contour semantics for Java in Section 4. Consider a binary search tree of integers, BST, and a subclass that counts duplicates, DupTree. An outline of the implementation is given below: class BST { ... private BST left, right; protected int data; public void insert(int v) { if (vdata) if (right!=null) right.insert(v); else right = makeNode(v); } ... } class DupTree extends BST { private int count; public void insert(int v) { if (v==data) count++; else super.insert(v); } ... } This example may be deceivingly simple to a reader who is familiar with object-oriented methodology, but this basic program highlights our focus on objects as environments. The insert method of DupTree, for example, refers to a member variable data through a reference to this, but there is no data member defined in the DupTree class. Under-
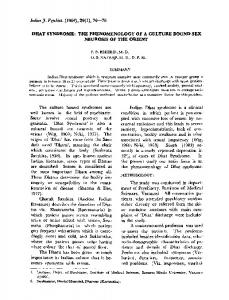
Figure 1: Two JIVE screenshots. The left object diagram is a detailed view, and the right is a compact view. Both screenshots illustrate simultaneous view of the sequence diagram, and source-code highlighting is included on the left.
standing how this and data are resolved requires an understanding of inheritance and variable shadowing. Our visualization methodology is able to clarify the relationships among these features of object-oriented languages in general and Java in particular.
Detailed Views One possible visualization of the binary search tree is a detailed view, as shown in the left side of Figure 1. This view shows objects’ complete states, including inherited members. The activation of the insert method (in blue) is placed within its proper object context, in this case, the root of a binary search tree; its caller is the main method, shown in the red static context in the upper-left of the screenshot. The member tables of each contour have been expanded in this diagram. These tables show the variables defined within the contour’s context; the tables can be configured to show method definitions as well, but we have found this to take inordinate space in the visualization. It is not generally necessary to show the member tables of every contour (as in the right screenshot of Figure 1, but it is done in this figure in order to demonstrate the highest level of detail. The screenshot also shows specifically how structural links are built between contours: the link starts at the value cell of the member table and is drawn to the contour being referenced. This allows structural links to properly implement static variable scoping with inheritance. The nesting of methods within their object contexts (and of subclass contours within their superclass contours) is used to clarify the semantics of static scoping. For example, the highlighted code in Figure 1 references the variables left
and v. The latter is defined within the method as a formal parameter, and so its scope is clear; however, there is no symbol left within the insert method activation. Such symbols can be resolved by stepping outward through the containment hierarchy. In this case, left is defined within BST:1, and that is the symbol referenced by insert. This technique is fundamental to the contour model and has been shown to be directly applicable to object-oriented languages that exhibit single inheritance [Jayaraman and Baltus 1996].
Compact Views The upper-right portion of Figure 1 gives another possible visualization of a program execution state. This is a compact view, a visual paradigm in which many of the details are elided. The nodes of the tree are shown as dark-bordered instance contours. Each is named for the class of which it is an instance (in this case, DupTree), and an instance count is added to distinguish individual objects. For example, DupTree:1 is the first instance of the DupTree class. The instance contours make up the instance space; the static space is made up the light-bordered static contours. There is one static contour for each class loaded by the Java system. A static contour is nested within its superclass’ static contour, and so since all classes in Java are subclasses of java.lang.Object, all static contours are nested within the static contour for java.lang.Object. The complications and implications of the instance/static dichotomy will be explored in Section 4 along with other Java-specific concerns. The arrows in the diagram are structural links, which indicate that there is a reference from one object to another. These links show the connection between nodes that form
the binary tree structure, and they correspond directly to the left and right member variables of BST.
Sequence Diagrams The lower-right portion of Figure 1 shows the history of execution through a sequence diagram; the visible portion shows the beginning of the this program’s execution. Both the static and object contours are shown as contexts along the top of the sequence diagram since both are environments of method execution. The method activations themselves are shown as rectangles along the vertical lifelines of their respective contexts. The main method is the leftmost method activation, and it is responsible for the creation of the first three tree nodes, DupTree:1, DupTree:2, and DupTree:3. The methods labeled “” indicate the creation of the new context by calling its constructor. Java uses this symbol internally to refer to constructor and instance initializer invocations, and so we adopt the notation here. Since JIVE is an interactive environment, we allow the user to scroll through the sequence diagram and select contexts or method activations, and JIVE will jump to the contour diagram visualization for those states. Method contours represent method activations. Method contours have a member table that contains the local variables of the method, including parameters, along with the return point and dynamic link. The member tables of method contours, like those of instance and static contours, may be hidden or shown on demand. Method contours are nested within their defining contexts. The figure shows how the insert method in DupTree calls the insert method in its surrounding BST contour. JIVE shows the source code for the current method, and the currently active source code line is highlighted. Different highlighting colors can be used for each thread to further clarify the execution state.
Call-path and Minimized Views In a call-path view, contours with method activations are shown in compact view and those without are in minimized view. When minimized, contours are drawn as simple points, as shown in Figure 2. A call-path view is convenient when the user wishes to focus on a specific method activation or series of method activations. The overall structure is still visible, but visually complex details are not. If some details were of no interest to the user, he or she could simply hide the entire contour from view through view filtering. Figure 2 shows a contour diagram that has been fully minimized. The fully minimized view is useful when one wishes to see the overall structure without showing any contour’s internal details. We provide convenient actions that will expand all contours, stack all contours, minimize all contours, or show the call-path view. Additionally, the user can select any individual contour and choose to expand, stack, or minimize it, or to show or hide its member table. This puts control over the visualization into the domain of the user.
Analysis of Programs and Diagrams The fact that there is a relationship between diagrams and programs is generally accepted. It is common for those teaching introductory computer science to use graphical notations to demonstrate concepts of object-orientation. The contour model notation provides a standard methodology for visualizing Java runtime states. Using JIVE, we are able
Figure 2: Minimized view of a contour diagram. All objects are shown as simple points.
to perform a more systematic analysis of the relationship between programs and the diagrams they engender. Design patterns are used during system design in order to make the best use of object-orientation [Gamma et al. 1995]. Analysis of program design is beneficial, but it does not necessarily translate into understanding of runtime states. Design patterns are explained in terms of their design and their runtime behavior. Using JIVE, we are able to see and interact with the runtime behaviors, providing an excellent tool for explaining patterns to students; we have used JIVE in this manner in a graduate-level seminar with much success. Furthermore, a user may use JIVE as a visual debugger when analyzing runtime states. The difference between a programmer’s mental model of a program and the visualization of the program can expose the location and nature of the error. Consider, for example, an application that uses Java’s Swing library. The object diagram of such a program will contain a tree-like structure of GUI objects: the root will be a window frame, and the leaves will be buttons, text fields, and other widgets. There should be a small number of observer objects that are connected to the user-interface components and monitor them for state changes. Essentially, the object structure consists of a fixed hierarchy along with instances of the observer design pattern. This structure will repeat in different application domains as long as the programs share a similar GUI structure. It is possible that this type of structure may occur in non-GUI applications as well: consider the object structure of an application that processes a hierarchical filesystem and monitors files for change. The basic structure of these two object diagrams is the same, and so they can be rendered in JIVE in similar ways in order to highlight the parallels.
4
Visual Operational Semantics for Java
The original contour model semantics for procedural languages has been extended to general object-oriented lan-
guages; these extensions showed how objects are environments of execution, an essential perspective through which the contour model can be used to clarify the semantics of object-orientation [Jayaraman and Baltus 1996]. This model requires significant modification in order to be applied to Java, specifically with respect to static contexts, inner classes, multithreaded applications, and overriding and shadowing. In this section, we explore these new extensions to the contour model semantics.
Static Contexts In the standard object-oriented contour model, runtime states are represented with object and method contours. This model is sufficient for a language where all runtime data is encapsulated in objects and their methods, but Java introduces the notion of static members. Variables, methods, and inner classes can be declared as static, and these static members are associated with a class rather than a particular instance of the class. A static contour is introduced into the contour diagram for each static context. Since there is only one static contour for any class, no instance count is necessary. Invocation of a static method is represented by nesting a method contour within the appropriate static contour. We define an implicit static link that connects an instance contour Ci to the static contour of its defining class, C. Drawing these links explicitly for every instance of a class will quickly reduce diagram legibility; it is sufficient to have implicit links since the names of instance contours clearly relate them to their corresponding static contour. Adding a separate static space in the diagram requires that we add the following requirement to the standard search strategy for resolving symbols. Given a class C, a static contour C for C, and an instance contour C:i of C: if a symbol is not found in the member table of C:i, then the static link is followed, and the symbol is sought within the member table of C; if the symbol is not found in C, then attempt to resolve the symbol in the parent of C:i. This implements the proper semantics of Java’s scoping of static members, and it maintains the planarity of the contour diagram.
Inner Classes An inner class is a class defined within the context of another class [Gosling et al. 2000]. We deal with anonymous inner classes and named inner classes in the same manner, using Java’s numbering system to identify anonymous inner classes. Non-static inner class instances are always contained within exactly one enclosing instance, and so to reflect this, the instance contour for the inner object is nested within the instance contour of the enclosing instance. Non-static inner classes may not define static members, and so unlike noninner classes, there is no static counterpart to a non-static inner class. Static inner classes are associated with a class’ static context, and so the instance contours for static inner classes are nested within the static contour for their enclosing class. Static inner classes may define static members, and so each static inner class has a static contour; the static contours of static inner classes require no special handling and are treated as any other static contour. As an example, consider an alternate binary search tree implementation that uses inner classes. The BST2 class defines a non-static inner class, Node, and the tree structure is recursively defined over Node instances rather than BST2 instances. Figure 3 shows the object state when the second tree node has been inserted. The two instances of the in-
Figure 3: Contour diagram showing non-static inner class instances. BST$Node is an inner class of BST. Each non-static inner object is contained within its enclosing instance.
ner class, BST2$Node:1 and BST2$Node:2, are both nested within the single instance of BST2, BST2:1. This figure also serves to illustrate the problem of nested graph processing in contour diagrams: any contour may have an arbitrarily complex and dynamic nested contour structure.
Overriding and Shadowing The traditional contour model for object-oriented languages adds two intracontour links to the member table of each instance contour: a this (or self) link that points to the innermost object of a stack of contours, and a super pointer that points to the superclass contour of a contour, if one exists [Jayaraman and Baltus 1996]. The intention of the this intracontour link is to show overriding; an expression such as this.toString() will always refer to the implementation of toString() that is deepest in the class hierarchy. However, due to Java’s variable shadowing and method overriding, the meaning of the this link can be deceiving regardless of how it is drawn. Drawing the this link as described creates a contradiction when referencing shadowed variables through it. Similarly, if this refers only to the contour containing itself, which would provide a clear visual semantics for shadowing, then the overriding of methods is not clearly expressed. This is an inherent shortcoming of any visual operational semantics for Java. It is impossible to resolve the method and variable referencing uses of this using only one intracontour link due to its two syntactic uses. The complications of this are not insurmountable in JIVE. The dichotomy between method overriding and variable shadowing can still be explained using JIVE diagrams since the different contour contexts are clearly visible in
5
JIVE Architecture
In this section, we give an overview of the architecture of JIVE. High-level descriptions are provided for the interprocess communication mechanism by which JIVE and its visualization client share data, the model for interactive execution, and the database query subsystem. We also present some of the graph drawing research issues involved in JIVE.
Two-Process Architecture
Figure 4: Sequence diagram with concurrent threads. The main thread, shown in blue, terminates after initializing the two Chase$Runner thread objects. The other two threads have set up a simple chase condition.
a detailed view. Since object-orientation favors encapsulation of data, we expect method overriding to be much more prevalent than variable shadowing in real Java applications. Therefore, in JIVE, we do include a this reference in the member table which refers to the innermost instance contour in a collection of nested contours, and we leave the detailed explanation of overriding and shadowing to an instructor.
Threads Java supports multithreaded applications; in fact, every Java program that has a Swing or AWT user-interface is inherently multithreaded since the JVM will automatically start the AWT-Event thread to process user input. Multiple concurrent threads imply multiple simultaneous paths of method calls. This is easily represented in the contour model through visual cues on methods and their return links. Each thread’s path of execution is drawn in a different color. Even if the same method definition is being used by multiple threads, each thread has its own method contour since each thread has its own stack. The same colors are used to highlight the multiple threads of a contour diagram and sequence diagram as well as the source code; this enforces the interdependence of the view of the current state (contour diagram and source code highlighting) and the history of execution (sequence diagram). The JIVE-generated sequence diagram for a simple multithreaded program is shown in Figure 4. The program being visualized simply starts two threads and lets them race to a finishing condition.
We have explored the use of source-code transformation in order to produce visual representations of the runtime state in previous visualization tools [Gestwicki and Jayaraman 2002]. This model is difficult to maintain for a growing language such as Java. Each time the language or libraries change, changes must be made to any custom compilers or interpreters that are written. Our current approach abandons program transformation in favor of a two-process architecture. The visualization environment itself runs in one process. The user provides to JIVE the program he or she wishes to visualize, and JIVE starts the application in a second process, called the client process. Communication between the two processes is made possible by the Java Platform Debugger Architecture (JPDA)In order to guarantee source-code highlighting functionality, a program must be loaded from its source code, but JIVE can run visualizations from compiled class files as long as they contain debug information. JIVE supports multithreaded programs that are uniprocessing, but the design does not currently allow for visualization of distributed or multiprocessing applications. Once JIVE has started the client process, it registers listeners via JPDA and awaits notification. When the client’s state changes, its execution is suspended, and notification of the event is sent to JIVE for processing. Once the data model and the appropriate views have been updated, JIVE resumes the client program and returns to waiting for events. The amount of processing that the client performs before suspending is depends on user preferences. JIVE allows for different step sizes, including individual source code lines, method invocations, or traditional breakpoints in the source code. It is also possible to disable event suspension, in which case events stream continuously into JIVE, which processes them sequentially.
Interactive Execution As the client program runs, it is monitored for changes; these changes are stored by the JiveLog subsystem. The log is coupled with a database into which execution history is stored. The JIVE prototype uses an in-memory model for faster queries and processing, but the entire model can be externalized in situations with excessive data or limited memory. The log can be saved to a file for offline analysis. Execution events received from the client are interpreted into a simpler set of events by JIVE. The execution history is therefore expressed through a sequence of declarative events [Richner et al. 1998]. These events are memento objects which are able to commit or un-commit themselves from a program state model [Gamma et al. 1995]. In this way, multiple states can be shown at once by notifying the state models which events have been committed or rolled back. The seven events used by JIVE correspond to the following execution events: static context creation, object creation, method call, method return, exception thrown and caught, change in source line, and change in variable value.
Each of these events is encapsulated as an object, and the object contains enough information about the event to commit or un-commit itself from the execution log. Essentially, each event contains a prototype of the change it will make to the execution state, in a manner similar to templates or prototype-driven programming [Ungar and Smith 1987]. Stepping backward in JIVE does not affect the client program, only the current visualization. The client program is suspended while the user inspects past states, and it is resumed when necessary. While this model does preclude the possibility of altering program inputs, it also avoids the problem of maintaining synchronization with external resources such as data streams or input/output devices. For example, when a program with a graphical user-interface is run through JIVE and the user steps backward, the interface will cease responding while the client process is suspended. This is because the client’s event thread, which is responsible for redrawing the client program’s interface and processing input events, is suspended along with all other threads. If a program were un-executed (as opposed to rewinding visualizations), irreversible computations may be performed, or a stream may be read that cannot be pushed back; hence, we abide by a general model that client programs are unilaterally suspended while visualizing recorded states. Multithreaded applications are handled elegantly in our execution model. Since we restrict to uniprocessing systems, there is only ever one instruction being executed at a time. JIVE is aware of the thread on which an event occurs. The active thread is recorded in the execution log and reflected in the visualization (see Figure 4).
Drawing Object and Sequence Diagrams The object diagrams used in JIVE are complicated structures, and optimal drawing is difficult. There is a wide range of research in graph drawing algorithms [Eades et al. 1999]; however, the object diagrams we describe cannot be trivially converted into graphs. Specific properties of contour diagrams that complicate automated graph drawing include: • Nested structures. Within a contour there may be an complex nested diagram. • Multiple types of nodes. There are instance contours, static contours, and method contours, and each behaves differently. Additionally, special representations may be required for visualization of certain Java types such as arrays and Collection classes. • Multiple types of edges. There are structural links and return links, and they have different behaviors. Method return links are tied to the life-cycle of a single method contour. Structural links from method contexts have substantially different lifetimes than structural links from object members. • Multiple types of crossings. A generally accepted graphdrawing aesthetic is that the crossings of edges should be minimized [Eades et al. 1999]. In contour diagrams, there can be crossings between heterogeneous links and between the boundaries of different types of contours. It is possible to convert contour diagrams into multigraphs. Different weights can be given to different types of links. Method return links are inherently ephemeral, as they last only as long as the method activation; hence, we give structural links a higher weight than return links in the graph conversion. The resulting graph is then layered using a
modification of Coffman-Graham layering [Coffman, Jr. and Graham 1972; Eades et al. 1999] for multigraphs, and the crossings are minimized, yielding a layered graph drawing. An inverse transformation is applied to revert the multigraph into the contour diagram. In our preliminary testing, this works well for simple hierarchical structures such as trees and graphical user-interface composition. Simple greedy layouts, where objects are simply drawn in the order they are created and locked into their positions, have proven ineffective in our experimentation. Sequence diagrams, though essentially simpler than object diagrams, are still difficult to draw. Minimizing crossings and back edges (i.e. method calls that point left) can be done by finding an optimal horizontal arrangement of lifelines. The goal of JIVE is to provide a robust environment for visualization, and its multiple concurrent views gives the user the freedom to focus on details of interest. When using JIVE as a teaching tool, it may be useful to show fully-detailed contour diagrams to explain concepts such as inheritance and aggregation. However, for larger programs, it is impractical to show this much detail. JIVE supports multiple views with multiple levels of detail. We also have a model for filtering the visualizations; for example, a user may only be interested in their own classes, so they may apply a filter to exclude the visualization of all classes in packages starting with java. Another user may wish to study the Swing packages, so he or she could exclude all java classes except those in the javax.swing package and subpackages. Default sets of filters can be used for general application in pedagogic or debugging applications; for example, an instructor wishing to use JIVE could configure filters known to be useful for the specific applications being visualized.
Runtime History Database The interaction model maintains a complete traversable record of program history. These storage structures can be conceptualized as a database of runtime state information. In a relational database, queries are performed on a table or groups of tables, and the results of these queries can be values and new tables. In our runtime state database, queries are performed on the history of runtime execution or on portions thereof, and the results are values, sets of states, or portions of program history. Furthermore, we have a visual representation of program states and program history, and so both queries and the results can be visual. One aspect of runtime database querying is variable tracking. A variable is selected in JIVE, and its value is monitored for changes. An instance or local variable may be tracked in a particular object or across all instances of an object. Static variables are tracked in the static context and for usage in objects of the class. When the user initializes variable tracking, he or she specifies a condition for the variable, such as its value being changed or within a range (for numerical values). The result of the variable tracking is highlighted through the JIVE interface. As an example, consider variable tracking of the count variable in the DupTree class from the previous examples. A user investigating the DupTree may wish to know when the count changes to a value besides its default of 1. In the visualization of the current state, DupTree:2 is highlighted since it is the contour that contains the count member that changed. Additionally, the insert method that caused the change in count is highlighted in the sequence diagram, and an arrow points to the specific point at which the change was made. JIVE’s architecture allows for the execution history
database to be written to a file for future use. A program’s history file can be loaded and visualized as if the program was running, but without needing to actually compile and run the program. This serialization of execution histories also makes it possible to compare executions. Multiple execution histories may exist for a program as small changes were made to it, and through JIVE, a user can visualize the differences between program executions. It is also possible to perform queries that span program executions, and the results of these queries are sets of views.
6
Conclusions and Future Work
Our preliminary studies of JIVE’s effectiveness have been very positive. Object diagrams have proven useful for debugging, especially when JIVE clarifies the difference between a user’s imagined structure and the actual structures created. The JIVE-generated sequence diagrams have proven invaluable in explaining the behavior of various design patterns and program constructs, and they are further clarified by the capability to view the details of the object and method calling structure at varied levels of detail. The color-highlighting of threads in object and sequence diagrams has been instrumental in explaining the behavior of multithreaded programs. This has been especially true for programs with graphical user-interfaces: the sequence diagram clarifies how the event-processing thread handles user input and drawing the GUI, and how complicated processing tasks can be deferred to other threads. We have used different forms of the tool and the visual semantics in introductory-level computer science courses, intermediate undergraduate courses, and graduate-level courses. Though the sequence diagrams have proven highly effective in both explaining program execution and detecting errors, program history becomes very complicated in large or long-running programs. We are investigating means by which the program history information can be modularized and multiple views can be provided akin to the compact, minimized, and detailed views of contour diagrams. In addition to the aesthetic problem of providing a comprehensible diagram, there is a theoretical problem of how to most efficiently structure a dynamically-growing sequence diagram. This is an area where analysis of program source code may provide an insight into the optimal ordering of lifelines before program execution even begins. The current interaction module supports only stepping forward and backward or running to breakpoints, including the start and end of a program as default breakpoints. This model makes it inefficient to “jump” from one program state to another distant state since all of the changes between the two states must be processed sequentially. Despite this inefficiency in processing time, it should be noted that the stated approach is optimally efficient in storage space, since each change that must be recorded is recorded exactly once. However, our studies confirm that shorter response-times provide for a better atmosphere for understanding a program. The best way to increase the effectiveness of these jumps between states is to store redundant, composite transaction information at key points in program execution. The source code, when it is available, can be analyzed in order to determine the dependencies among methods and data [Chen and Xu 2001; Grove et al. 1997]. Our current approach involves the development of an ontology of programs in order to determine the analysis techniques that produce the best results for different types of programs. Generating good drawings of object diagrams is a difficult
problem. Despite the wide range of graph-drawing techniques, the unique properties of our diagrams prevent the direct application of known techniques. Existing dynamic graph drawing approaches [North 1996; Moen 1990; Cohen et al. 1992; Ryall et al. 1997] handle the problem of general dynamic graphs, but it is not clear that diagrams of object runtime interactions can be constructed as simple graphs. We are investigating how to use the class diagram to predict and generate good drawings of object diagrams. The current set of queries supported by our model is limited, but we are currently developing a more formal query language, improving result organization, and enhancing the visual interfaces. The runtime history database also has many applications outside of program visualization and comprehension. Comparative analysis of program execution is a useful tool for system security testing; by running a program many times, it may be possible to extract a mathematical description of what “normal” execution is. If a program then exhibits aberrant behavior, it can be marked as a potential security risk. The results of the comparison can be visualized with JIVE.
Acknowledgements Ashim Garg contributed to the theory behind JIVE’s dynamic drawing capabilities. The internal representation of states was developed with the help of Eric Crahen. Hani Girgis, Akshay Hegde, and Manu Pushpendran have assisted in the development of JIVE’s query system.
References Agrawal, H., Demillo, R. A., and Spafford, E. H. 1993. Debugging with dynamic slicing and backtracking. Softw. Pract. Exper. 23, 6, 589–616. Balzer, R. M. 1969. Exdams: Extendable debugging and monitoring system. In Proc. AFIPS, AFIPS Press, Montvale, N.J., vol. 34, 567–580. Birch, M. R., Boroni, C. M., Goosey, F. W., Patton, S. D., Poole, D. K., Pratt, C. M., and Ross, R. J. 1995. Dynalab: a dynamic computer science laboratory infrastructure featuring program animation (abstract). In SIGCSE ’95: Proceedings of the twenty-sixth SIGCSE technical symposium on Computer science education, ACM Press, 29–33. Booch, G., Rumbaugh, J., and Jacobson, I. 1999. The Unified Modeling Language User Guide. Addison Wesley Longman, Inc., Reading, Massachusetts. Brown, M. H., and Sedgewick, R. 1985. Techniques for algorithm animation. IEEE Software (January), 28–39. Chen, Z., and Xu, B. 2001. Slicing object-oriented java programs. SIGPLAN Not. 36, 4, 33–40. Coffman, Jr., E. G., and Graham, R. L. 1972. Optimal scheduling for two-processor systems. Acta Informatica 1, 3, 200–213. Cohen, R. F., Di Battista, G., Tamassia, R., Tollis, I. G., and Bertolazzi, P. 1992. A framework for dynamic graph drawing. In Proceedings of the eighth annual symposium on Computational geometry, ACM Press, 261– 270.
De Pauw, W., Helm, R., Kimelman, D., and Vlissides, J. 1993. Visualizing the behavior of object-oriented systems. In Proceedings of the eighth annual conference on Object-oriented programming systems, languages, and applications, ACM Press, 326–337. De Pauw, W., Mitchell, N., Robillard, M., Sevitsky, G., and Srinivasan, H. 2001. Drive-by analysis of running programs. Tech. rep., IBM T.J. Watson Research Center. Eades, P., Di Battista, G., Tamassia, R., and Tollis, I. G. 1999. Graph Drawing: Algorithms for the Visualisation of Graphs. Prentice-Hall, New Jersey. Gamma, E., Helm, R., Johnson, R., and Vlissides, J. 1995. Design Patterns: Elements of Reusable ObjectOriented Software. Addison Wesley Longman, Inc., Reading, Massachusetts. Gestwicki, P., and Jayaraman, B. 2002. Interactive visualization of Java programs. In IEEE Symposium on Human-Centric Computing, Languages, and Environments, 226–235. Gestwicki, P., and Jayaraman, B. 2004. Jive: Java interactive visualization environment. In OOPSLA 2004 Conference Companion, 615–616. Goldberg, A., and Robson, D. 1980. Smalltalk – The Interactive Programming Environment. Addison-Wesley.
Mukherjea, S., and Stasko, J. T. 1994. Toward visual debugging: integrating algorithm animation capabilities within a source-level debugger. ACM Trans. Comput.Hum. Interact. 1, 3, 215–244. North, S. C. 1996. Incremental layout in dynadag. In Proceedings of the Symposium on Graph Drawing, SpringerVerlag, 409–418. Potanin, A., Noble, J., and Biddle, R. 2004. Snapshot query-based debugging. In Australian Software Engineering Conference, 251–261. Reiss, S. P. 2001. An overview of bloom. In Proceedings of the 2001 ACM SIGPLAN-SIGSOFT workshop on Program analysis for software tools and engineering, ACM Press, 2–5. Reiss, S. P. 2003. Visualizing java in action. In SOFTVIS, 57–65, 210. Richner, T., and Ducasse, S. 1999. Recovering highlevel views of object-oriented applications from static and dynamic information. In Proceedings ICSM’99 (International Conference on Software Maintenance), IEEE, H. Yang and L. White, Eds., 13–22. Richner, T., Ducasse, S., and Wuyts, R. 1998. Understanding object-oriented programs with declarative event analysis. In Object-Oriented Technology (ECOOP’98 Workshop Reader), Springer-Verlag, S. Demeyer and J. Bosch, Eds.
Gosling, J., Joy, B., Steele, G., and Bracha, G. 2000. The Java Language Specification, Second Edition. Addison Wesley Longman, Inc., Reading, Massachusetts.
Ryall, K., Marks, J., and Shieber, S. 1997. An interactive constraint-based system for drawing graphs. In Proceedings of the 10th annual ACM symposium on User interface software and technology, ACM Press, 97–104.
Grove, D., DeFouw, G., Dean, J., and Chambers, C. 1997. Call graph construction in object-oriented languages. In Proceedings of the 12th ACM SIGPLAN conference on Object-oriented programming, systems, languages, and applications, ACM Press, 108–124.
Ungar, D., and Smith, R. B. 1987. Self: The power of simplicity. In Conference proceedings on Object-oriented programming systems, languages and applications, ACM Press, 227–242.
Hendrix, T. D., Cross, II, J. H., and Barowski, L. A. 2004. An extensible framework for providing dynamic data structure visualizations in a lightweight ide. In Proceedings of the thirty-fifth SIGCSE Technical Symposium on Computer Science Engineering.
Walker, R. J., Murphy, G. C., Freeman-Benson, B., Wright, D., Swanson, D., and Isaak, J. 1998. Visualizing dynamic software system information through highlevel models. In Proceedings of the 13th ACM SIGPLAN conference on Object-oriented programming, systems, languages, and applications, ACM Press, 271–283.
Jayaraman, B., and Baltus, C. 1996. Visualizing program execution. In IEEE Symposium on Visual Languages, 30–37.
Zelkowitz, M. V. 1973. Reversible execution. Commun. ACM 16, 9, 566.
Johnston, J. B. 1971. The contour model of blockstructured processes. ACM SIGPLAN Notices, 255–282. ¨ lling, M., and Rosenberg, J. 2001. Guidelines for Ko teaching object orientation with java. In Proceedings of the 6th annual conference on Innovation and technology in computer science education, ACM Press, 33–36. ¨ nnberg, J., Korhonen, A., and Malmi, L. 2004. Mvt: Lo a system for visual testing of software. In AVI ’04: Proceedings of the working conference on Advanced visual interfaces, ACM Press, 385–388. Moen, S. 1990. Drawing dynamic trees. IEEE Softw. 7, 4, 21–28.
Zeller, A., and Lutkehaus, D. 1996. DDD - a free graphical front-end for UNIX debuggers. SIGPLAN Notices 31, 1, 22–27.